

The DOI matches its Crossref record; 1 of the 1 references it cites were found in a registry or an index.
Trichoderma asperellum (T42) and Pseudomonas fluorescens (OKC)-Enhances Resistance of Pea against Erysiphe pisi through Enhanced ROS Generation and Lignifications
Open accessAbstract
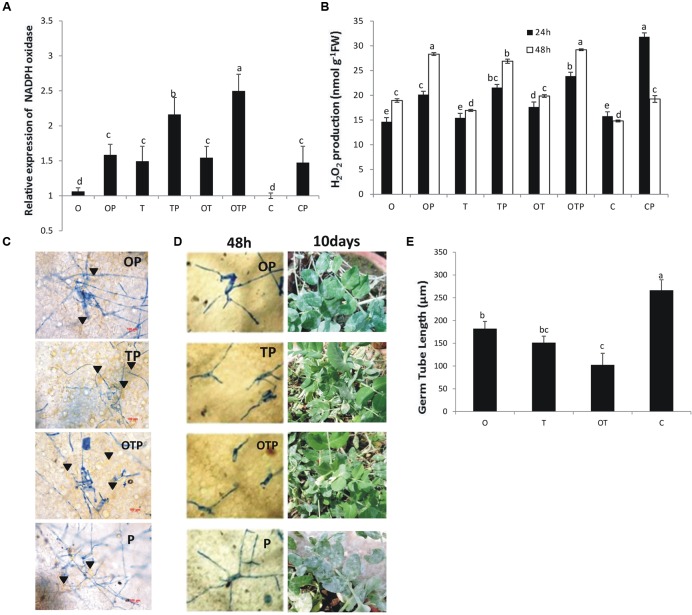
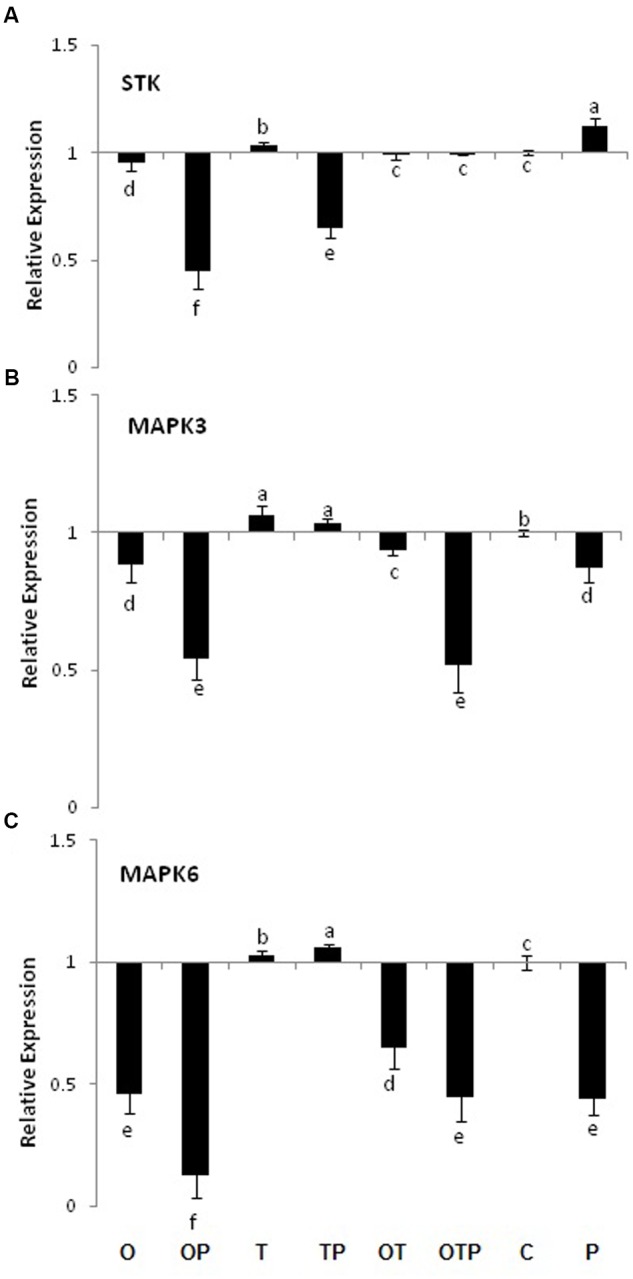
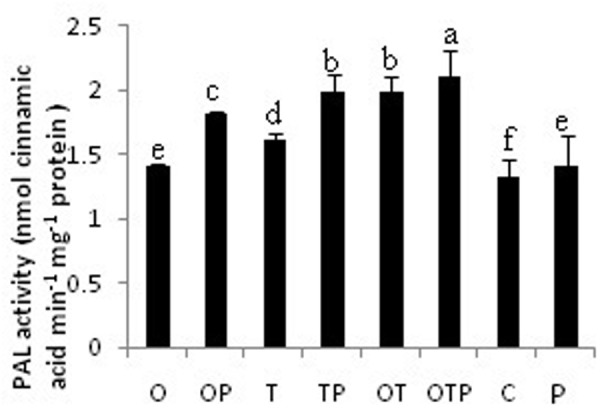
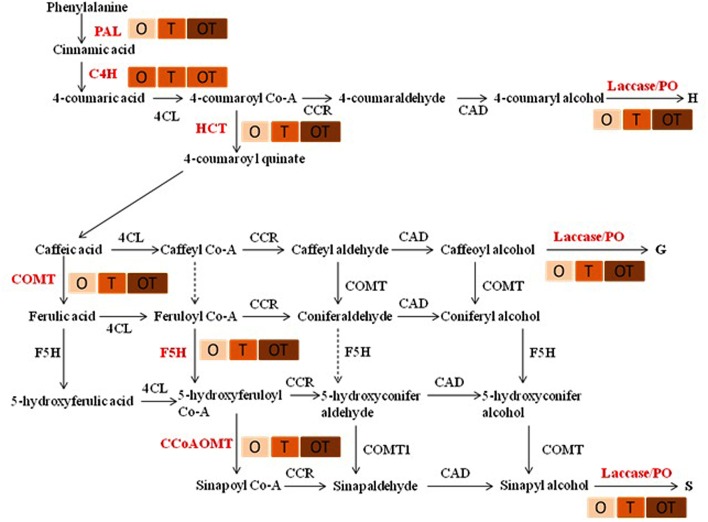
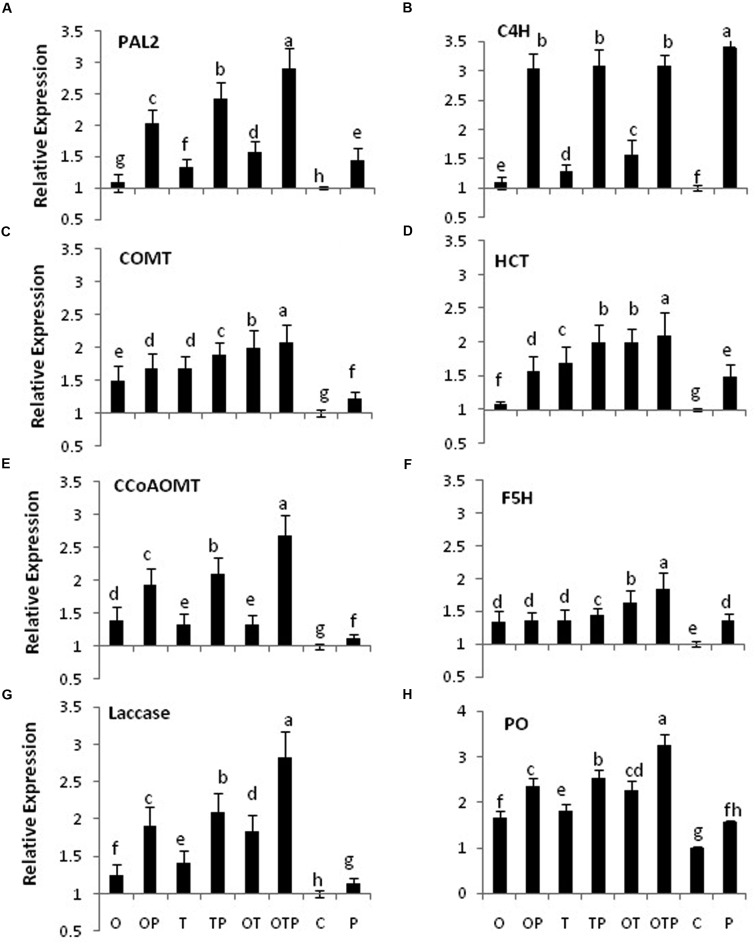
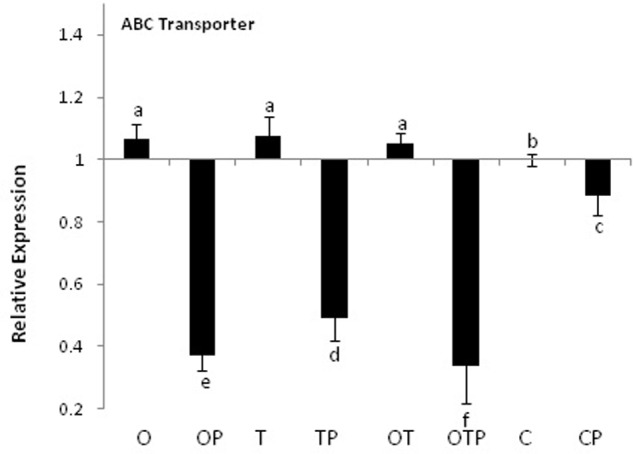
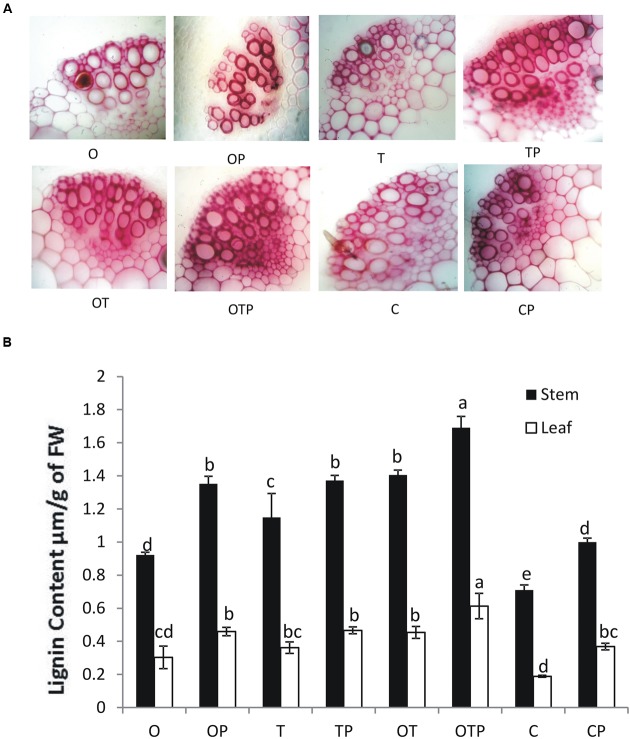
Plant signalling mechanisms are not completely understood in plant-fungal biotrophic pathogen interactions. Further how such interactions are influenced by compatible rhizosphere microbes are also not well studied. Therefore, we explored the pea-Erysiphe pisi (obligate biotroph) system to understand the interaction and applied compatible rhizospheric bio-agents Trichoderma asperellum (T42) and Pseudomonas fluorescens (OKC) singly or in combination to assess their influence on the host while under the pathogen challenge. Transcript accumulation pattern of some vital genes in the lignin biosynthetic pathway in pea under E. pisi challenge indicated enhanced activation of the pathway. Interestingly, transcript accumulations were even higher in the bio-agent treated plants compared to untreated plants after pathogen inoculation particularly in co-inoculated treatments. Further, down regulation of the lignifications-associated ABC transporter gene in the pathogen challenged plants possibly is an indication of passive diffusion of monolignols across the membrane from symplast. Additionally, up regulation of NADPH oxidase gene revealed ROS generation in the challenged plants which was confirmed through spectrophotometric estimation of H2O2. Up regulation of laccase and peroxidase along with higher H2O2 generation points out their involvement in lignifications which was further confirmed through cross section analysis of pea stems that showed increased lignifications in pathogen challenged plants co-inoculated with the bioagents. Interestingly, pathogen responsive MAPK homologs MAPK3/MAPK6 and the enzyme serine threonine kinase (STK) that activates MAPKs were down regulated and the results possibly indicate non-participation of the MAPK cascade in this interaction. Therefore, it can be concluded that the microbial treatments enhanced pea resistance to E. pisi by generation of ROS and lignifications.
Overview
The claims and statistics of this paper haven’t been checked yet.
Run the check — free, no account needed. It reads the open-access text and checks the sources it cites.
Integrity signals
Registry
Cites
Statistics
Figures
Verification
Claims the paper makes
The claims and statistics of this paper haven’t been checked yet.
Run the check — free, no account needed. It reads the open-access text and checks the sources it cites.
Self-check
Percentages, sums and reported differences re-computed from the paper’s own numbers.
The self-check needs the paper’s full text.
Citations
Cites
Oxidative stress and some antioxidant systems in acid rain-treated bean plants
Velikova, V, Yordanov, I., & Edreva, A. (2000) · Plant Science · doi:10.1016/s0168-9452(99)00197-1 · Cited by 5,299
Research works printed but not linked: 44
- Ali, 2011, Berry skin development in Norton grape: distinct patterns of transcriptional regulation and flavonoid biosynthesis., BMC Plant Biol., 11, 10.1186/1471-2229-11-7 · DOI
- Asai, 2002, MAP kinase signalling cascade in Arabidopsis innate immunity., Nature, 415, 977, 10.1038/415977a · DOI
- Bonawitz, 2010, The genetics of lignin biosynthesis: connecting genotype to phenotype., Annu. Rev. Genet., 44, 337, 10.1146/annurev-genet-102209-163508 · DOI
- Chabannes, 2001a, Strong decrease in lignin content without significant alteration of plant development is induced by simultaneous down-regulation of cinnamoyl CoA reductase (CCR) and cinnamyl alcohol dehydrogenase (CAD) in tobacco plants., Plant J., 28, 257, 10.1046/j.1365-313X.2001.01140.x · DOI
- Chabannes, 2001b, In situ analysis of lignins in transgenic tobacco reveals a differential impact of individual transformations on the spatial patterns of lignin deposition at the cellular and subcellular levels., Plant J., 28, 271, 10.1046/j.1365-313X.2001.01159.x · DOI
- Chen, 2007, Lignin modification improves fermentable sugar yields for biofuel production., Nat. Biotechnol., 25, 759, 10.1038/nbt1316 · DOI
- Cheng, 2015, Pathogen-secreted proteases activate a novel plant immune pathway., Nature, 521, 213, 10.1038/nature14243 · DOI
- Dence, 1992, “The determination of lignin,” in, Methods in Lignin Chemistry,, 33, 10.1007/978-3-642-74065-7_3 · DOI
- Fernando, 2007, Biological control of Sclerotinia sclerotiorum (Lib.) de Bary by Pseudomonas and Bacillus species on canola petals., Crop Prot., 26, 100, 10.1016/j.cropro.2006.04.007 · DOI
- Gallego-Giraldo, 2011, Selective lignin down regulation leads to constitutive defense response expression in alfalfa (Medicago sativa L.)., New Phytol., 190, 627, 10.1111/j.1469-8137.2010.03621.x · DOI
- Grant, 2000, The RPM1 plant disease resistance gene facilitates a rapid and sustained increase in cytosolic calcium that is necessary for the oxidative burst and hypersensitive cell death., Plant J., 23, 441, 10.1046/j.1365-313x.2000.00804.x · DOI
- Guo, 2001, Down regulation of caffeic acid 3-O-methyltransferase and caffeoyl CoA 3-O-methyltransferase in transgenic alfalfa: impacts on lignin structure and implications for the biosynthesis of G and S lignin., Plant Cell, 13, 73, 10.1105/tpc.13.1.73 · DOI
- Havir, 1987, L-phenylalanine ammonia lyase from soybean cell suspension culture., Methods Enzymol., 142, 248, 10.1016/S0076-6879(87)42034-X · DOI
- Hu, 2002, Activation of plasma membrane NADPH oxidase and generation of H2O2 mediate the induction of PAL activity and saponin synthesis by endogenous elicitor in suspension-cultured cells of Panax ginseng., Acta Bot. Sin., 45, 1434
- Jackson, 2008, Improving saccharification efficiency of alfalfa stems through modification of the terminal stages of monolignol biosynthesis., BioEnergy Res., 1, 180, 10.1007/s12155-008-9020-z · DOI
- Jain, 2012, Microbial consortium–mediated reprogramming of defence network in pea to enhance tolerance against Sclerotinia sclerotiorum., J. Appl. Microbiol., 112, 537, 10.1111/j.1365-2672.2011.05220.x · DOI
- Jalmi, 2015, ROS mediated MAPK signaling in abiotic and biotic stress-striking similarities and differences., Front. Plant Sci., 6, 10.3389/fpls.2015.00769 · DOI
- Kaneda, 2011, ABC transporters coordinately expressed during lignifications of Arabidopsis stems include a set of ABCBs associated with auxin transport., J. Exp. Bot., 62, 2063, 10.1093/jxb/erq416 · DOI
- Krusell, 2002, Shoot control of root development and nodulation is mediated by a receptor-like kinase., Nature, 420, 422, 10.1038/nature01207 · DOI
- Li, 2010, The growth reduction associated with repressed lignin biosynthesis in Arabidopsis thaliana is independent of flavonoids., Plant Cell, 22, 1620, 10.1105/tpc.110.074161 · DOI
- Liu, 2012, Deciphering the enigma of lignification: precursor transport, oxidation, and the topochemistry of lignin assembly., Mol. Plant, 5, 304, 10.1093/mp/ssr121 · DOI
- Llorente, 2005, ERECTA receptor-like kinase and heterotrimeric G protein from Arabidopsis are required for resistance to the necrotrophic fungus Plectosphaerella cucumerina., Plant J., 43, 165, 10.1111/j.1365-313X.2005.02440.x · DOI
- Marone, 2001, Semi-quantitative RT-PCR analysis to assess the expression levels of multiple transcripts from the same sample., Biol. Proced. Online, 3, 19, 10.1251/bpo20 · DOI
- Mou, 2003, Inducers of plant systemic acquired resistance regulate NPR1 function through redox changes., Cell, 113, 935, 10.1016/S0092-8674(03)00429-X · DOI
- Nakashima, 2008, Multi-site genetic modification of monolignol biosynthesis in alfalfa (Medicago sativa): effects on lignin composition in specific cell types., New Phytol., 179, 738, 10.1111/j.1469-8137.2008.02502.x · DOI
- Patel, 2016a, Pseudomonas fluorescens and Trichoderma asperellum enhance expression of Gα subunits of the pea heterotrimeric G-protein during Erysiphe pisi infection., Front. Plant Sci., 6, 10.3389/fpls.2015.01206 · DOI
- Patel, 2016b, A Simple and efficient protocol for isolation of RNA from different tissues of chickpea and pea., Int. J. Agric. Environ. Biotechnol., 9, 39, 10.5958/2230-732X.2016.00006.1 · DOI
- Petersen, 2000, Arabidopsis MAP kinase 4 negatively regulates systemic acquired resistance., Cell, 103, 1111, 10.1016/S0092-8674(00)00213-0 · DOI
- Ranjeva, 1983, Activation of plant quinate:NAD 3- oxidoreductase by Ca and calmodulin., Proc. Natl. Acad. Sci. U.S.A., 80, 5222, 10.1073/pnas.80.17.5222 · DOI
- Sambrook, 2007, Molecular Cloning, a Laboratory Manual,
- Sarma, 2015, Microbial consortium-mediated plant defense against phytopathogens: readdressing for enhancing efficacy., Soil Biol. Biochem., 87, 25, 10.1016/j.soilbio.2015.04.001 · DOI
- Schmittgen, 2008, Analyzing real-time PCR data by the comparative CT method., Nat. Protoc., 3, 1101, 10.1038/nprot.2008.73 · DOI · Paper page
- Shadle, 2007, Down-regulation of hydroxycinnamoyl CoA: shikimate hydroxycinnamoyl transferase in transgenic alfalfa affects lignification, development and forage quality., Phytochemistry, 68, 1521, 10.1016/j.phytochem.2007.03.022 · DOI
- Singh, 2013, Rhizosphere microbes facilitate redox homeostasis in Cicer arietinum against biotic stress., Ann. Appl. Biol., 163, 33, 10.1111/aab.12030 · DOI
- Singh, 2002, Plant growth-promoting rhizobacteria-mediated induction of phenolics in pea (Pisum sativum) after infection with Erysiphe pisi., Curr. Microbiol., 44, 396, 10.1007/s00284-001-0007-7 · DOI
- Srivastava, 2014, Streptomyces rochei SM3 induced stress tolerance in chickpea against Sclerotinia sclerotiorum and NaCl., J. Phytopathol., 163, 583, 10.1111/jph.12358 · DOI
- Su, 2015, RACK1, scaffolding a heterotrimeric G protein and a MAPK cascade., Trends Plant Sci., 20, 405, 10.1016/j.tplants.2015.05.002 · DOI
- Suharsono, 2002, The heterotrimeric G-protein alpha subunit acts upstream of the small GTPase Rac in disease resistance of rice., Proc. Nat. Acad. Sci. U.S.A., 99, 7, 10.1073/pnas.192244099 · DOI
- Thornton, 2011, Real-time PCR (qPCR) primer design using free online software., Biochem. Mol. Biol. Educ., 39, 145, 10.1002/bmb.20461 · DOI
- Torres, 2005, Functions of the respiratory burst oxidase in biotic interactions, abiotic stress and development., Curr. Opin. Plant Biol., 8, 397, 10.1016/j.pbi.2005.05.014 · DOI
- Torres, 2006, Reactive oxygen species signalling in response to pathogens., Plant Physiol., 141, 373, 10.1104/pp.106.079467 · DOI
- Trusov, 2010, Signaling and communication in plants series, G proteins and plant innate immunity, Integrated G Proteins Signaling in Plants,, 221, 10.1007/978-3-642-03524-1_12 · DOI
- Yadav, 2013, Co-inoculated biopriming with Trichoderma, Pseudomonas and Rhizobium improves crop growth in Cicer arietinum and Phaseolus vulgaris., Int. J. Agric. Environ. Biotechnol., 6, 255
- Zhang, 2007, Erwinia carotovora ssp. carotovora infection induced “defense lignin” accumulation and lignin biosynthetic gene expression in Chinese cabbage (Brassica rapa L. ssp. pekinensis)., J. Integr. Plant Biol., 49, 993, 10.1111/j.1672-9072.2007.00478.x · DOI
Metadata
- Authors
- Patel, J. S., Kharwar, R. N., Singh, H. B., Upadhyay, R. S., & Sarma, B. K.
- Affiliations
- Banaras Hindu University (IN)
- Corresponding author
- Sarma, Birinchi K.
- Venue
- Frontiers in Microbiology
- Publisher
- Frontiers Media SA
- Published
- 2017-03-02
- Volume
- 08
- Pages
- 306-306
- ISSN
- 1664-302X (ISSN-L)
- PMC
- PMC5332396
- OpenAlex
- W2593940733
- Cited by
- 53
- References
- 1
- Citations by year
- 2026: 2 · 2025: 6 · 2024: 3 · 2023: 6 · 2022: 11 · 2021: 7 · 2020: 6 · 2019: 7 · 2018: 3 · 2017: 2
- FWCI
- 4.85
- Type
- journal article
- Language
- en
- Open access
- gold
- doi.org
- Licence
- cc-by
- Locations
- Frontiers in Microbiology (publishedVersion, cc-by)
- PubMed Central (publishedVersion, cc-by)
- PubMed (publishedVersion)
- Topics
- Life Sciences › Agricultural and Biological Sciences › Plant Science › Plant-Microbe Interactions and Immunity
- Life Sciences › Agricultural and Biological Sciences › Plant Science › Powdery Mildew Fungal Diseases
- Life Sciences › Agricultural and Biological Sciences › Plant Science › Plant Disease Resistance and Genetics
- Keywords
- Trichoderma asperellum, Pseudomonas fluorescens, pea, Erysiphe pisi, powdery mildew, plant disease resistance, lignification, lignin biosynthesis, reactive oxygen species, NADPH oxidase, hydrogen peroxide, laccase, peroxidase, ABC transporters, MAPK signaling, gene expression
About these checks
Registry, retraction, Cites and statistics results are computed, not judged, with one exception: a printed reference that no index lists is read once by a model before it counts as a citation error. Claims are extracted by a model and kept only when their quote appears verbatim in the text; each cited source is then checked, with a model’s help, for whether it says what the claim relies on. Those verdicts can be wrong — read the claim’s quote and the cited source before relying on one.
Statistics and arithmetic are recomputed, not judged.
Confidence bands are shown only for fields calibrated on our annotated test set. None is calibrated yet, so no band is shown.
What counts as a claim ›How we measure confidence ›How we check this ›
Are you an author, or do you see a problem with this page? Request a review
