Cited by 156Alzheimer's disease research and treatmentsAdvanced Proteomics Techniques and ApplicationsDementia and Cognitive Impairment Research

The DOI matches its Crossref record; 34 of the 34 references it cites were found in a registry or an index.

Tau Phosphorylation Rates Measured by Mass Spectrometry Differ in the Intracellular Brain vs. Extracellular Cerebrospinal Fluid Compartments and Are Differentially Affected by Alzheimer’s Disease

Open access

Abstract

Tau protein aggregation into neurofibrillary tangles in the central nervous system contributes to the etiology of certain neurodegenerative disorders, including Alzheimer's disease (AD). Though the mechanism of tau destabilization is not fully understood yet, tau protein has been found to be hyperphosphorylated in tau aggregates. To investigate this further, we developed a highly sensitive and specific mass spectrometry (MS) method using parallel reaction monitoring (PRM) to identify tau phosphorylation sites. This method enables us to compare the abundance of phosphorylation sites in tau proteins in the brain and cerebrospinal fluid (CSF) in humans with and without AD. We detected 29 distinct phosphorylated tau (p-tau) sites in full-length tau from soluble human brain lysate and 12 sites on truncated tau in CSF, mainly in the mid-domain. Brain soluble tau phosphorylation sites are localized on three domains including a proline-rich mid-domain, the C-terminus, and a cluster on the N-terminal projection domain not previously characterized. Some phosphorylation sites increased in CSF, while others decreased compared to brain. Notably, phosphorylation on T205 and S208, recognized by AT8 antibody defining Braak stages of brain tau aggregation, were not detected in normal brain soluble tau but were found in the CSF. Comparison of the p-tau rates from the brain and the CSF indicated that the abundance of phosphorylated sites varied in a site-specific manner. CSF tau proteins from non-AD participants were significantly hyperphosphorylated on T111, T205, S208, T217 and T231. In AD CSF, hyperphosphorylation on these sites was exacerbated, and phosphorylation on T153 and T175 specifically were detected. This supports the hypothesis that tau hyperphosphorylation could be a physiological process amplified by AD pathology. Conversely, we found that S202 was hypophosphorylated in CSF and was not hyperphosphorylated in AD, demonstrating that p-tau isoforms could have different metabolisms depending on which sites are phosphorylated. These site-specific p-tau rates are independent of tau concentration and distinct of current CSF tau and p-tau assays measuring tau isoforms levels. Targeted MS multiplexing ability and high-throughput capacity lets us envision the use of these new p-tau measurements as promising biomarkers for AD diagnosis and tracking therapeutic responses.

Overview

The claims and statistics of this paper haven’t been checked yet.

Run the check — free, no account needed. It reads the open-access text and checks the sources it cites.

A few free checks a day · papers already verified open instantly · results are public

Integrity signals

Registry

Crossref · 10.3389/fnagi.2019.00121

Cites

34 of 34 references verified0 citation errors · 0 not checkable

Statistics

Figures

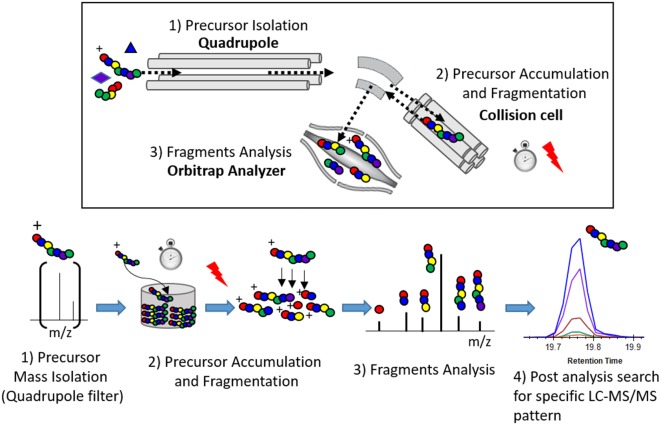
Figure 1 Principle of the parallel reaction monitoring (PRM) experiment.
Figure 1 Principle of the parallel reaction monitoring (PRM) experiment.CC BY · PubMed Central
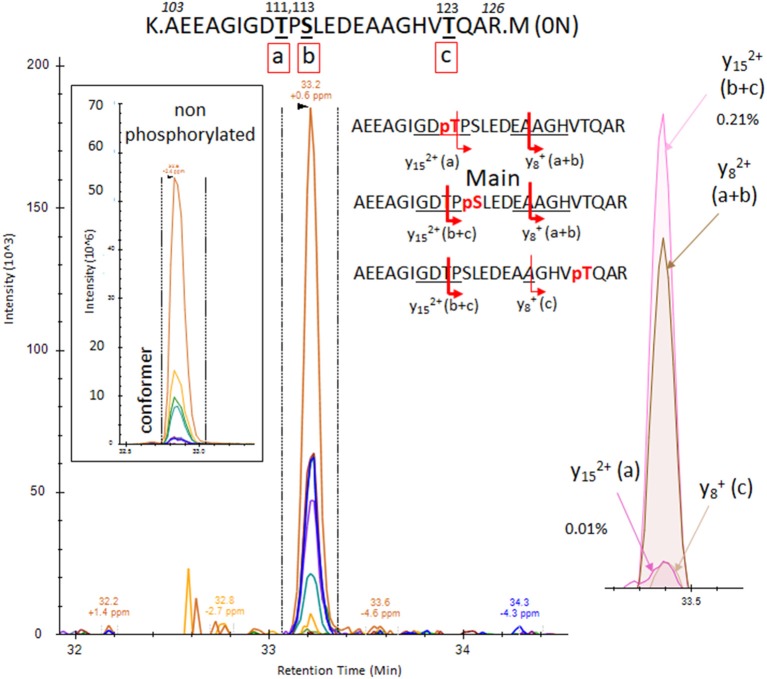
Figure 2 PRM screening of the mono-phosphorylated tau (p-tau) sequence at 103–126 (0N isoform). We identified a unique LC-mass spectrometry (MS)/MS pattern eluting closely to the unmodified peptide 103–126 and containing fragment series expected for phosphorylation at T111 (a), S113 (b) or T123 (c). Hypothetical y ion fragments from each p-tau peptide are underlined on the sequences. We deconvoluted the potential co-elution of the three putative mono-phosphorylated peptides. Ion fragment y15 without phosphate is specific to the phosphorylated peptide on residue T111 [y15 (a)] and the y8 fragment with phosphate is specific to p-tau peptide on residue T123 [y8 (c)]. Corresponding extracted ion chromatograms (XIC) are detected in low abundance above the limit of detection, supporting the identification of the two corresponding mono-p-tau peptides. In contrast, the y15 fragment with phosphate, shared by pT111 and pS113 [y15 (a+b)], and the y8 fragment without phosphate, shared by pS113 and pT123 [y8 (b+c)], are much more abundant. These signal differences support the existence of the tau peptide mono-phosphorylated at residue S113 (b) as the main component of the pattern.
Figure 2 PRM screening of the mono-phosphorylated tau (p-tau) sequence at 103–126 (0N isoform). We identified a unique LC-mass spectrometry (MS)/MS pattern eluting closely to the unmodified peptide 103–126 and containing fragment series expected for phosphorylation at T111 (a), S113 (b) or T123 (c). Hypothetical y ion fragments from each p-tau peptide are underlined on the sequences. We deconvoluted the potential co-elution of the three putative mono-phosphorylated peptides. Ion fragment y15 without phosphate is specific to the phosphorylated peptide on residue T111 [y15 (a)] and the y8 fragment with phosphate is specific to p-tau peptide on residue T123 [y8 (c)]. Corresponding extracted ion chromatograms (XIC) are detected in low abundance above the limit of detection, supporting the identification of the two corresponding mono-p-tau peptides. In contrast, the y15 fragment with phosphate, shared by pT111 and pS113 [y15 (a+b)], and the y8 fragment without phosphate, shared by pS113 and pT123 [y8 (b+c)], are much more abundant. These signal differences support the existence of the tau peptide mono-phosphorylated at residue S113 (b) as the main component of the pattern.CC BY · PubMed Central
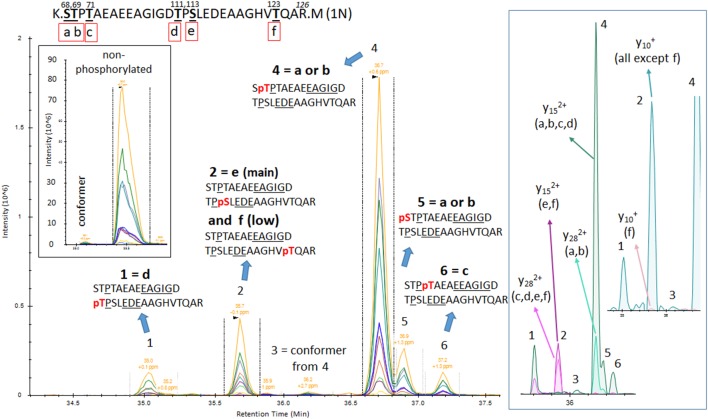
Figure 3 PRM screening of mono-p-tau sequence 68–126 (1N isoform) containing six potential phosphorylation sites. Three phosphorylation sites are shared by peptides containing residues 103–126 as described in Figure 2 (d–f). Six LC-MS patterns were identified. The Y28 fragment carrying phosphate, shared by pS68 (a) or pT69 (b), is found in the two LC-MS patterns 4 and 5. This demonstrates the existence of the two phosphorylated peptides but corresponding LC-MS patterns cannot be strictly assigned without the detection of ion fragment y29 to differentiate pS68 and pT69. Specific fragments corresponding to pT71 (c) and pT111 (d) are found in LC-MS patterns 6 and 1, respectively. Specific fragments for pS113 (e) and pT123 (f; y15 with phosphate) are found in the LC-MS pattern 2. This pattern contained both y10 fragments with and without phosphate, suggesting the co-elution of these two phosphorylated peptides. Since y10 without phosphate has the major signal in comparison to y10 with phosphate, the degree of pT123 is likely lower than pS113. LC-MS pattern three is attributed to a minor conformer or LC artifact from the phosphorylated peptide from pattern four as found for the non-phosphorylated peptide.
Figure 3 PRM screening of mono-p-tau sequence 68–126 (1N isoform) containing six potential phosphorylation sites. Three phosphorylation sites are shared by peptides containing residues 103–126 as described in Figure 2 (d–f). Six LC-MS patterns were identified. The Y28 fragment carrying phosphate, shared by pS68 (a) or pT69 (b), is found in the two LC-MS patterns 4 and 5. This demonstrates the existence of the two phosphorylated peptides but corresponding LC-MS patterns cannot be strictly assigned without the detection of ion fragment y29 to differentiate pS68 and pT69. Specific fragments corresponding to pT71 (c) and pT111 (d) are found in LC-MS patterns 6 and 1, respectively. Specific fragments for pS113 (e) and pT123 (f; y15 with phosphate) are found in the LC-MS pattern 2. This pattern contained both y10 fragments with and without phosphate, suggesting the co-elution of these two phosphorylated peptides. Since y10 without phosphate has the major signal in comparison to y10 with phosphate, the degree of pT123 is likely lower than pS113. LC-MS pattern three is attributed to a minor conformer or LC artifact from the phosphorylated peptide from pattern four as found for the non-phosphorylated peptide.CC BY · PubMed Central
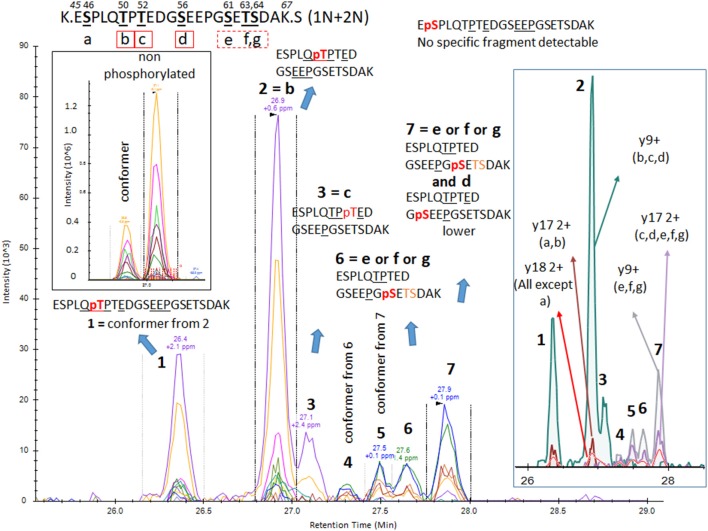
Figure 4 PRM screening of mono-p-tau sequence 45–67 (1N and 2N isoforms). A strong signal from a conformer was identified on the front of a non-phosphorylated peptide LC-MS pattern. Thus, we predicted that corresponding LC-MS patterns for phosphorylated peptides would also have conformers separable by LC. Indeed, PRM scan interpretation led to the detection of pT50 (b) as the main phosphorylation site on this sequence (pattern 2). Pattern 1, with a similar fragmentation fingerprint, was attributed to a conformer of pT50. pS46 (a), able to differentiate signals from pT50 (b), was not detected, suggesting this phosphorylation would be absent or low and co-eluted with other phosphorylated peptides sharing similar non-specific fragments. Co-elution of y9, y15 without phosphate, and y17 with phosphate in LC-MS pattern 3 identified a phosphorylation on residue T52 (c). Patterns 4/6 and 5/7 were respectively paired as conformers. Thus, two phosphorylated peptides could not be separated. Fragments found in these patterns were consistent with phosphorylation on one of the S61 (e), T63 (f), and S64 (g) residues. MS/MS intensities were insufficient to identify the sites but at least two of these three sites were likely phosphorylated on this sequence. Additionally, a minor y9 fragment without phosphate was found in the shoulder of pattern 7, which could be attributed to minor phosphorylation on residue S56 (d).
Figure 4 PRM screening of mono-p-tau sequence 45–67 (1N and 2N isoforms). A strong signal from a conformer was identified on the front of a non-phosphorylated peptide LC-MS pattern. Thus, we predicted that corresponding LC-MS patterns for phosphorylated peptides would also have conformers separable by LC. Indeed, PRM scan interpretation led to the detection of pT50 (b) as the main phosphorylation site on this sequence (pattern 2). Pattern 1, with a similar fragmentation fingerprint, was attributed to a conformer of pT50. pS46 (a), able to differentiate signals from pT50 (b), was not detected, suggesting this phosphorylation would be absent or low and co-eluted with other phosphorylated peptides sharing similar non-specific fragments. Co-elution of y9, y15 without phosphate, and y17 with phosphate in LC-MS pattern 3 identified a phosphorylation on residue T52 (c). Patterns 4/6 and 5/7 were respectively paired as conformers. Thus, two phosphorylated peptides could not be separated. Fragments found in these patterns were consistent with phosphorylation on one of the S61 (e), T63 (f), and S64 (g) residues. MS/MS intensities were insufficient to identify the sites but at least two of these three sites were likely phosphorylated on this sequence. Additionally, a minor y9 fragment without phosphate was found in the shoulder of pattern 7, which could be attributed to minor phosphorylation on residue S56 (d).CC BY · PubMed Central
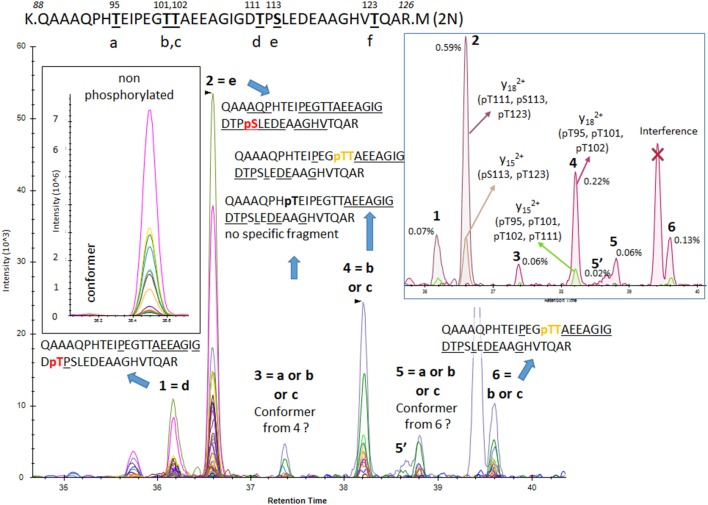
Figure 5 PRM screening of mono-p-tau sequence 88–126 (2N isoform). Six potential phosphorylation sites are located in this sequence and six LC-MS patterns were identified. Fragments found in pattern 1 and 2 were consistent with phosphorylated peptides at residues T111 (d) and S113 (e), respectively. No specific fragment from the phosphorylated peptide at residue T123 (f) was found. Patterns 4 and 6 contained a low signal of the y29 fragment matching with phosphorylation on residue T101 (b) or T102 (c), but no specific fragment able to differentiate them was detected. Patterns 3 and 5 shared fragments found in patterns 4 and 6 but in lower abundance, locating the phosphorylated residue at the N-terminus on residue G109. This could indicate the presence of an additional phosphorylated peptide, likely at residue T95 (a) or abundant conformers from peptides found in patterns 4 and 6.
Figure 5 PRM screening of mono-p-tau sequence 88–126 (2N isoform). Six potential phosphorylation sites are located in this sequence and six LC-MS patterns were identified. Fragments found in pattern 1 and 2 were consistent with phosphorylated peptides at residues T111 (d) and S113 (e), respectively. No specific fragment from the phosphorylated peptide at residue T123 (f) was found. Patterns 4 and 6 contained a low signal of the y29 fragment matching with phosphorylation on residue T101 (b) or T102 (c), but no specific fragment able to differentiate them was detected. Patterns 3 and 5 shared fragments found in patterns 4 and 6 but in lower abundance, locating the phosphorylated residue at the N-terminus on residue G109. This could indicate the presence of an additional phosphorylated peptide, likely at residue T95 (a) or abundant conformers from peptides found in patterns 4 and 6.CC BY · PubMed Central
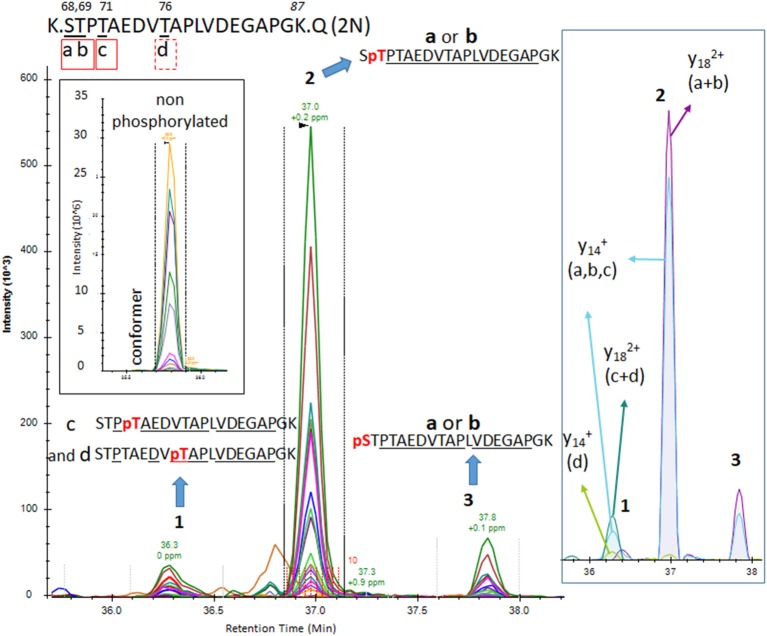
Figure 6 The PRM scan of mono-p-tau sequence 68–87, containing four potential phosphorylation sites. We detected three LC-MS patterns. Patterns 2 and 3 were consistent with phosphorylation at residues S68 (a) or T69 (b). Pattern 1 contained both fragments compatible with the presence of two co-eluted phosphorylated peptides at T71 (c) and T76 (d). Comparison of y14 XIC with and without phosphate in pattern 1 indicates pT71 (c) is more abundant than pT76 (d).
Figure 6 The PRM scan of mono-p-tau sequence 68–87, containing four potential phosphorylation sites. We detected three LC-MS patterns. Patterns 2 and 3 were consistent with phosphorylation at residues S68 (a) or T69 (b). Pattern 1 contained both fragments compatible with the presence of two co-eluted phosphorylated peptides at T71 (c) and T76 (d). Comparison of y14 XIC with and without phosphate in pattern 1 indicates pT71 (c) is more abundant than pT76 (d).CC BY · PubMed Central
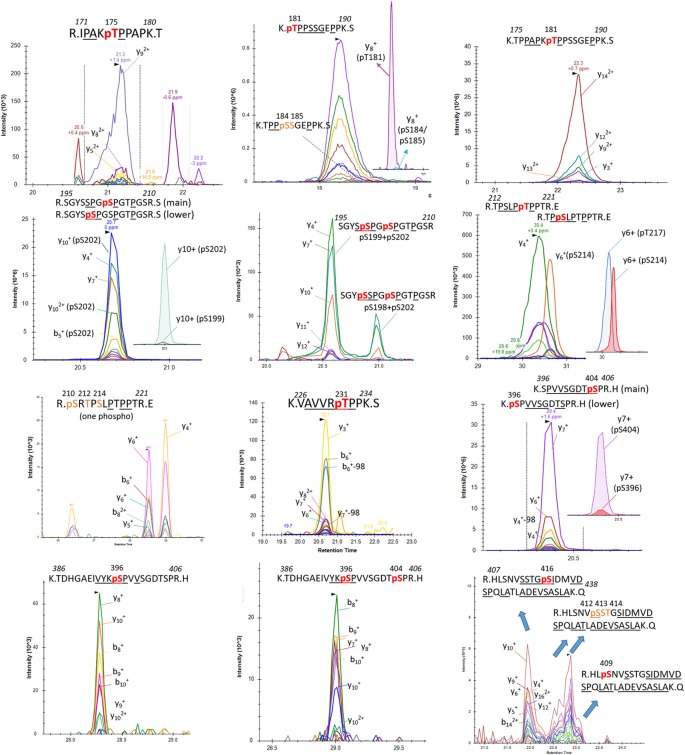
Figure 7 Detection of phosphorylation sites in the mid-domain and C-terminus of brain p-tau protein.
Figure 7 Detection of phosphorylation sites in the mid-domain and C-terminus of brain p-tau protein.CC BY · PubMed Central
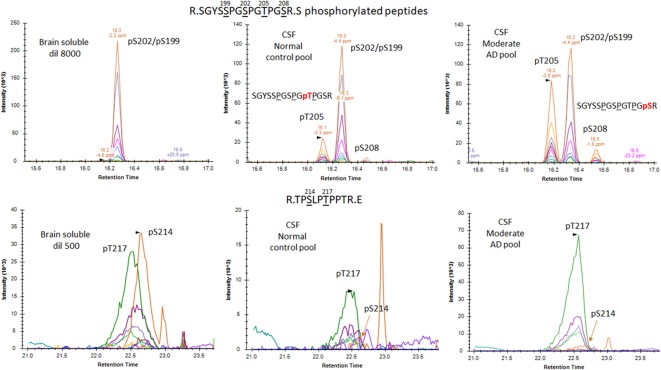
Figure 8 Phosphorylated peptide profiles from tau sequences 195–209 and 212–221 are variable between the soluble brain fraction, normal cerebrospinal fluid (CSF), and Alzheimer’s disease (AD) CSF tau protein. Brain soluble tau extracts are diluted as indicated to approximately match corresponding CSF tau level. Phosphorylated peptides on 195–209: in brain lysate, one signal corresponding to the co-elution of two phosphorylated peptides pS199 and pS202 is observed. In CSF, two additional signals are observed. Fragment analysis allowed the assignment of the signal on left to pT205. In AD CSF, the two signals are increased allowing the identification of specific fragments assigning the signal on the right to pS208. Phosphorylated peptides on 212–221: two signals with similar MS intensities corresponding to pT217 and pS214 are identified in brain lysate. In CSF, the signal corresponding to pT217 is the most intense while pS214 is close to the limit of detection, indicating a dramatic change in their relative abundance in comparison to the brain extract. In AD CSF, pT217 is significantly increased due to specific hyperphosphorylation.
Figure 8 Phosphorylated peptide profiles from tau sequences 195–209 and 212–221 are variable between the soluble brain fraction, normal cerebrospinal fluid (CSF), and Alzheimer’s disease (AD) CSF tau protein. Brain soluble tau extracts are diluted as indicated to approximately match corresponding CSF tau level. Phosphorylated peptides on 195–209: in brain lysate, one signal corresponding to the co-elution of two phosphorylated peptides pS199 and pS202 is observed. In CSF, two additional signals are observed. Fragment analysis allowed the assignment of the signal on left to pT205. In AD CSF, the two signals are increased allowing the identification of specific fragments assigning the signal on the right to pS208. Phosphorylated peptides on 212–221: two signals with similar MS intensities corresponding to pT217 and pS214 are identified in brain lysate. In CSF, the signal corresponding to pT217 is the most intense while pS214 is close to the limit of detection, indicating a dramatic change in their relative abundance in comparison to the brain extract. In AD CSF, pT217 is significantly increased due to specific hyperphosphorylation.CC BY · PubMed Central
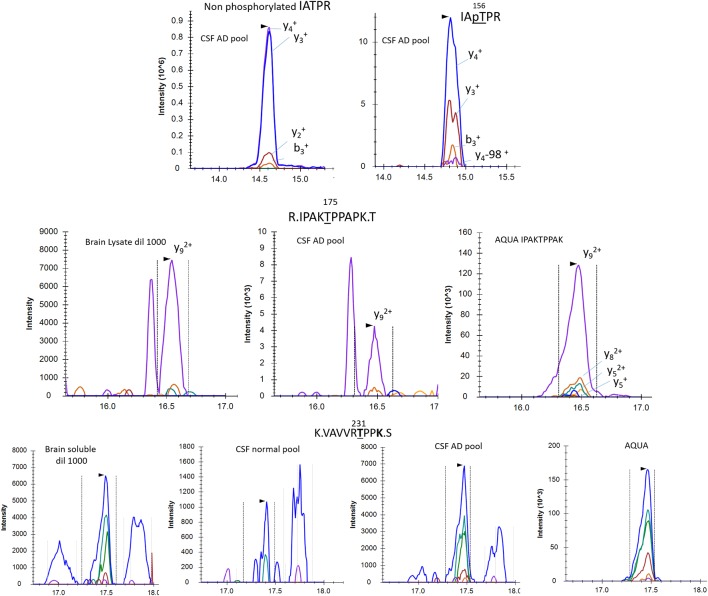
Figure 9 pT153, pT175 and pT231 phosphorylated peptides identified in CSF. AQUA internal standard signals are shown for pT175 and pT231. Fragmentation pattern of pT153 is similar to unmodified.
Figure 9 pT153, pT175 and pT231 phosphorylated peptides identified in CSF. AQUA internal standard signals are shown for pT175 and pT231. Fragmentation pattern of pT153 is similar to unmodified.CC BY · PubMed Central
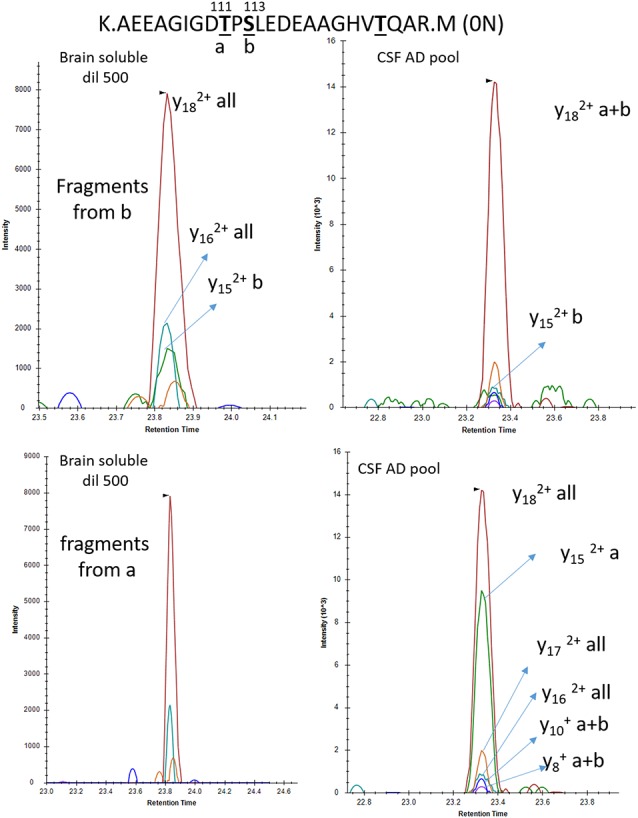
Figure 10 Phosphorylation abundance on T111 is higher in the CSF than the brain relative to S113 phosphorylation. In both brain and CSF, the MS/MS fragment y18 common to all mono-phosphorylated peptides on tau sequence 103–126 is detected. The relative abundance of the y15 fragment from pS113 (b) is significantly lower in CSF in comparison to brain extract. Inversely the y15 fragment from pT111 (a) is abundant in CSF and not detectable in brain soluble extract diluted to match the AD CSF tau level.
Figure 10 Phosphorylation abundance on T111 is higher in the CSF than the brain relative to S113 phosphorylation. In both brain and CSF, the MS/MS fragment y18 common to all mono-phosphorylated peptides on tau sequence 103–126 is detected. The relative abundance of the y15 fragment from pS113 (b) is significantly lower in CSF in comparison to brain extract. Inversely the y15 fragment from pT111 (a) is abundant in CSF and not detectable in brain soluble extract diluted to match the AD CSF tau level.CC BY · PubMed Central
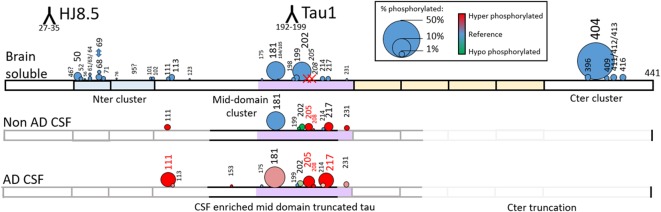
Figure 11 Relative abundance of tau phosphorylation depends on the biological extract and varies across the protein sequence. Comparison of tau phosphorylation abundance measured by MS in normal brain lysate, normal CSF and AD CSF extracted by immunocapture using HJ8.5 and Tau1. Circle area is proportional to site phosphorylation abundance. Red and green colors indicate an increase or decrease, respectively, in comparison to the brain soluble profile taken as reference (blue). Tau is c-terminally truncated in CSF, which explains the absence of detection of the C-terminal cluster of phosphorylation sites. Phosphorylation on T205 and S208 is specific to CSF (red X on Brain Soluble—top).
Figure 11 Relative abundance of tau phosphorylation depends on the biological extract and varies across the protein sequence. Comparison of tau phosphorylation abundance measured by MS in normal brain lysate, normal CSF and AD CSF extracted by immunocapture using HJ8.5 and Tau1. Circle area is proportional to site phosphorylation abundance. Red and green colors indicate an increase or decrease, respectively, in comparison to the brain soluble profile taken as reference (blue). Tau is c-terminally truncated in CSF, which explains the absence of detection of the C-terminal cluster of phosphorylation sites. Phosphorylation on T205 and S208 is specific to CSF (red X on Brain Soluble—top).CC BY · PubMed Central
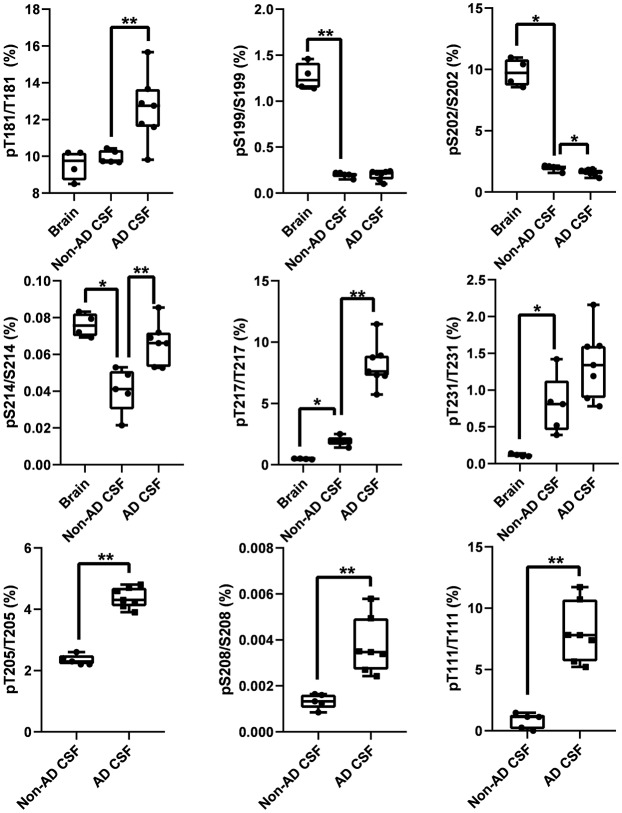
Figure 12 Tau phosphorylation sites are differentially modified in brain, normal CSF and AD CSF. Measurements are the relative abundances of the phosphorylated signal compared to the corresponding nonphosphorylated site (HJ8.5+Tau1 IP-MS). Brain results are obtained from diluted lysates from 500× to 8,000× factors to match the CSF tau level. Phosphorylations on T205 and S208 are undetectable in brain tissue. Phosphorylation on T111 is undetectable in 500x diluted lysate but was detected in 10× diluted lysate with a corresponding abundance of 0.02%. Legend: **indicates significance at p = 0.01 level and *indicates significance at p = 0.05 level.
Figure 12 Tau phosphorylation sites are differentially modified in brain, normal CSF and AD CSF. Measurements are the relative abundances of the phosphorylated signal compared to the corresponding nonphosphorylated site (HJ8.5+Tau1 IP-MS). Brain results are obtained from diluted lysates from 500× to 8,000× factors to match the CSF tau level. Phosphorylations on T205 and S208 are undetectable in brain tissue. Phosphorylation on T111 is undetectable in 500x diluted lysate but was detected in 10× diluted lysate with a corresponding abundance of 0.02%. Legend: **indicates significance at p = 0.01 level and *indicates significance at p = 0.05 level.CC BY · PubMed Central
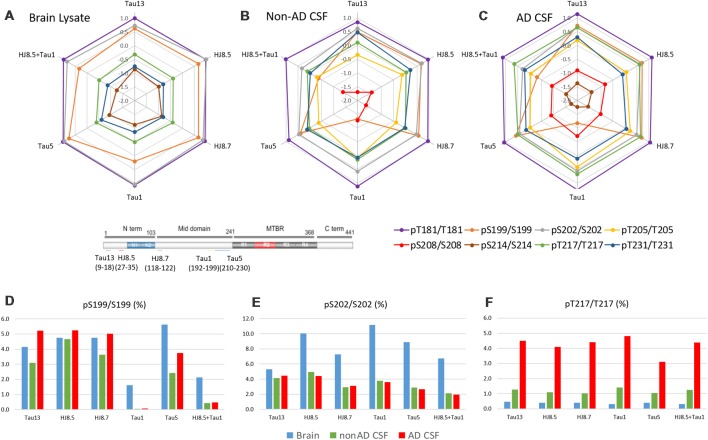
Figure 13 Antibody effect on phosphorylation ratio measurement by IP-MS. Brain lysate pool, non-AD (n = 1) and AD CSF (n = 1) pools were immunoprecipitated in parallel with antibodies against tau N-terminus projection domain (Tau13 or HJ8.5) or mid-domain (HJ8.7, Tau1 or Tau5). Radar plots of phosphorylation ratios measured on main CSF sites (log10 scale) are shown in brain lysate (A), non-AD CSF (B) and AD CSF (C). (A–C) Tau phosphorylation ratio measurements on pT181/T181, pT231/T231 are consistent across antibodies tested. PS199/S199 is decreased by using Tau1 or Tau1+HJ8.5 in comparison to other antibodies. (D) Low recovery of pS199 by Tau1 or Tau1+HJ8.5 IP underestimate pS199/S199 ratio measurements compared to other antibodies tested. Tau13, HJ8.5, and HJ8.7 antibodies indicate no significant changes of pS199 phosphorylation ratio between brain and CSF. Compared to brain, pS202/S202 CSF hypophosphorylation (E) and pT217/pT217 hyperphosphorylation (F) are evidenced independently of the antibody used for IP-MS.
Figure 13 Antibody effect on phosphorylation ratio measurement by IP-MS. Brain lysate pool, non-AD (n = 1) and AD CSF (n = 1) pools were immunoprecipitated in parallel with antibodies against tau N-terminus projection domain (Tau13 or HJ8.5) or mid-domain (HJ8.7, Tau1 or Tau5). Radar plots of phosphorylation ratios measured on main CSF sites (log10 scale) are shown in brain lysate (A), non-AD CSF (B) and AD CSF (C). (A–C) Tau phosphorylation ratio measurements on pT181/T181, pT231/T231 are consistent across antibodies tested. PS199/S199 is decreased by using Tau1 or Tau1+HJ8.5 in comparison to other antibodies. (D) Low recovery of pS199 by Tau1 or Tau1+HJ8.5 IP underestimate pS199/S199 ratio measurements compared to other antibodies tested. Tau13, HJ8.5, and HJ8.7 antibodies indicate no significant changes of pS199 phosphorylation ratio between brain and CSF. Compared to brain, pS202/S202 CSF hypophosphorylation (E) and pT217/pT217 hyperphosphorylation (F) are evidenced independently of the antibody used for IP-MS.CC BY · PubMed Central
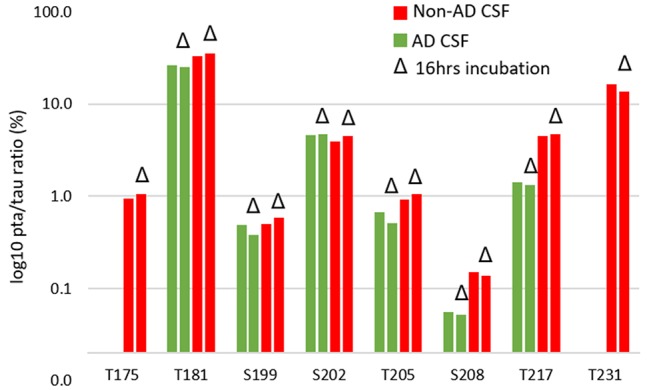
Figure 14 CSF incubation does not impact phosphorylation rate measurement on tau.
Figure 14 CSF incubation does not impact phosphorylation rate measurement on tau.CC BY · PubMed Central

Verification

Claims the paper makes

The claims and statistics of this paper haven’t been checked yet.

Run the check — free, no account needed. It reads the open-access text and checks the sources it cites.

A few free checks a day · papers already verified open instantly · results are public

Claims other papers make about this one

Each is checked against this paper’s own text: does it say what the citing paper says it does?

Self-check

Percentages, sums and reported differences re-computed from the paper’s own numbers.

The self-check needs the paper’s full text.

Citations

Cites

Show all 34 references

Cited by

Sorted by citations

See all 156

Metadata

Authors
Barthélemy, N. R., Mallipeddi, N., Moiseyev, P., Sato, C., & Bateman, R. J.
Affiliations
Washington University in St. Louis (US)
Corresponding author
  • Barthélemy, Nicolas R.
  • Bateman, Randall J.
Venue
Frontiers in Aging Neuroscience
Published
2019-05-21
Volume
11
Pages
121-121
ISSN
1663-4365 (ISSN-L)
OpenAlex
W2945823364
Cited by
152
References
34
Citations by year
2026: 10 · 2025: 15 · 2024: 24 · 2023: 19 · 2022: 22 · 2021: 32 · 2020: 25 · 2019: 5
FWCI
14.41
Type
journal article
Language
en
Open access
Locations
  • Frontiers in Aging Neuroscience (publishedVersion, cc-by)
  • PubMed Central (publishedVersion, cc-by)
  • PubMed (publishedVersion)
  • Digital Commons@Becker (Washington University School of Medicine) (submittedVersion, cc-by)
  • DOAJ (DOAJ: Directory of Open Access Journals) (submittedVersion)
Funders
Alzheimer’s Association (AARF-16-443265)
Topics
  • Life Sciences › Neuroscience › Cellular and Molecular Neuroscience › Alzheimer's disease research and treatments
  • Physical Sciences › Chemistry › Spectroscopy › Advanced Proteomics Techniques and Applications
  • Health Sciences › Medicine › Psychiatry and Mental health › Dementia and Cognitive Impairment Research
Keywords
tau phosphorylation, Alzheimer's disease, cerebrospinal fluid, brain, parallel reaction monitoring, tau phosphorylation sites, neurofibrillary tangles, tau isoforms, AT8 antibody, Braak stages, biomarkers, tau aggregation, site-specific phosphorylation, targeted mass spectrometry

About these checks

Registry, retraction, Cites and statistics results are computed, not judged, with one exception: a printed reference that no index lists is read once by a model before it counts as a citation error. Claims are extracted by a model and kept only when their quote appears verbatim in the text; each cited source is then checked, with a model’s help, for whether it says what the claim relies on. Those verdicts can be wrong — read the claim’s quote and the cited source before relying on one.

Statistics and arithmetic are recomputed, not judged.

Confidence bands are shown only for fields calibrated on our annotated test set. None is calibrated yet, so no band is shown.

What counts as a claim ›How we measure confidence ›How we check this ›

Are you an author, or do you see a problem with this page? Request a review