

The DOI matches its Crossref record; 59 of the 62 references it cites were found in a registry or an index.
Coenzyme Q10 Activates the Antioxidant Machinery and Inhibits the Inflammatory and Apoptotic Cascades Against Lead Acetate-Induced Renal Injury in Rats
Open accessAbstract
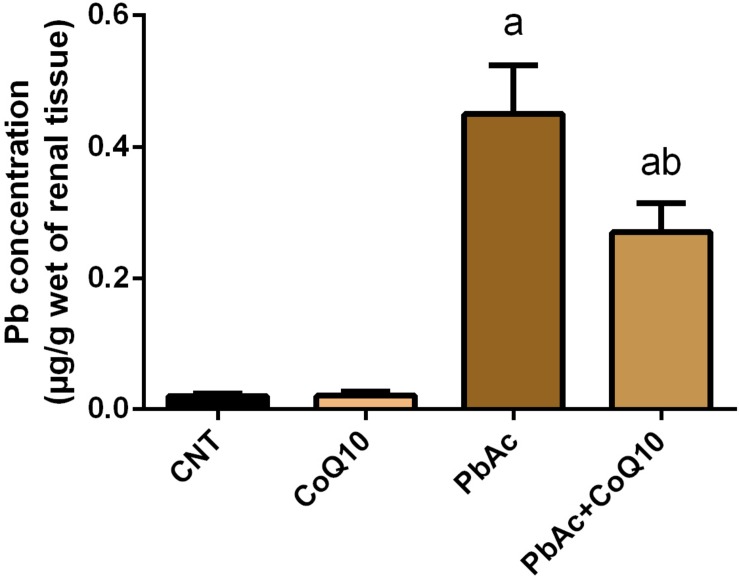
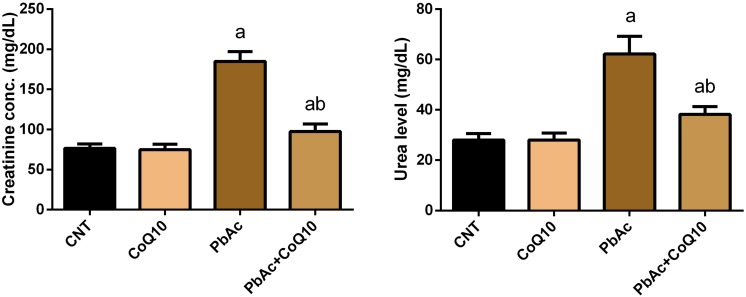
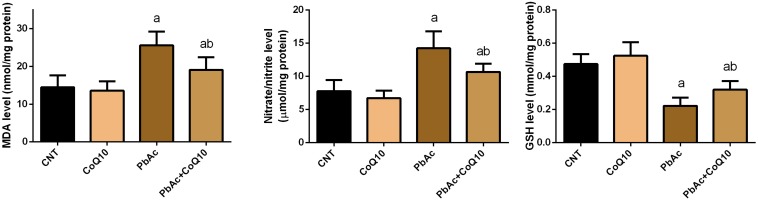
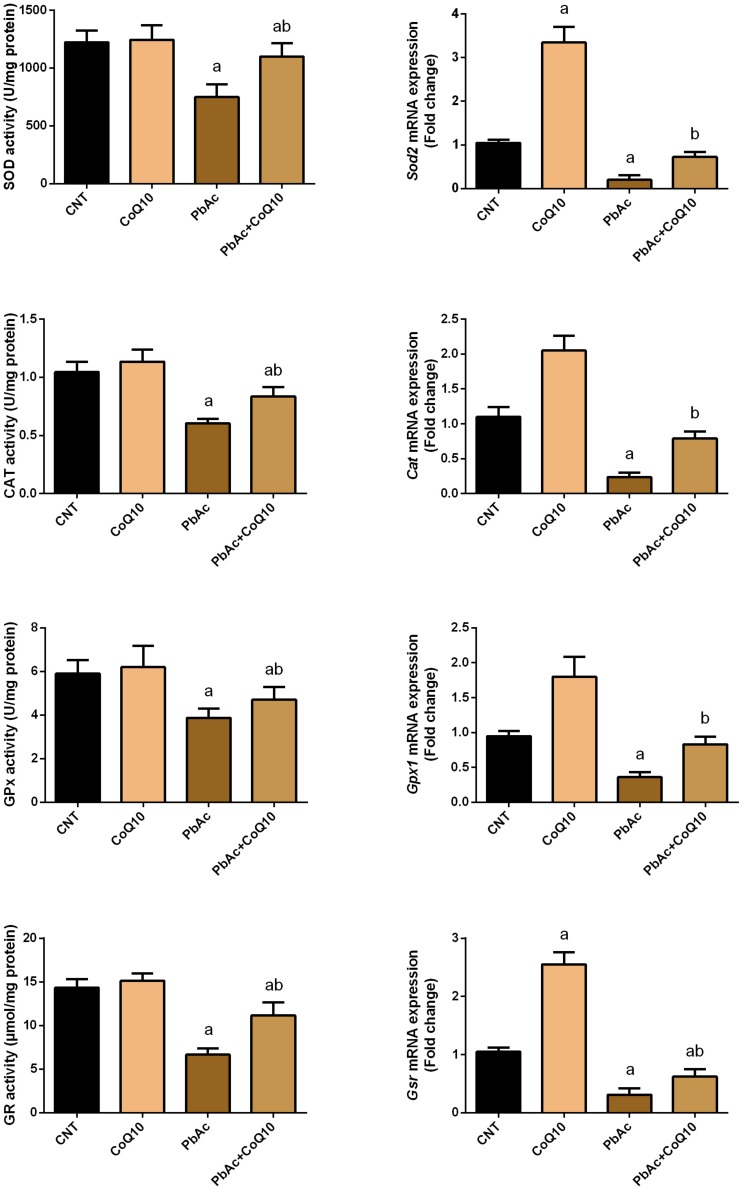
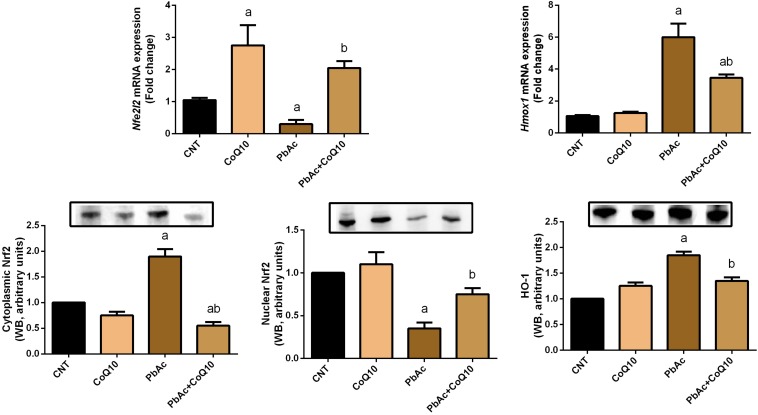
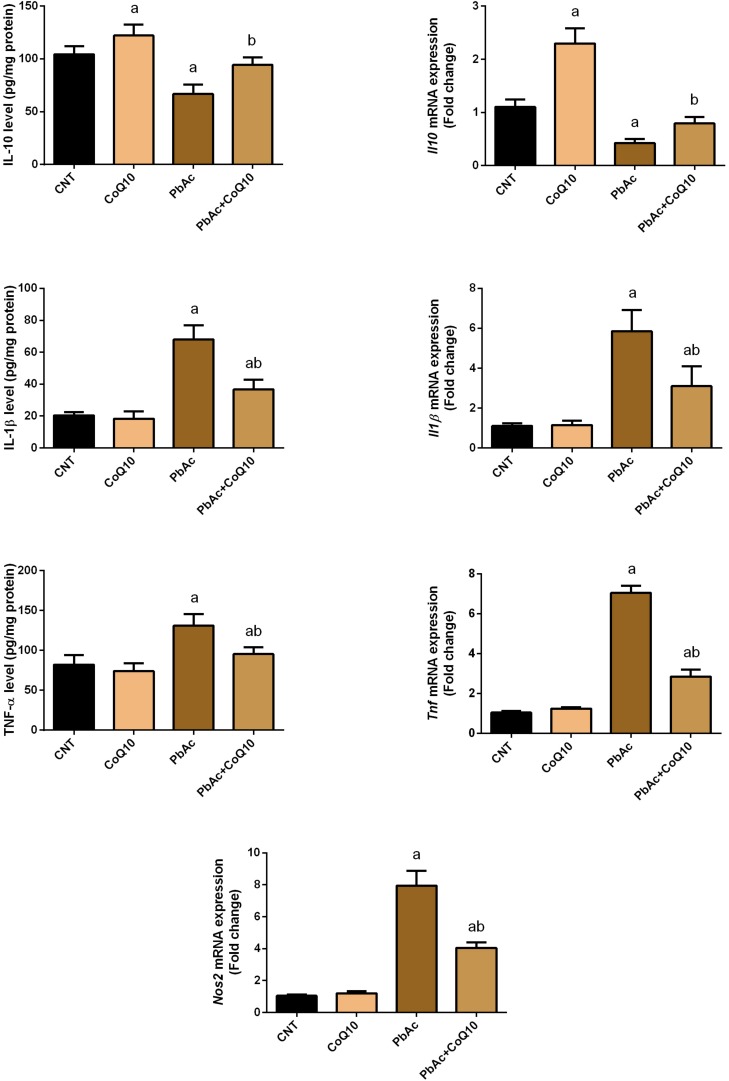
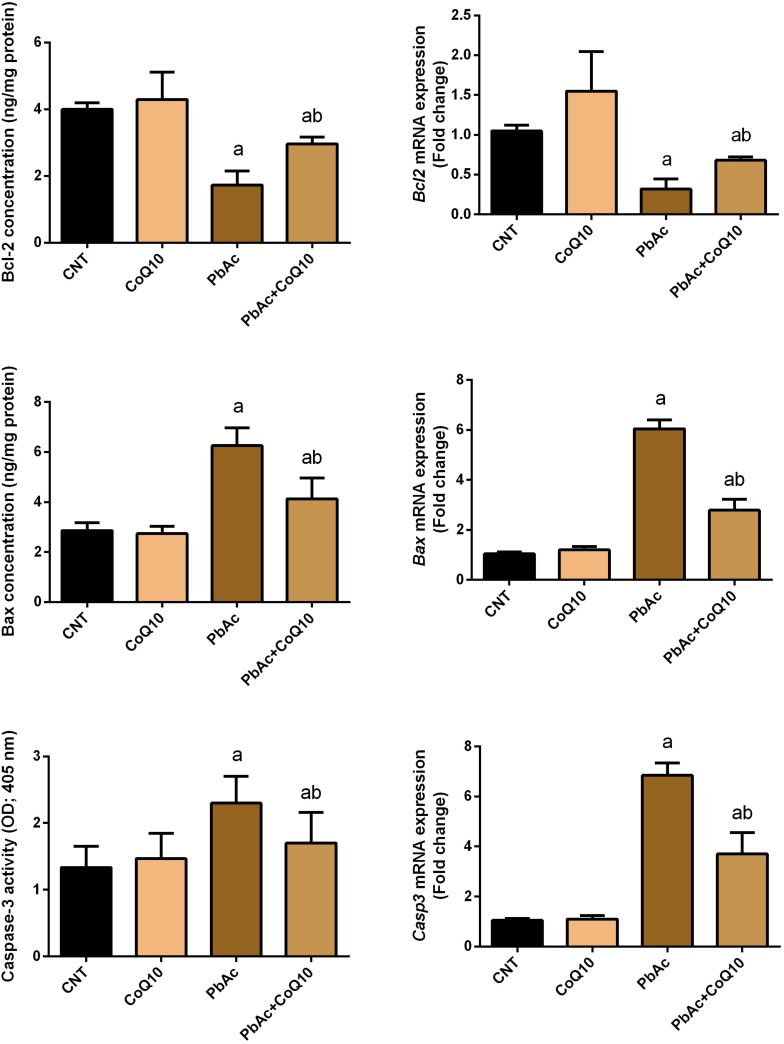
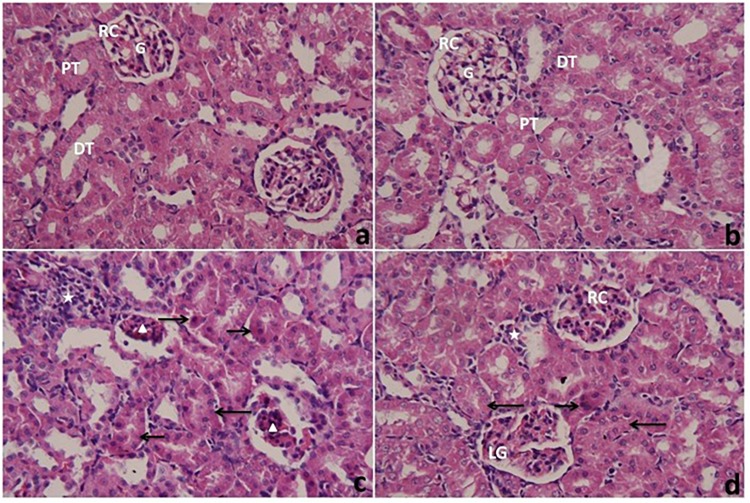
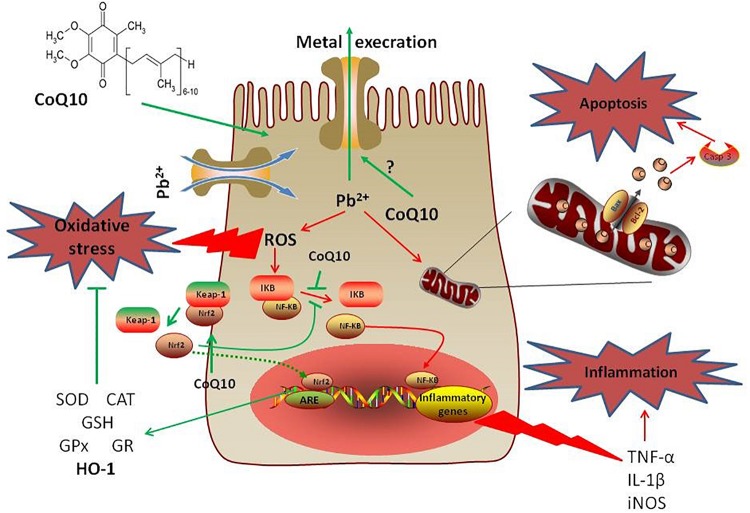
The kidney is among the metabolic organs most susceptible to injury, particularly following exposure to xenobiotics and heavy metals. We aimed to explore the potential protective impacts of coenzyme Q10 (CoQ10) on lead acetate (PbAc)-induced nephrotoxicity in rats. Four experimental groups (n=7) were applied as follows: control group, CoQ10 alone (10 mg/kg), PbAc alone (20 mg/kg), and PbAc with CoQ10. Exposure to PbAc led to the accumulation of Pb in the kidney and increased urea and creatinine serum levels. The deposition of Pb coupled with the elevation of malondialdehyde and nitrate/nitrite levels along with the upregulation of inducible nitric oxide synthase. Additionally, upon PbAc poisoning, glutathione content and the antioxidant enzymes were depleted along with the downregulation of Nrf2 and HO-1 expression. Moreover, PbAc injection increased the protein and mRNA levels of pro-inflammatory cytokines namely, tumor necrosis factor-alpha and interleukin-1 beta, while decreased the levels of interleukin-10, an anti-inflammatory cytokine, in the kidney. Furthermore, exposure to PbAc correlated with increased levels of pro-apoptotic markers, Bax and caspase-3, and reduced levels of the anti-apoptotic marker Bcl-2. The administration of CoQ10 alleviated the molecular, biochemical and histological changes following PbAc intoxication. Thus, CoQ10 reduces the deleterious cellular side effects of PbAc exposure due to its antioxidant, anti-inflammatory and anti-apoptotic effects.
Overview
The claims and statistics of this paper haven’t been checked yet.
Run the check — free, no account needed. It reads the open-access text and checks the sources it cites.
Integrity signals
Registry
Cites
Statistics
Figures
Verification
Claims the paper makes
The claims and statistics of this paper haven’t been checked yet.
Run the check — free, no account needed. It reads the open-access text and checks the sources it cites.
Claims other papers make about this one
Each is checked against this paper’s own text: does it say what the citing paper says it does?
The source backs part of the claim, not all of it — or backs it for a different population, condition or comparison.
In the citing paper
“Therapeutic benefits of CoQ10 were demonstrated in aging-related disorders, mainly those accompanied by increased oxidative stress (Diaz-Casado et al. 2019) and in the mitigation of heavy metal toxicities from lead and arsenic due to its antiinflammatory, antioxidant, and antiapoptotic properties (Al-Megrin et al. 2020; Silva et al. 2022).”
From Can coenzyme Q10 alleviate the toxic effect of fenofibrate on skeletal muscle? (2023) · cites this paper as Al-Megrin et al. 2020
Experimental — accuracy not yet measuredThe cited source says what the claim attributes to it.
In the citing paper
“Al-Megrin et al. (2020) stated that CoQ10 also prevents the migration of leukocytes, macrophages, and monocytes, which are mainly responsible for production of proinflammatory cytokines.”
From Can coenzyme Q10 alleviate the toxic effect of fenofibrate on skeletal muscle? (2023) · cites this paper as Al-Megrin et al. 2020
The cited source says what the claim attributes to it.
In the citing paper
“The improvement in this group could be due to the antioxidant properties of CoQ10.”
From Can coenzyme Q10 alleviate the toxic effect of fenofibrate on skeletal muscle? (2023) · cites this paper as Al-Megrin et al. 2020
The cited source says what the claim attributes to it.
In the citing paper
“Al-Megrin et al. (2020) found that CoQ10 works as a potent lipophilic antioxidant and free radical scavenger.”
From Can coenzyme Q10 alleviate the toxic effect of fenofibrate on skeletal muscle? (2023) · cites this paper as Al-Megrin et al. 2020
Self-check
Percentages, sums and reported differences re-computed from the paper’s own numbers.
The self-check needs the paper’s full text.
Citations
Cites
Assay for lipid peroxides in animal tissues by thiobarbituric acid reaction
Ohkawa, H., Ohishi, N., & Yagi, K. (1979) · Analytical Biochemistry · doi:10.1016/0003-2697(79)90738-3 · Cited by 29,746
Ellman, G. L. (1959) · Archives of Biochemistry and Biophysics · doi:10.1016/0003-9861(59)90090-6 · Cited by 26,824
Analysis of nitrate, nitrite, and [15N]nitrate in biological fluids
Green, L. C., Wagner, D. A., Glogowski, J. A., Skipper, P. L., Wishnok, J. S., & Tannenbaum, S. R. (1982) · Analytical Biochemistry · doi:10.1016/0003-2697(82)90118-x · Cited by 12,061
Studies on the quantitative and qualitative characterization of erythrocyte glutathione peroxidase.
Paglia, D. E., & Valentine, W. N. (1967) · PubMed · Cited by 10,776
Toxicity, mechanism and health effects of some heavy metals
Jaishankar, M., Tseten, T., Anbalagan, N., Mathew, B. B., & Beeregowda, K. N. (2014) · Interdisciplinary Toxicology · doi:10.2478/intox-2014-0009 · Cited by 6,402
A simple method for clinical assay of superoxide dismutase.
Sun, Y., Oberley, L. W., & Li, Y. (1988) · Clinical Chemistry · doi:10.1093/clinchem/34.3.497 · Cited by 4,537
Wani, A. L., Ara, A., & Usmani, J. A. (2015) · Interdisciplinary Toxicology · doi:10.1515/intox-2015-0009 · Cited by 1,964
Metabolism and function of coenzyme Q
Turunen, M., Olsson, J., & Dallner, G. (2004) · Biochimica et Biophysica Acta (BBA) - Biomembranes · doi:10.1016/j.bbamem.2003.11.012 · Cited by 1,026
Lead toxicity, a review of the literature. Part 1: Exposure, evaluation, and treatment.
Patrick, L. (2006) · PubMed · Cited by 583
Insight into the oxidative stress induced by lead and/or cadmium in blood, liver and kidneys
Matović, V., Djordjević, A. B., Đukić-Ćosić, D., & Bulat, Z. (2015) · Food and Chemical Toxicology · doi:10.1016/j.fct.2015.02.011 · Cited by 578
Research works printed but not linked: 2
- Drury, 1980, Carleton’s Histological Techniques
- Luck, 1965, Catalase, Methods of Enzymatic Analysis, 855
Cited by
Sorted by citations
Mucha, P., Skoczyńska, A., Małecka, M., Hikisz, P., & Budzisz, E. (2021) · Molecules · doi:10.3390/molecules26164886 · Cited by 305
Chen, X., Wei, W., Li, Y., Huang, J., & Ci, X. (2019) · Chemico-Biological Interactions · doi:10.1016/j.cbi.2019.05.040 · Cited by 253
Heavy Metal Exposure: Molecular Pathways, Clinical Implications, and Protective Strategies
Koyama, H., Kamogashira, T., & Yamasoba, T. (2024) · Antioxidants · doi:10.3390/antiox13010076 · Cited by 177
Albarakati, A. J. A., Baty, R. S., Aljoudi, A. M., Habotta, O. A., Elmahallawy, E. K., Kassab, R. B., & Moneim, A. E. A. (2020) · Molecular Biology Reports · doi:10.1007/s11033-020-05346-1 · Cited by 134
Self-citationQuinones as Neuroprotective Agents
Cores, Á., Carmona-Zafra, N., Clerigué, J., Villacampa, M., & Menéndez, J. C. (2023) · Antioxidants · doi:10.3390/antiox12071464 · Cited by 94
Metadata
- Authors
- AL-Megrin, W. A., Soliman, D., Kassab, R. B., Metwally, D. M., Moneim, A. E. A., & El-Khadragy, M. F.
- Affiliations
- Helwan University (EG)
- Zagazig University (EG)
- Venue
- Frontiers in Physiology
- Publisher
- Frontiers Media SA
- Published
- 2020-02-07
- Volume
- 11
- Pages
- 64-64
- ISSN
- 1664-042X (ISSN-L)
- PMC
- PMC7020615
- OpenAlex
- W3004711026
- Cited by
- 84
- References
- 62
- Citations by year
- 2026: 8 · 2025: 13 · 2024: 6 · 2023: 14 · 2022: 18 · 2021: 11 · 2020: 12
- FWCI
- 5.50
- Type
- journal article
- Language
- en
- Open access
- gold
- doi.org
- Licence
- Locations
- Frontiers in Physiology (publishedVersion, cc-by)
- PubMed Central (publishedVersion, cc-by)
- PubMed (publishedVersion)
- DOAJ (DOAJ: Directory of Open Access Journals) (submittedVersion, cc-by-sa)
- Funders
- Princess Nourah Bint Abdulrahman University
- Deanship of Scientific Research, Princess Nourah Bint Abdulrahman University
- Topics
- Physical Sciences › Environmental Science › Health, Toxicology and Mutagenesis › Heavy Metal Exposure and Toxicity
- Life Sciences › Biochemistry, Genetics and Molecular Biology › Molecular Biology › Coenzyme Q10 studies and effects
- Physical Sciences › Environmental Science › Health, Toxicology and Mutagenesis › Environmental Toxicology and Ecotoxicology
- Keywords
- coenzyme Q10, lead acetate, nephrotoxicity, lead poisoning, kidney injury, oxidative stress, antioxidant enzymes, Nrf2, heme oxygenase-1, inflammatory cytokines, apoptosis, Bax, Bcl-2, caspase-3, glutathione, malondialdehyde, nitric oxide synthase
About these checks
Registry, retraction, Cites and statistics results are computed, not judged, with one exception: a printed reference that no index lists is read once by a model before it counts as a citation error. Claims are extracted by a model and kept only when their quote appears verbatim in the text; each cited source is then checked, with a model’s help, for whether it says what the claim relies on. Those verdicts can be wrong — read the claim’s quote and the cited source before relying on one.
Statistics and arithmetic are recomputed, not judged.
Confidence bands are shown only for fields calibrated on our annotated test set. None is calibrated yet, so no band is shown.
What counts as a claim ›How we measure confidence ›How we check this ›
Are you an author, or do you see a problem with this page? Request a review
How to cite
Cite CoChat for the checks on this page, and the paper for its own findings.
- This page
- CoChat. (2026). Citation check: Coenzyme Q10 Activates the Antioxidant Machinery and Inhibits the Inflammatory and Apoptotic Cascades Against Lead Acetate-Induced Renal Injury in Rats. https://app.cochat.ai/papers/10.3389/fphys.2020.00064
- The paper
- AL-Megrin, W. A., Soliman, D., Kassab, R. B., Metwally, D. M., Moneim, A. E. A., & El-Khadragy, M. F. (2020). Coenzyme Q10 Activates the Antioxidant Machinery and Inhibits the Inflammatory and Apoptotic Cascades Against Lead Acetate-Induced Renal Injury in Rats. Frontiers in Physiology. https://doi.org/10.3389/fphys.2020.00064
