

The DOI matches its Crossref record; 41 of the 41 references it cites were found in a registry or an index; none of the 41 sources its claims cite is checked for support yet.
Body composition in male lifelong trained strength, sprint and endurance athletes and healthy age-matched controls
Open accessAbstract
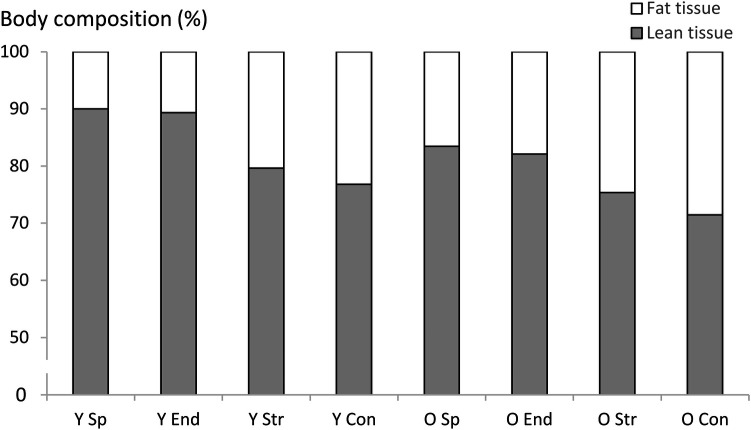
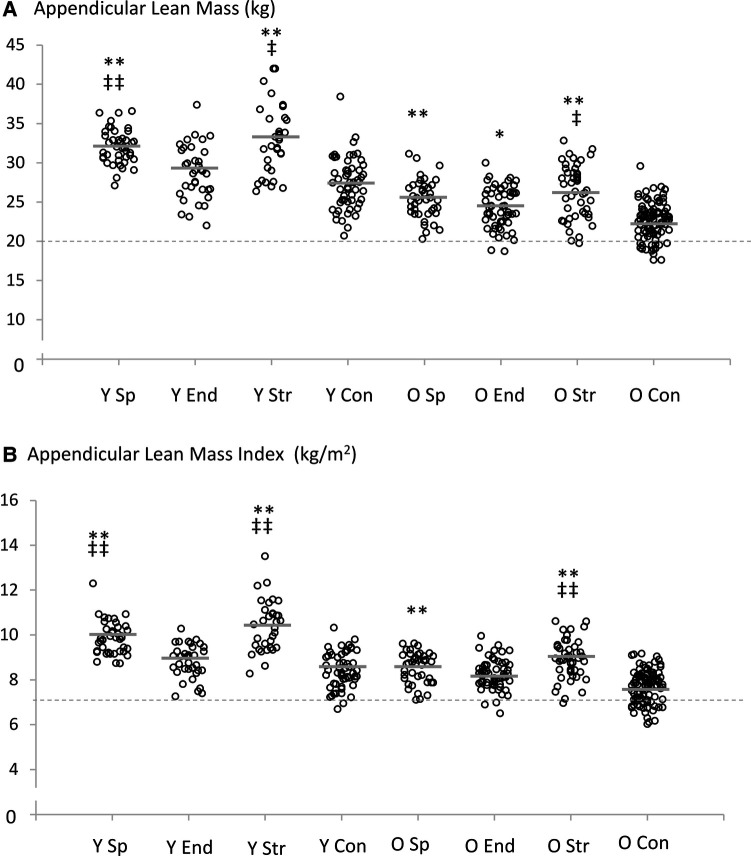
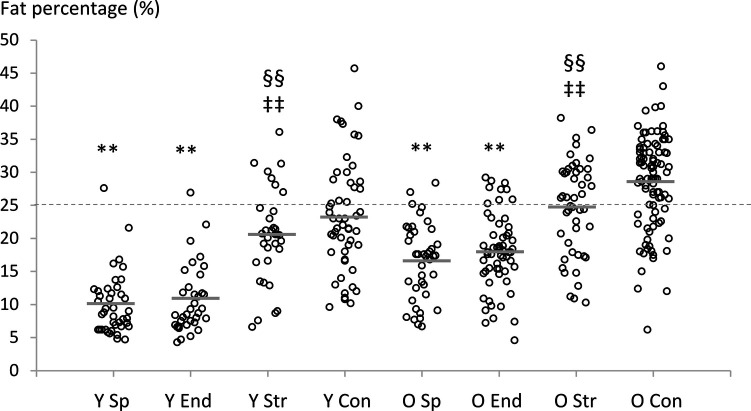
Introduction: Aging involves many physiological processes that lead to decreases in muscle mass and increases in fat mass. While regular exercise can counteract such negative body composition outcomes, masters athletes maintain high levels of exercise throughout their lives. This provides a unique model to assess the impact of inherent aging. The present study compared lean mass and fat mass in young and masters athletes from different sports to age-matched non-athletic individuals. Methods: Participants included young (20–39 years, n = 109) and older (70–89 years, n = 147) competitive male athletes, and 147 healthy age-matched controls (young = 53, older = 94 males). Athletes were separated into strength (e.g., weightlifters, powerlifters), sprint (e.g., sprint runners, jumpers) and endurance (e.g., long-distance runners, cross-country skiers) athletic disciplines. Body composition was assessed by dual-energy x-ray absorptiometry (DXA). Upper and lower limb lean mass was combined for appendicular lean mass as well as appendicular lean mass index (ALMI; kg/m 2). Individuals’ scores were assessed against established cut-offs for low muscle mass, obesity, and sarcopenic obesity to determine prevalence in each group. Results: ALMI was greater in young strength (0.81–2.36 kg/m 2, ∼15% and 1.24–2.74 kg/m 2, ∼19%) and sprint (95% CI = 0.51–1.61 kg/m 2, ∼11% and 0.96–1.97 kg/m 2, ∼15%) athletes than in endurance and controls, respectively (all P < 0.001). In masters athletes, only strength athletes had greater ALMI than endurance athletes, but both older strength and sprint athletes had greater ALMI than older controls (0.42–1.27 kg/m 2, ∼9% and 0.73–1.67 kg/m 2, ∼13%, respectively, both P < 0.001). Fat mass was significantly lower in sprint and endurance athletes compared to strength athletes and controls in both age-groups. Sarcopenic obesity was identified in one young (2%) and eighteen (19%) older controls, while only two older endurance athletes (3%) and one older strength athlete (2%) were identified. Discussion: Lifelong competitive sport participation leads to lower prevalence of sarcopenic obesity than a recreationally active lifestyle. This is achieved in strength athletes by emphasizing muscle mass, while sprint and endurance athletes demonstrate low fat mass levels. However, all older athlete groups showed higher fat mass than the young groups, suggesting that exercise alone may not be sufficient to manage fat mass.
Overview
CoChat Summary
TL;DR
In a cross-sectional DXA study of young and masters male athletes and age-matched controls, lifelong strength athletes showed the highest appendicular lean mass index while sprint and endurance athletes showed the lowest fat mass. Sarcopenic obesity prevalence was much lower in older athletes than controls, but all older athlete groups had higher fat mass than young athletes.
Key findings
- ALMI was greater in young strength and sprint athletes than endurance athletes and controls. Young strength vs endurance: 95% CI 0.81–2.36 kg/m² (~15%); vs controls: 1.24–2.74 kg/m² (~19%). Young sprint vs endurance: 0.51–1.61 kg/m² (~11%); vs controls: 0.96–1.97 kg/m² (~15%), all P < 0.001.
- In masters athletes, only strength athletes had greater ALMI than endurance athletes, but both older strength and sprint athletes had greater ALMI than older controls (reported 95% CIs 0.42–1.27 and 0.73–1.67 kg/m², both P < 0.001).
- Sprint and endurance athletes had lower total fat mass, fat percentage, and android fat mass than strength athletes and controls in both age groups (P < 0.001). Obesity by fat percentage >25% was present in 72% of older controls, 51% of older strength athletes, 15% of older endurance athletes, and 7% of older sprint athletes.
- Sarcopenic obesity was identified in one young control (2%); among older groups, two endurance athletes (3%), one strength athlete (2%), and eighteen controls (19%) were identified. Low muscle mass (ALM <20 kg) was predominantly in older controls (15, 16%), with two older endurance athletes (3%) and one older strength athlete (2%).
Methods
- Cross-sectional study using ATHLAS athletes and CALEX-family controls: 109 young (20–39 years) and 147 older (70–89 years) male athletes, plus 147 age-matched controls (young n = 53, older n = 94 males). Athletes were classified as strength, sprint, or endurance trained.
- Body composition was assessed by whole-body DXA (LUNAR Prodigy, GE Healthcare). Appendicular lean mass (ALM) combined upper and lower limb lean mass; ALMI = ALM/height². Low muscle mass cut-offs were ALM <20 kg or ALMI <7.0 kg/m², and obesity was defined as fat percentage >25%.
- Between-group differences were tested with Welch’s ANOVA across all eight groups, followed by Tamhane’s T2 post hoc tests; alpha was 0.05; analyses used SPSS version 26.
Limitations
- Stated: Measurements were partly performed during competition conditions, so muscle strength, chair rise, and walking speed tests could not be performed; by strict definition, neither sarcopenia nor sarcopenic obesity can be fully identified. DXA also cannot accurately assess intra-abdominal fat or intramuscular fat infiltration.
- Stated: Only males were examined, leaving unknown how aging and age-related processes including menopause affect comparisons in females; nutrition, precise training volume/intensity, and injury/illness could not be included as covariates.
- Stated/evident: The cross-sectional design prevents direct inferences about changes over time; the authors also note possible volunteer/selection bias toward healthier individuals, and controls were not engaged in structured competitive training while athletes had sport-specific training.
Model-written summary. Check it against the paper before relying on it.
Integrity signals
Registry
Cites
Statistics
Figures
Verification
Claims the paper makes
0 Valid · 0 Not valid · 26 Not checked · 72 Own results and interpretations
A result the paper reports from its own data — it cites no other source for it, so there is none to check. The quote shows it is in the paper.
In the paper
“Fat mass was significantly lower in sprint and endurance athletes compared to strength athletes and controls in both age-groups.”
- Also stated in: § Fat mass · plain
“Post hoc tests revealed that sprint and endurance athletes had lower fat mass/percentage compared to non-athletic controls (P < 0.001), regardless of age-group (Table 2).”
§ Body composition in male lifelong trained strength, sprint and endurance athletes and healthy age-matched controls > Abstract > Results
plainstates an association- Asserted: passes — The authors put it forward as true.
- Checkable: passes — It can be checked against evidence.
- Load-bearing: passes — The paper’s conclusions depend on it.
- Based: passes — The paper gives a reason why it holds.
- Also stated in: § Fat mass · plain
A result the paper reports from its own data — it cites no other source for it, so there is none to check. The quote shows it is in the paper.
In the paper
“Young sprint athletes had greater ALMI than young endurance athletes (95% CI = 0.51–1.61 kg/m2, P < 0.001).”
- Also stated in: § Results · plain
“ALMI was greater in young strength (0.81–2.36 kg/m2, ∼15% and 1.24–2.74 kg/m2, ∼19%) and sprint (95% CI = 0.51–1.61 kg/m2, ∼11% and 0.96–1.97 kg/m2, ∼15%) athletes than in endurance and controls, respectively (all P < 0.001).”
§ Body composition in male lifelong trained strength, sprint and endurance athletes and healthy age-matched controls > Results > Lean mass
plainstates an association- Asserted: passes — The authors put it forward as true.
- Checkable: passes — It can be checked against evidence.
- Load-bearing: unclear — It is unclear whether the paper’s conclusions depend on it.
- Based: passes — The paper gives a reason why it holds.
- Also stated in: § Results · plain
A result the paper reports from its own data — it cites no other source for it, so there is none to check. The quote shows it is in the paper.
In the paper
“ALMI was greater in young strength (0.81–2.36 kg/m2, ∼15% and 1.24–2.74 kg/m2, ∼19%) and sprint (95% CI = 0.51–1.61 kg/m2, ∼11% and 0.96–1.97 kg/m2, ∼15%) athletes than in endurance and controls, respectively (all P < 0.001).”
- Also stated in: § Lean mass · boosted
“Strength athletes also demonstrated greater ALMI than endurance athletes in both age-groups (young: 95% CI = 0.81–2.36 kg/m2, P < 0.001, older: 95% CI = 0.17–1.15 kg/m2, P = 0.001) (Table 2).”
§ Body composition in male lifelong trained strength, sprint and endurance athletes and healthy age-matched controls > Abstract > Results
boostedstates an association- Asserted: passes — The authors put it forward as true.
- Checkable: passes — It can be checked against evidence.
- Load-bearing: passes — The paper’s conclusions depend on it.
- Based: passes — The paper gives a reason why it holds.
- Also stated in: § Lean mass · boosted
A result the paper reports from its own data — it cites no other source for it, so there is none to check. The quote shows it is in the paper.
In the paper
“In the present study, strength athletes and non-athletic controls demonstrated similar fat mass characteristics regardless of the DXA-derived outcome measure.”
§ Body composition in male lifelong trained strength, sprint and endurance athletes and healthy age-matched controls > Discussion > Fat mass
boosted- Asserted: passes — The authors put it forward as true.
- Checkable: passes — It can be checked against evidence.
- Load-bearing: passes — The paper’s conclusions depend on it.
- Based: passes — The paper gives a reason why it holds.
A result the paper reports from its own data — it cites no other source for it, so there is none to check. The quote shows it is in the paper.
In the paper
“In the older groups, two endurance athletes (3%), 1 strength athlete (2%), and eighteen non-athletic controls (19%) were identified.”
- Also stated in: § Results · plain
“Sarcopenic obesity was identified in one young (2%) and eighteen (19%) older controls, while only two older endurance athletes (3%) and one older strength athlete (2%) were identified.”
§ Body composition in male lifelong trained strength, sprint and endurance athletes and healthy age-matched controls > Results > Sarcopenic obesity prevalence
plainSingle case- Asserted: passes — The authors put it forward as true.
- Checkable: passes — It can be checked against evidence.
- Load-bearing: unclear — It is unclear whether the paper’s conclusions depend on it.
- Based: passes — The paper gives a reason why it holds.
- Also stated in: § Results · plain
53 more claims
Create a free account to see all 98 claims and to verify the 41 references still open.
- It may state two separate claims as one. 33
- The quote only partly states this claim. 2
- Probably not a substantial claim. 20
Self-check
Percentages, sums and reported differences re-computed from the paper’s own numbers.
Each contradiction between two passages listed here was confirmed by an independent check.
Rated major: it would touch a result — a value a result rests on, reported and recomputed p-values on opposite sides of the significance level, two passages that conflict with no sign which is right, or a cited work retracted before this paper was published.
In the paper
§ Body composition in male lifelong trained strength, sprint and endurance athletes and healthy age-matched controls > Results > Age-group comparisons
“| Android fat mass (kg) | −1.07 to −0.28 (<0.001) | −1.10 to −0.35 (<0.001) | −1.44 to 0.14 (0.451) | −1.22 to 0.08 (0.023) |”
§ Body composition in male lifelong trained strength, sprint and endurance athletes and healthy age-matched controls > Results > Age-group comparisons
“In non-athletic controls, fat percentage, android fat mass and android:gynoid ratio was significantly different between young and older age-groups (Table 3).”
Rated major: it would touch a result — a value a result rests on, reported and recomputed p-values on opposite sides of the significance level, two passages that conflict with no sign which is right, or a cited work retracted before this paper was published.
In the paper
§ Body composition in male lifelong trained strength, sprint and endurance athletes and healthy age-matched controls > Abstract > Results
“both older strength and sprint athletes had greater ALMI than older controls (0.42–1.27 kg/m2, ∼9% and 0.73–1.67 kg/m2, ∼13%, respectively, both P < 0.001)”
§ Body composition in male lifelong trained strength, sprint and endurance athletes and healthy age-matched controls > Results > Lean mass
“For ALMI, significant differences were observed for both sprint and strength athletes compared to non-athletic controls in both age-groups (young: 95% CI = 0.96–1.97 kg/m2 and 1.24–2.74 kg/m2, older: 95% CI = 0.42–1.27 kg/m2 and 0.73–1.67 kg/m2, respectively, all P < 0.001)”
Rated minor: it would not touch a result — a value no result rests on, a p-value that stays on the same side of the significance level, or a conflict that is clerical, resolved elsewhere in the paper, or outside its own findings.
In the paper
§ Body composition in male lifelong trained strength, sprint and endurance athletes and healthy age-matched controls > Results > Age-group comparisons
“| Total fat mass (kg) | −6.91 to −0.49 (0.003) | −7.82 to −1.55 (<0.001) | −7.94 to −4.35 (1.000) | −7.65 to 2.68 (0.559) |”
§ Body composition in male lifelong trained strength, sprint and endurance athletes and healthy age-matched controls > Results > Age-group comparisons
“The only fat tissue outcome measure that was significantly different between young and older age-groups in strength athletes was android:gynoid ratio.”
Rated minor: it would not touch a result — a value no result rests on, a p-value that stays on the same side of the significance level, or a conflict that is clerical, resolved elsewhere in the paper, or outside its own findings.
In the paper
§ Body composition in male lifelong trained strength, sprint and endurance athletes and healthy age-matched controls > Discussion > Fat mass
“prevalence of obesity was low in these athletes (<15% compared to 72% in older non-athletic controls)”
§ Body composition in male lifelong trained strength, sprint and endurance athletes and healthy age-matched controls > Results > Fat mass
“In sprint and endurance athletes, there were one (2%) and one (3%) individual in the young age-group, respectively, and three (7%) and nine (15%) individuals in the older age-group, respectively (Figure 3).”
Rated minor: it would not touch a result — a value no result rests on, a p-value that stays on the same side of the significance level, or a conflict that is clerical, resolved elsewhere in the paper, or outside its own findings.
In the paper
§ Body composition in male lifelong trained strength, sprint and endurance athletes and healthy age-matched controls > Results > Age-group comparisons
“| ALMI (kg/m2) | 0.83 to 1.84 (<0.001) | 0.83 to 1.08 (0.009) | 0.73 to 2.27 (<0.001) | 0.29 to 1.14 (<0.001) |”
§ Body composition in male lifelong trained strength, sprint and endurance athletes and healthy age-matched controls > Results > Lean mass
“| ALMI (kg/m2) | 9.9 ± 0.7**,‡‡ | 8.8 ± 0.7 | 10.4 ± 1.1**,‡‡ | 8.4 ± 0.8 | 8.5 ± 0.7** | 8.2 ± 0.7 | 8.9 ± 0.9**,‡‡ | 7.7 ± 0.7 |”
Citations
Cites
Sarcopenia: revised European consensus on definition and diagnosis
Cruz-Jentoft, A. J., Bahat, G., Bauer, J., Boirie, Y., Bruyère, O., Cederholm, T., Cooper, C., Landi, F., Rolland, Y., Sayer, A. A., et al. (2019) · Age and Ageing · doi:10.1093/ageing/afy169 · Cited by 13,818
‘Small Changes' to Diet and Physical Activity Behaviors for Weight Management
Hills, A. P., Byrne, N. M., Lindstrom, R., & Hill, J. O. (2013) · Obesity Facts · doi:10.1159/000345030 · Cited by 9,493
Physical Activity in the United States Measured by Accelerometer
TROIANO, R. P., BERRIGAN, D., DODD, K. W., MÂSSE, L. C., TILERT, T., & MCDOWELL, M. (2008) · Medicine & Science in Sports & Exercise · doi:10.1249/mss.0b013e31815a51b3 · Cited by 7,638
Sarcopenia: revised European consensus on definition and diagnosis
Cruz-Jentoft, A. J., Bahat, G., Bauer, J., Boirie, Y., Bruyère, O., Cederholm, T., Cooper, C., Landi, F., Rolland, Y., Sayer, A. A., et al. (2019) · Age and Ageing · doi:10.1093/ageing/afz046 · Cited by 3,803
Lauretani, F., Russo, C. R., Bandinelli, S., Bartali, B., Cavazzini, C., Di Iorio, A., Corsi, A. M., Rantanen, T., Guralnik, J. M., & Ferrucci, L. (2003) · Journal of Applied Physiology · doi:10.1152/japplphysiol.00246.2003 · Cited by 1,946
Visser, M., Goodpaster, B. H., Kritchevsky, S. B., Newman, A. B., Nevitt, M., Rubin, S. M., Simonsick, E. M., Harris, T. B., & Study, F. T. H. A. (2005) · The Journals of Gerontology Series A: Biological Sciences and Medical Sciences · doi:10.1093/gerona/60.3.324 · Cited by 1,403
Mitchell, W. K., Williams, J., Atherton, P., Larvin, M., Lund, J., & Narici, M. (2012) · Frontiers in Physiology · doi:10.3389/fphys.2012.00260 · Cited by 1,377
DeFronzo, R. A., Gunnarsson, R., Björkman, O., Olsson, M., & Wahren, J. (1985) · Journal of Clinical Investigation · doi:10.1172/jci111938 · Cited by 1,167
Fat tissue, aging, and cellular senescence
Tchkonia, T., Morbeck, D. E., Von Zglinicki, T., Van Deursen, J., Lustgarten, J., Scrable, H., Khosla, S., Jensen, M. D., & Kirkland, J. L. (2010) · Aging Cell · doi:10.1111/j.1474-9726.2010.00608.x · Cited by 1,094
Definition and Diagnostic Criteria for Sarcopenic Obesity: ESPEN and EASO Consensus Statement
Donini, L. M., Busetto, L., Bischoff, S. C., Cederholm, T., Ballesteros-Pomar, M. D., Batsis, J. A., Bauer, J. M., Boirie, Y., Cruz-Jentoft, A. J., Dicker, D., et al. (2022) · Obesity Facts · doi:10.1159/000521241 · Cited by 1,019
Cited by
Pérez-Castillo, Í. M., Rueda, R., Pereira, S. L., Bouzamondo, H., Chicharro, J. L., Segura-Ortiz, F., & Atherton, P. J. (2025) · Nutrients · doi:10.3390/nu17223503 · Cited by 25
Rueda-Córdoba, M., Martín-Olmedo, J. J., Espinar, S., Ruiz, J. R., & Jurado‐Fasoli, L. (2025) · Nutrients · doi:10.3390/nu17071172 · Cited by 19
Zange, J., Endres, J., Clemen, C. S., & Rittweger, J. (2025) · The Journal of Physiology · doi:10.1113/jp285665 · Cited by 8
Pajski, M. L., Byrd, C., Nandigama, N., Seguin, E., Seguin, A., Fennell, A., & Graber, T. G. (2024) · Frontiers in Aging · doi:10.3389/fragi.2024.1356954 · Cited by 8
Ozemek, C., & Hardwick, J. (2025) · Heart and Mind · doi:10.4103/hm.hm-d-24-00078 · Cited by 4
Metadata
- Authors
- Walker, S., von Bonsdorff, M., Cheng, S., Häkkinen, K., Bondarev, D., Heinonen, A., & Korhonen, M. T.
- Affiliations
- University of Jyväskylä (FI)
- Folkhälsans Forskningscentrum (FI)
- Shanghai Jiao Tong University (CN)
- Corresponding author
- Walker, Simon
- ORCID
- Venue
- Frontiers in Sports and Active Living
- Publisher
- Frontiers Media SA
- Published
- 2023-10-31
- Volume
- 5
- Pages
- 1295906-1295906
- ISSN
- 2624-9367 (ISSN-L)
- PMC
- PMC10650965
- OpenAlex
- W4388070036
- Semantic Scholar
- 7799ce38afaae4bfbe141f6fd2edbb894c129f28
- Cited by
- 29
- References
- 41
- Citations by year
- 2026: 14 · 2025: 14 · 2024: 1
- FWCI
- 4.42
- Type
- journal article
- Language
- en
- Open access
- gold
- doi.org
- Licence
- Locations
- Frontiers in Sports and Active Living (publishedVersion, cc-by)
- PubMed Central (publishedVersion, cc-by)
- PubMed (publishedVersion)
- Jyväskylä University Digital Archive (University of Jyväskylä) (submittedVersion, cc-by)
- DOAJ (DOAJ: Directory of Open Access Journals) (submittedVersion, cc-by-sa)
- Funders
- Yrjö Jahnssonin Säätiö
- Juho Vainion Säätiö
- Päivikki ja Sakari Sohlbergin Säätiö
- Jyväskylän Yliopisto
- Topics
- Health Sciences › Medicine › Physiology (medical) › Nutrition and Health in Aging
- Health Sciences › Medicine › Physiology (medical) › Body Composition Measurement Techniques
- Health Sciences › Nursing › Nutrition and Dietetics › Muscle metabolism and nutrition
- Keywords
- body composition, masters athletes, aging, sarcopenic obesity, lean body mass, fat mass, appendicular lean mass index, strength athletes, sprinters, endurance athletes, muscle mass, obesity, sport discipline differences, lifelong physical exercise, older men, weightlifters, long-distance runners, cross-country skiers, powerlifters, jumpers, dual-energy X-ray absorptiometry
About these checks
Registry, retraction, Cites and statistics results are computed, not judged, with one exception: a printed reference that no index lists is read once by a model before it counts as a citation error. Claims are extracted by a model and kept only when their quote appears verbatim in the text; each cited source is then checked, with a model’s help, for whether it says what the claim relies on. Those verdicts can be wrong — read the claim’s quote and the cited source before relying on one.
A language model drew the claims from the paper on 2026-11-14, under version 3 of the claim definition (model deepseek-v4.1-flash, prompt extract-v3).
A second model labelled each claim on 2026-11-14 (model jev-1.13-20260917, definition revision gold-guideline-v0.2).
Statistics and arithmetic are recomputed, not judged.
Confidence bands are shown only for fields calibrated on our annotated test set. None is calibrated yet, so no band is shown.
What counts as a claim ›How we measure confidence ›How we check this ›
Are you an author, or do you see a problem with this page? Request a review
Data sources
Bibliographic data: Semantic Scholar, OpenAlex, Crossref.
Contains information from the Semantic Scholar Academic Graph Datasets, made available under the ODC Attribution License (ODC-BY 1.0).
Semantic Scholar’s data is described in: Kinney, R., et al. (2023). The Semantic Scholar Open Data Platform. arXiv:2301.10140.
