

The DOI matches its Crossref record; 43 of the 43 references it cites were found in a registry or an index; 1 of the 6 sources its claims cite were checked for support.
An Innovative Priority-Aware Mission Planning Framework for an Agile Earth Observation Satellite
Open accessAbstract
Earth observation satellites, particularly agile Earth observation satellites (AEOSs) with enhanced attitude maneuverability, have become increasingly crucial in emergency response and disaster monitoring operations.
Overview
CoChat Summary
TL;DR
This paper proposes a target clusters and dual-timeline optimization (TCDO) framework for agile Earth observation satellite mission planning, combining priority-based geographical clustering with temporal-spatial coordination. In simulations, TCDO reports 94% coverage and large computation-time reductions versus linear programming and genetic algorithms.
Key findings
- TCDO achieved a 94% coverage rate, matching the genetic algorithm (GA) and outperforming linear programming (LP) at 82%.
- Computation time was 1.8 s, representing reductions of 79%, 91%, and 99.5% compared with the no-clustering (NC), LP, and GA baselines, respectively.
- Priority-based observation rates were 100% for high-priority clusters, 92% for medium-priority clusters, and 89% for low-priority clusters.
- Total power consumption was 1.097 kWh, with 4.2% improved efficiency over baseline approaches; the priority-weighted score was S = 52.3, about 67% of the theoretical maximum, and 100-target scalability required 2.35 s.
Methods
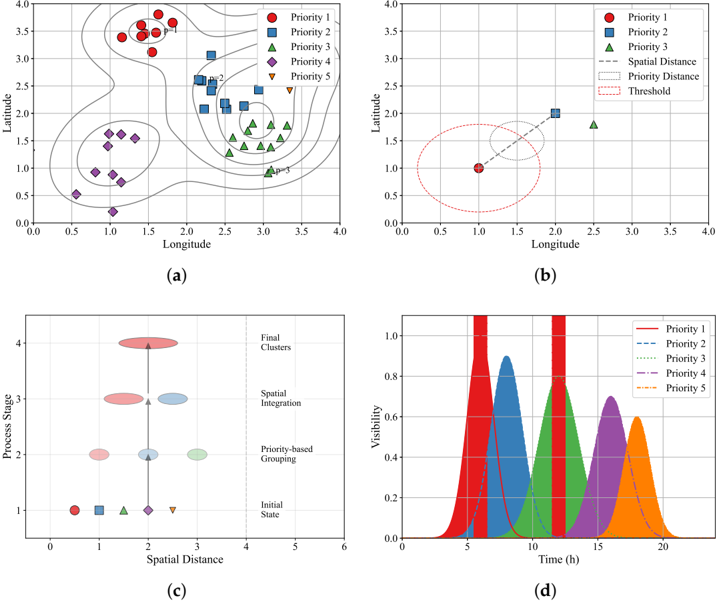
- The TCDO framework integrates priority-based geographical clustering using a composite Mahalanobis-plus-priority distance metric with a dual-timeline planning strategy that switches between short-term priority response and long-term coverage optimization under attitude, observation geometry, and power constraints.
- Simulations were implemented in Python 3.8 on a Lenovo China Y9000P laptop with an NVIDIA GeForce RTX 3060 GPU on Windows; satellite parameters were derived from the SPOT-6/7 series, including 3 deg/s maximum slew rate, ±45° roll/pitch limits, 2.4 kW peak maneuver power, 1.8 kW imaging power, and a 180 Ah 32 V battery with 80% depth-of-discharge limit.
- The scenario used 80 targets, 50 with visibility windows from 17:00:00 to 22:30:00 UTC on 10 November 2024, distributed over 25° N–50° N and 95° E–135° E, generated with stratified random sampling and Latin Hypercube Sampling; TCDO was compared against NC, LP, and GA.
Limitations
- The paper states future work will extend the framework to multi-satellite coordination and integrate downlink scheduling constraints.
- The paper states that environmental factors such as sensor performance or energy management are outside the current scope, and that communication scheduling is not addressed because the study focuses on observation planning.
- Evident from the text: results are simulation-only with no on-orbit or real-world validation, and the evaluation uses a single satellite, one region/time window, and a limited 80-target scenario with 50 visible targets; the model also simplifies attitude control to roll and pitch and focuses on circular LEO.
Model-written summary. Check it against the paper before relying on it.
Integrity signals
Registry
Cites
Statistics
Figures




Verification
Claims the paper makes
1 Valid · 1 Not valid · 3 Not checked · 43 Own results and interpretations
A result the paper reports from its own data — it cites no other source for it, so there is none to check. The quote shows it is in the paper.
In the paper
“The proposed approach effectively maintains satellite maneuver constraints while achieving significant improvements in priority-based target acquisition and computational efficiency.”
§ An Innovative Priority-Aware Mission Planning Framework for an Agile Earth Observation Satellite > Abstract
plainstates a cause- Asserted: passes — The authors put it forward as true.
- Checkable: passes — It can be checked against evidence.
- Load-bearing: passes — The paper’s conclusions depend on it.
- Based: passes — The paper gives a reason why it holds.
- Rests on an assumption not shown here.
A result the paper reports from its own data — it cites no other source for it, so there is none to check. The quote shows it is in the paper.
In the paper
“The proposed approach effectively maintains satellite maneuver constraints while achieving significant improvements in priority-based target acquisition and computational efficiency.”
§ An Innovative Priority-Aware Mission Planning Framework for an Agile Earth Observation Satellite > Abstract
plainstates a cause- Asserted: passes — The authors put it forward as true.
- Checkable: passes — It can be checked against evidence.
- Load-bearing: passes — The paper’s conclusions depend on it.
- Based: passes — The paper gives a reason why it holds.
- Rests on an assumption not shown here.
A result the paper reports from its own data — it cites no other source for it, so there is none to check. The quote shows it is in the paper.
In the paper
“Experimental results demonstrate the framework's superior performance, achieving a 94% coverage rate and a 99.5% reduction in computation time compared to traditional scheduling methods, such as linear programming and genetic algorithms.”
§ An Innovative Priority-Aware Mission Planning Framework for an Agile Earth Observation Satellite > Abstract
boostedstates a cause- Asserted: passes — The authors put it forward as true.
- Checkable: passes — It can be checked against evidence.
- Load-bearing: passes — The paper’s conclusions depend on it.
- Based: passes — The paper gives a reason why it holds.
- Rests on an assumption not shown here.
A result the paper reports from its own data — it cites no other source for it, so there is none to check. The quote shows it is in the paper.
In the paper
“The proposed approach effectively maintains satellite maneuver constraints while achieving significant improvements in priority-based target acquisition and computational efficiency.”
§ An Innovative Priority-Aware Mission Planning Framework for an Agile Earth Observation Satellite > Abstract
plainstates a cause- Asserted: passes — The authors put it forward as true.
- Checkable: passes — It can be checked against evidence.
- Load-bearing: passes — The paper’s conclusions depend on it.
- Based: passes — The paper gives a reason why it holds.
- Rests on an assumption not shown here.
A result the paper reports from its own data — it cites no other source for it, so there is none to check. The quote shows it is in the paper.
In the paper
“Experimental results demonstrate the framework's superior performance, achieving a 94% coverage rate and a 99.5% reduction in computation time compared to traditional scheduling methods, such as linear programming and genetic algorithms.”
§ An Innovative Priority-Aware Mission Planning Framework for an Agile Earth Observation Satellite > Abstract
boosted- Asserted: passes — The authors put it forward as true.
- Checkable: passes — It can be checked against evidence.
- Load-bearing: passes — The paper’s conclusions depend on it.
- Based: passes — The paper gives a reason why it holds.
- Rests on an assumption not shown here.
20 more claims
Create a free account to see all 48 claims and to verify the 2 references still open.
- Probably not a substantial claim. 7
- It may state two separate claims as one. 19
Self-check
Percentages, sums and reported differences re-computed from the paper’s own numbers.
Each contradiction between two passages listed here was confirmed by an independent check.
Rated minor: it would not touch a result — a value no result rests on, a p-value that stays on the same side of the significance level, or a conflict that is clerical, resolved elsewhere in the paper, or outside its own findings.
In the paper
§ An Innovative Priority-Aware Mission Planning Framework for an Agile Earth Observation Satellite > 4.1.1. Satellite and Target Parameters
“The scenario involves 80 targets with different priority levels, where 50 targets have visibility windows within the observation period (17:00:00-22:30:00 UTC, 10 November 2024).”
§ An Innovative Priority-Aware Mission Planning Framework for an Agile Earth Observation Satellite > 2.3. Mathematical Model
“∑ j∈S x i,j = 1, ∀i ∈ T (21”
Rated minor: it would not touch a result — a value no result rests on, a p-value that stays on the same side of the significance level, or a conflict that is clerical, resolved elsewhere in the paper, or outside its own findings.
In the paper
§ An Innovative Priority-Aware Mission Planning Framework for an Agile Earth Observation Satellite > 2.3. Mathematical Model
“∑ j∈S x i,j = 1, ∀i ∈ T (21”
§ An Innovative Priority-Aware Mission Planning Framework for an Agile Earth Observation Satellite > 4.3.1. Coverage and Computational Efficiency
“The TCDO framework achieves a 94% coverage rate, matching the performance of the GA while substantially outperforming LP (82%).”
Rated minor: it would not touch a result — a value no result rests on, a p-value that stays on the same side of the significance level, or a conflict that is clerical, resolved elsewhere in the paper, or outside its own findings.
In the paper
§ An Innovative Priority-Aware Mission Planning Framework for an Agile Earth Observation Satellite > 2.1. System Model
“z oi pointing toward the Earth's center, y oi perpendicular to the orbital plane, and x oi completing the right-handed system along the velocity direction”
§ An Innovative Priority-Aware Mission Planning Framework for an Agile Earth Observation Satellite > 2.1. System Model
“the third row contains the normalized angular momentum vector”
Citations
Cites
Wang, X., Wu, G., Xing, L., & Pedrycz, W. (2021) · IEEE Systems Journal · doi:10.1109/jsyst.2020.2997050 · Cited by 260
Optimizing Task Scheduling in Human-Robot Collaboration with Deep Multi-Agent Reinforcement Learning
Yu, T., Huang, J., & Chang, Q. (2021) · Journal of Manufacturing Systems · doi:10.1016/j.jmsy.2021.07.015 · Cited by 143
An exact algorithm for agile earth observation satellite scheduling with time-dependent profits
Peng, G., Song, G., Xing, L., Gunawan, A., & Vansteenwegen, P. (2020) · Computers & Operations Research · doi:10.1016/j.cor.2020.104946 · Cited by 93
Deep Reinforcement Learning Method for Satellite Range Scheduling Problem
Ou, J., Xing, L., Yao, F., Li, M., Lv, J., He, Y., Song, Y., Wu, J., & Zhang, G. (2023) · Swarm and Evolutionary Computation · doi:10.1016/j.swevo.2023.101233 · Cited by 91
Onboard Mission Planning for Agile Satellite Using Modified Mixed-Integer Linear Programming
She, Y., Li, S., & Zhao, Y. (2018) · Aerospace Science and Technology · doi:10.1016/j.ast.2017.11.009 · Cited by 88
Reinforcement Learning for the Agile Earth-Observing Satellite Scheduling Problem
Herrmann, A., & Schaub, H. (2023) · IEEE Transactions on Aerospace and Electronic Systems · doi:10.1109/taes.2023.3251307 · Cited by 70
Song, Y., Ou, J., Pedrycz, W., Suganthan, P. N., Wang, X., Xing, L., & Zhang, Y. (2024) · IEEE Transactions on Systems, Man, and Cybernetics: Systems · doi:10.1109/tsmc.2023.3345928 · Cited by 63
Li, J., Wu, G., Liao, T., Fan, M., Mao, X., & Pedrycz, W. (2023) · IEEE Transactions on Vehicular Technology · doi:10.1109/tvt.2022.3233358 · Cited by 61
Multi-Objective Scheduling of a Single Mobile Robot Based on the Grey Wolf Optimization Algorithm
Petrović, M., Jokić, A., Miljković, Z., & Kulesza, Z. (2022) · Applied Soft Computing · doi:10.1016/j.asoc.2022.109784 · Cited by 50
Wen, Z., Li, L., Song, J., Zhang, S., & Hu, H. (2023) · Advances in Space Research · doi:10.1016/j.asr.2022.10.024 · Cited by 46
Cited by
Zheng, L., Jiang, Q., Zhang, Y., & Chen, B. (2025) · Aerospace · doi:10.3390/aerospace12100914 · Cited by 1
A deliverability-aware mission scheduling framework for agile earth observation satellites
Zhu, G., Zheng, Z., Guo, Y., Sun, P., & Zhang, J. (2025) · Aerospace Science and Technology · doi:10.1016/j.ast.2025.111571 · Cited by 3
Self-citation
Metadata
- Authors
- Zhu, G., Zheng, Z., Ouyang, C., Guo, Y., & Sun, P.
- Affiliations
- Northwestern Polytechnical University (CN)
- Corresponding author
- Zheng, Zixuan
- Venue
- Aerospace
- Publisher
- MDPI AG
- Published
- 2025-04-04
- Volume
- 12
- Issue
- 4
- Pages
- 309
- ISSN
- 2226-4310 (ISSN-L)
- OpenAlex
- W4409163896
- Cited by
- 4
- References
- 39
- Citations by year
- 2026: 1 · 2025: 3
- FWCI
- 1.51
- Type
- journal article
- Language
- en
- Open access
- gold
- doi.org
- Licence
- Locations
- Aerospace (publishedVersion, cc-by)
- DOAJ (DOAJ: Directory of Open Access Journals) (submittedVersion, cc-by-sa)
- Funders
- National Key Laboratory of Helicopter Dynamics (2024-CXPT-GF-JJ-093-07)
- Topics
- Physical Sciences › Engineering › Aerospace Engineering › Spacecraft Dynamics and Control
- Physical Sciences › Engineering › Aerospace Engineering › Satellite Communication Systems
- Physical Sciences › Engineering › Aerospace Engineering › Spacecraft Design and Technology
- Keywords
- agile Earth observation satellites, satellite mission planning, target acquisition, target clustering, priority scheduling, disaster monitoring, emergency response, coverage rate
About these checks
Registry, retraction, Cites and statistics results are computed, not judged, with one exception: a printed reference that no index lists is read once by a model before it counts as a citation error. Claims are extracted by a model and kept only when their quote appears verbatim in the text; each cited source is then checked, with a model’s help, for whether it says what the claim relies on. Those verdicts can be wrong — read the claim’s quote and the cited source before relying on one.
The claim verdicts this report counts are experimental: their accuracy is not yet measured.
A language model drew the claims from the paper on 2026-10-10, under version 3 of the claim definition (model deepseek-v4.1-flash, prompt extract-v3).
A second model labelled each claim on 2026-10-10 (model jev-1.13-20260917, definition revision gold-guideline-v0.2).
Statistics and arithmetic are recomputed, not judged.
Confidence bands are shown only for fields calibrated on our annotated test set. None is calibrated yet, so no band is shown.
What counts as a claim ›How we measure confidence ›How we check this ›
Are you an author, or do you see a problem with this page? Request a review
How to cite
Cite CoChat for the checks on this page, and the paper for its own findings.
- This page
- CoChat. (2026). Citation check: An Innovative Priority-Aware Mission Planning Framework for an Agile Earth Observation Satellite. https://app.cochat.ai/papers/10.3390/aerospace12040309
- The paper
- Zhu, G., Zheng, Z., Ouyang, C., Guo, Y., & Sun, P. (2025). An Innovative Priority-Aware Mission Planning Framework for an Agile Earth Observation Satellite. Aerospace. https://doi.org/10.3390/aerospace12040309
Data sources
Bibliographic data: Semantic Scholar, OpenAlex, Crossref.
Contains information from the Semantic Scholar Academic Graph Datasets, made available under the ODC Attribution License (ODC-BY 1.0).
Semantic Scholar’s data is described in: Kinney, R., et al. (2023). The Semantic Scholar Open Data Platform. arXiv:2301.10140.
