

The DOI matches its Crossref record; 1 of the 1 references it cites were found in a registry or an index.
New Convolutional Neural Network and Graph Convolutional Network-Based Architecture for AI Applications in Alzheimer’s Disease and Dementia-Stage Classification
Open accessAbstract
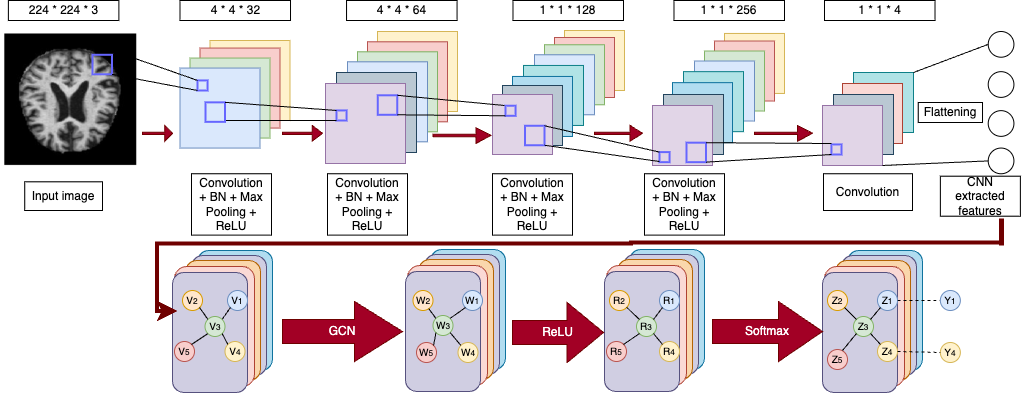
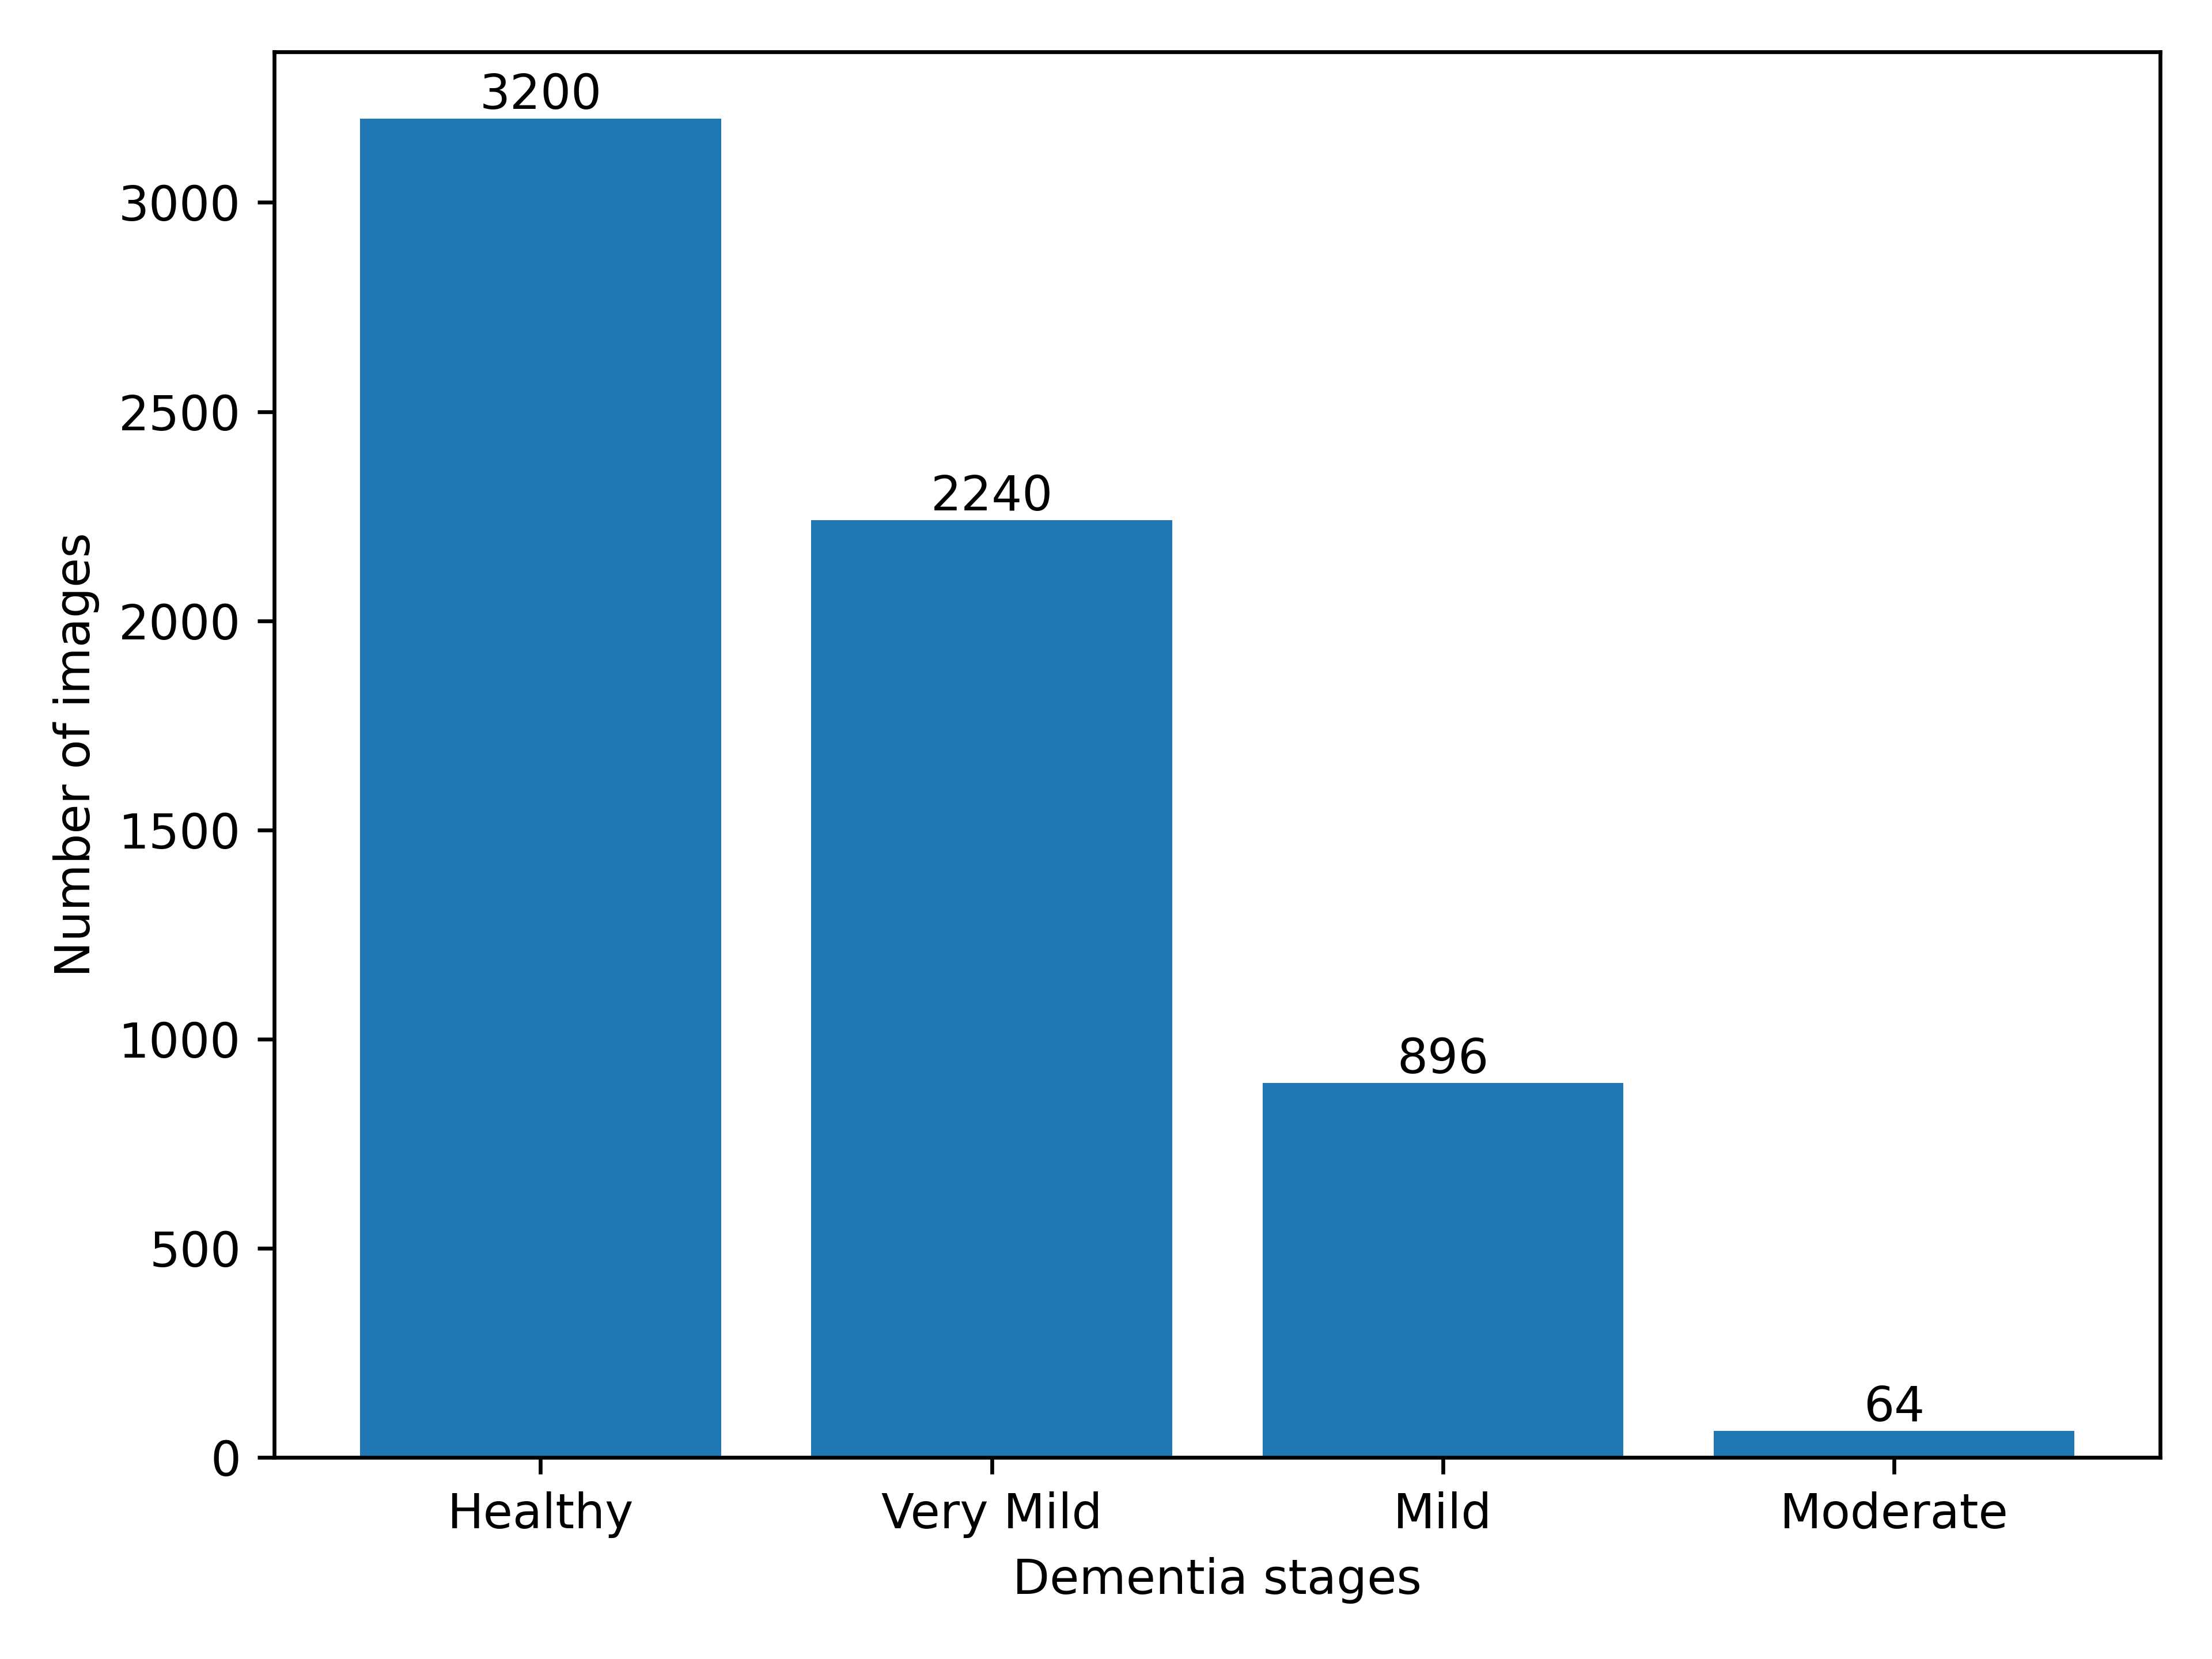
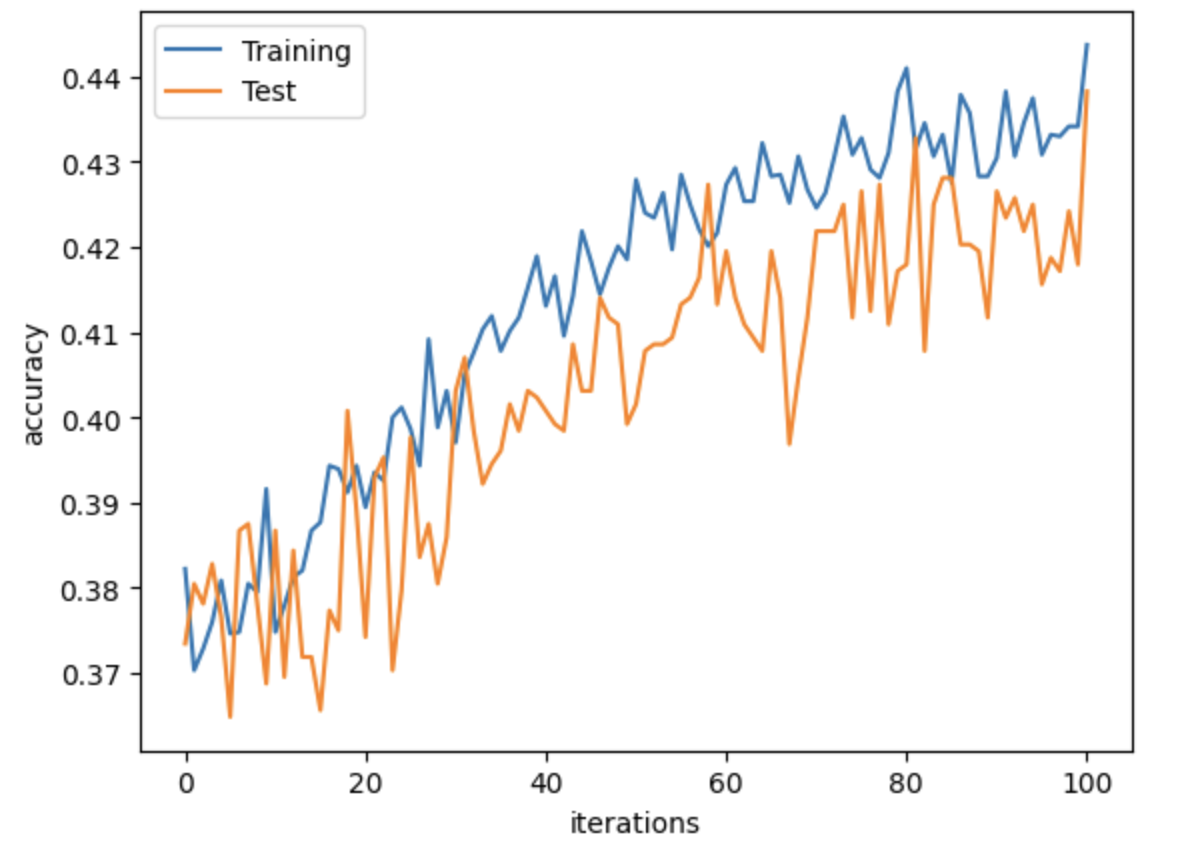
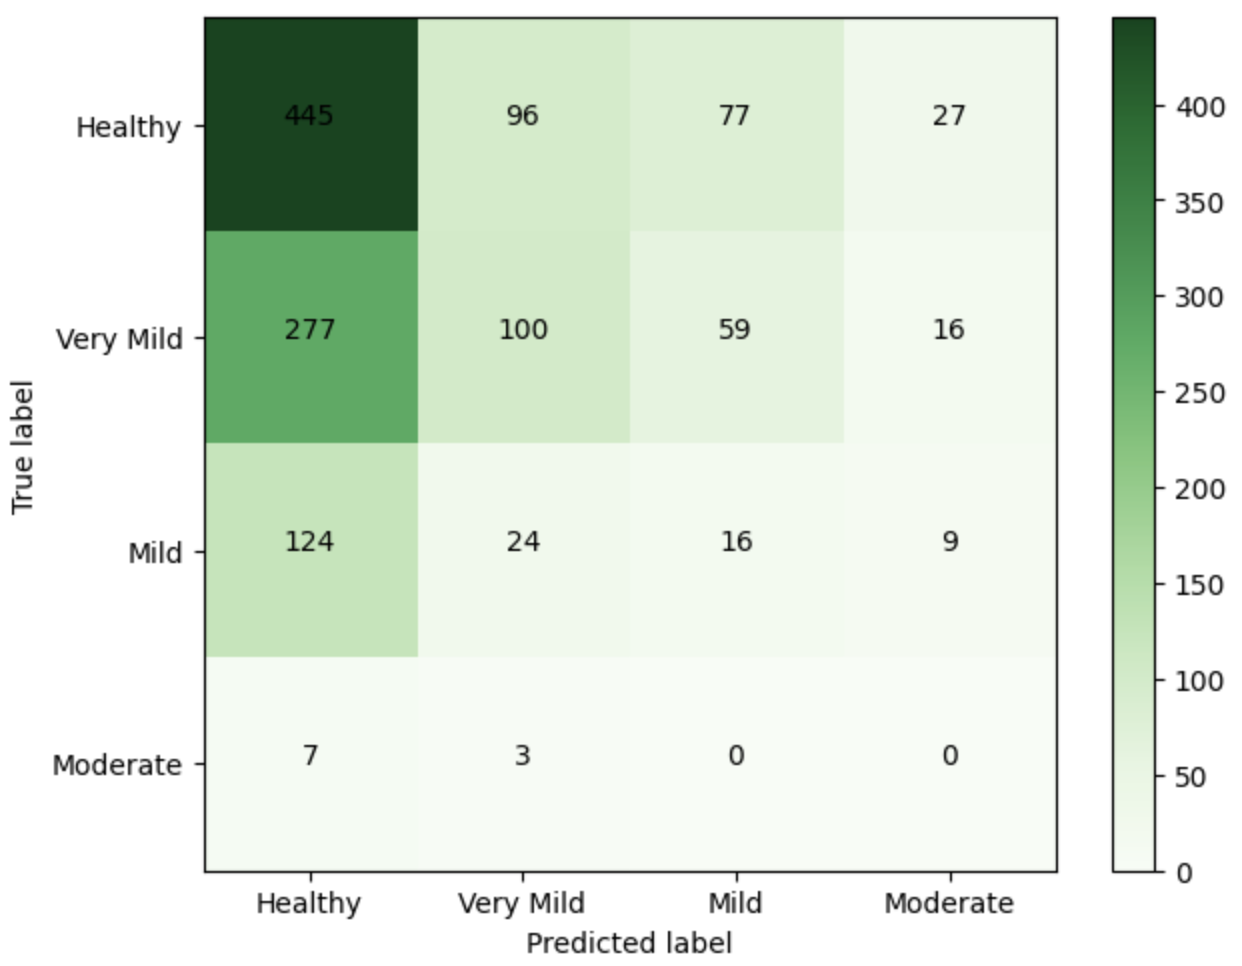
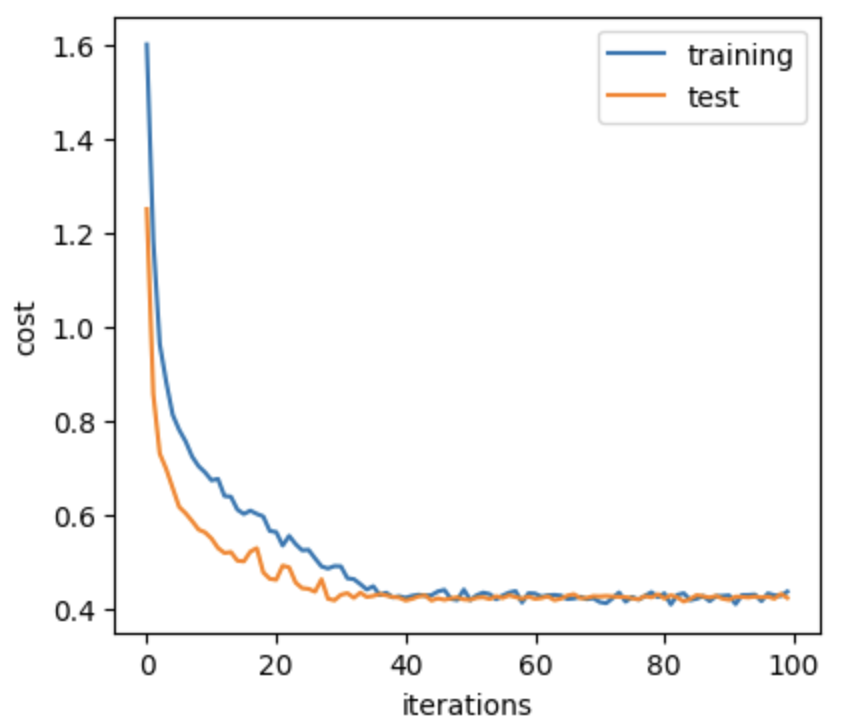
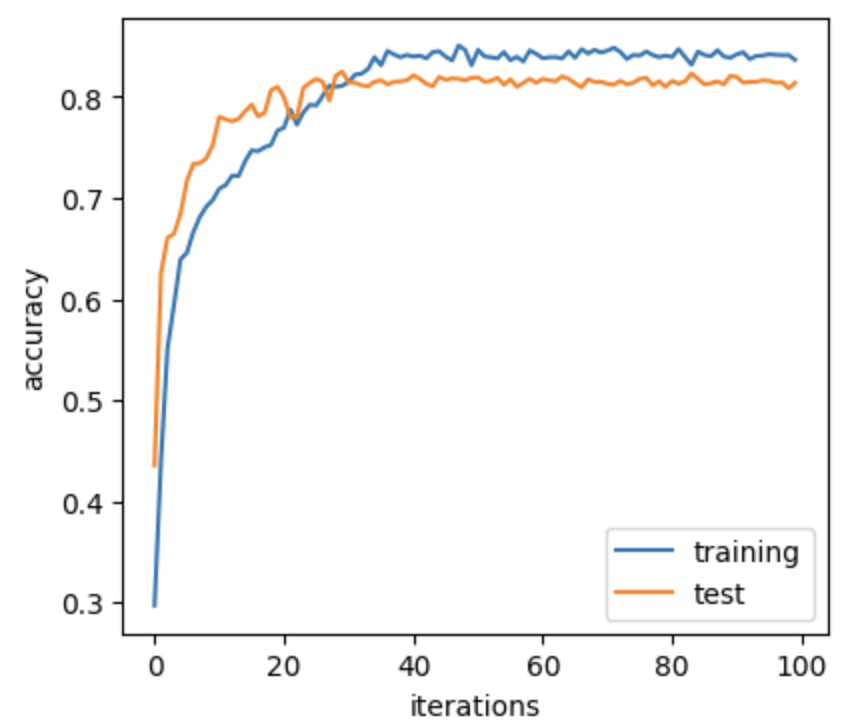
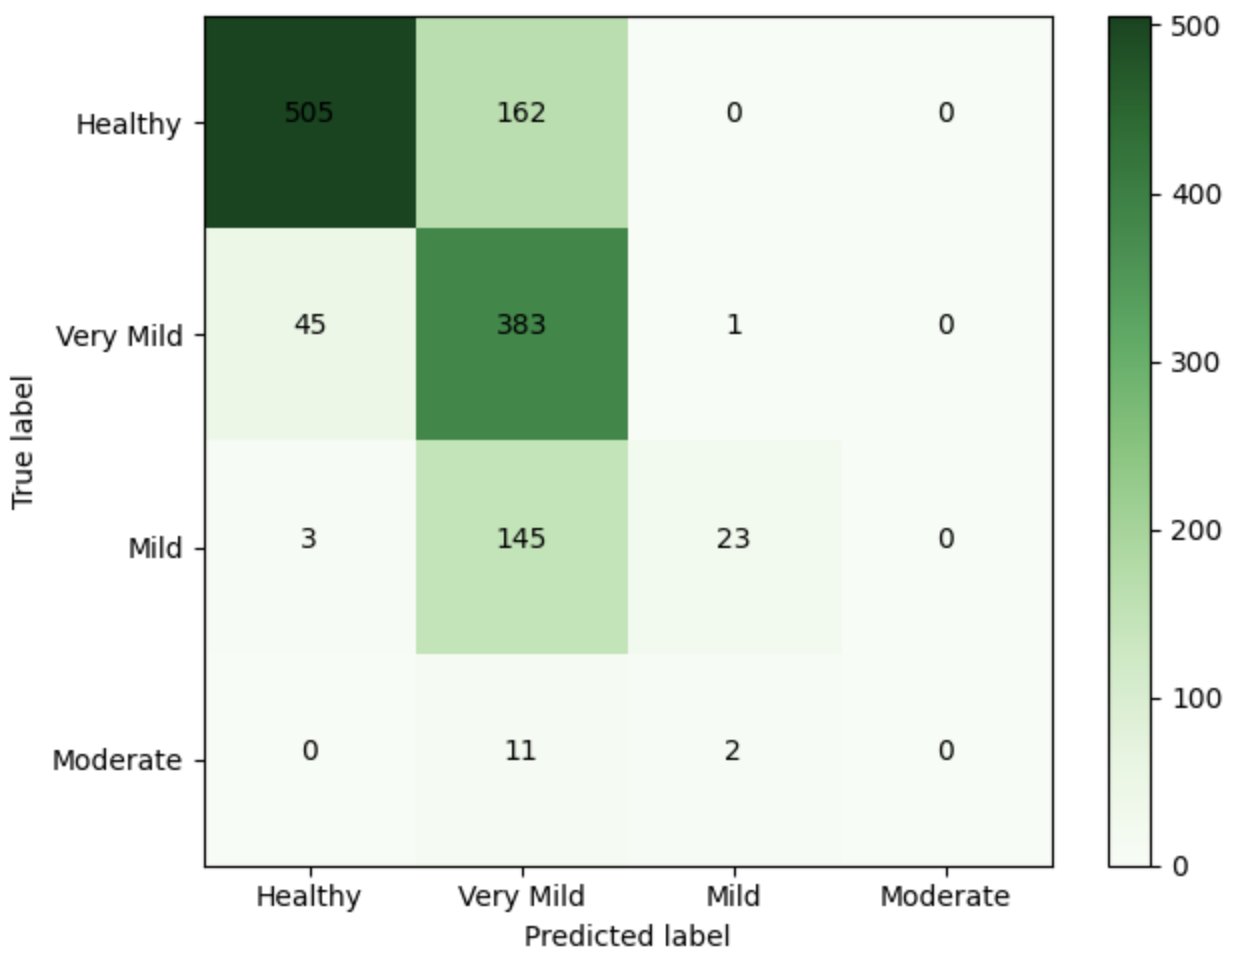
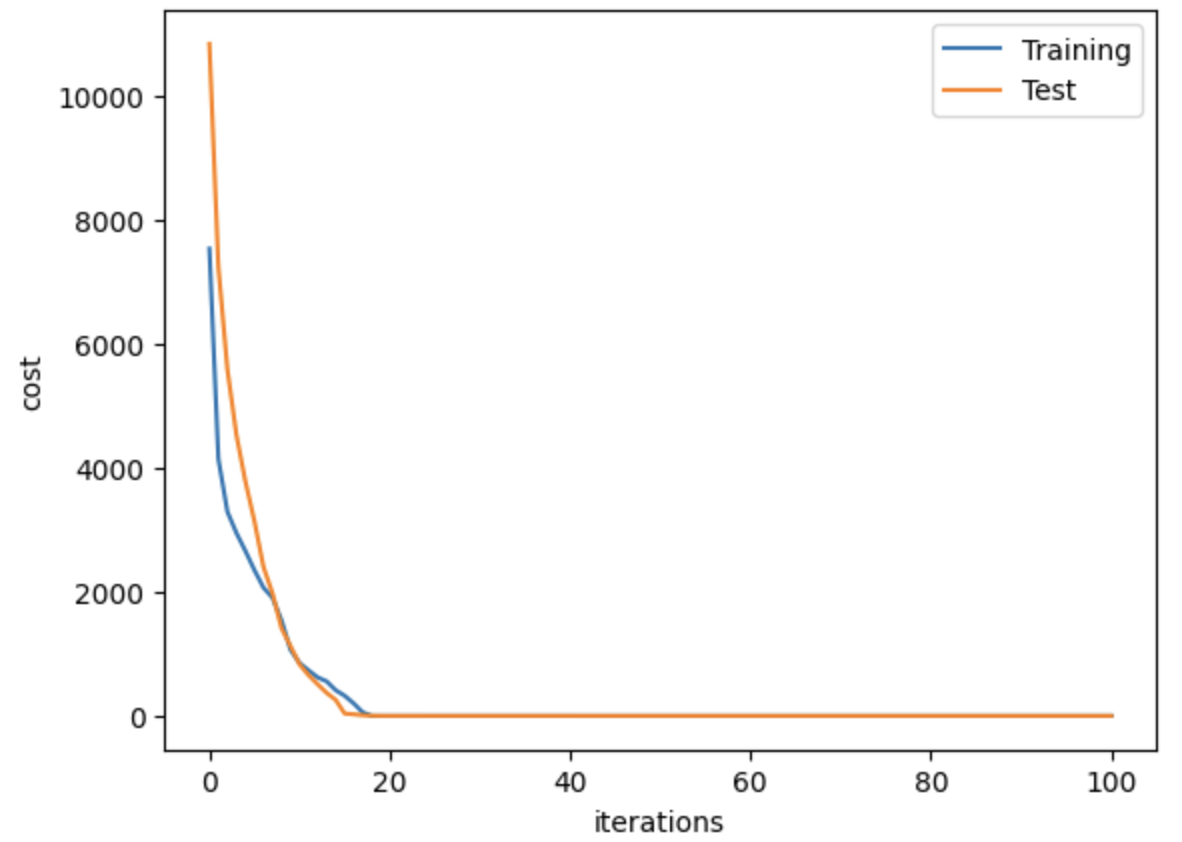
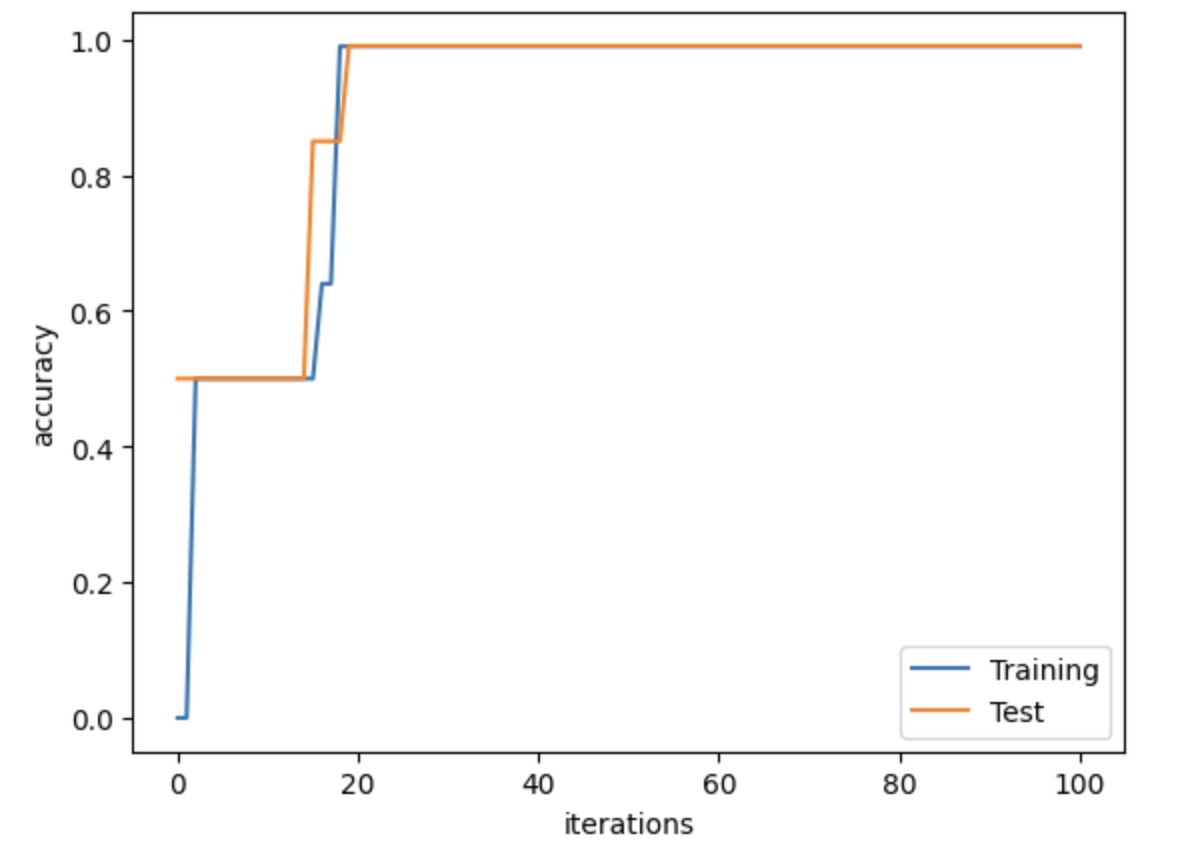
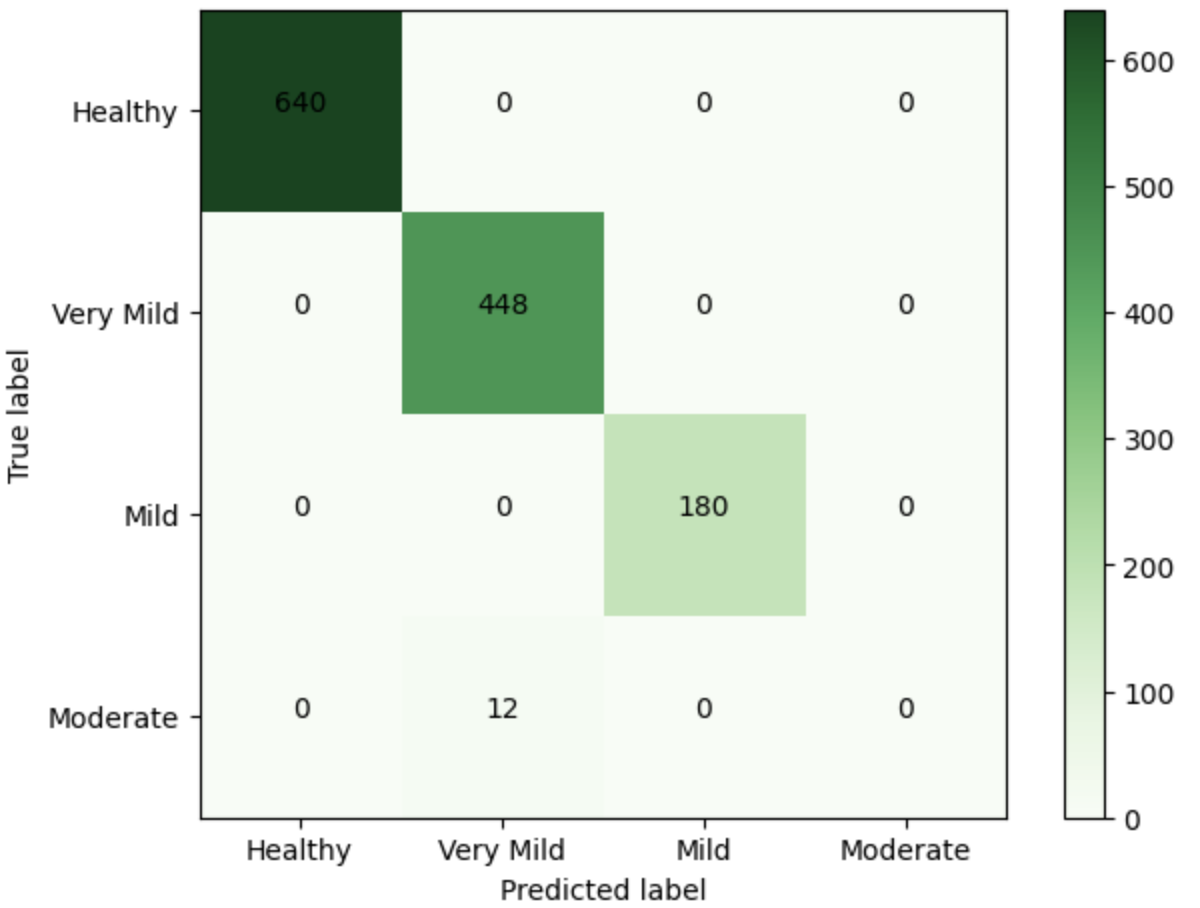
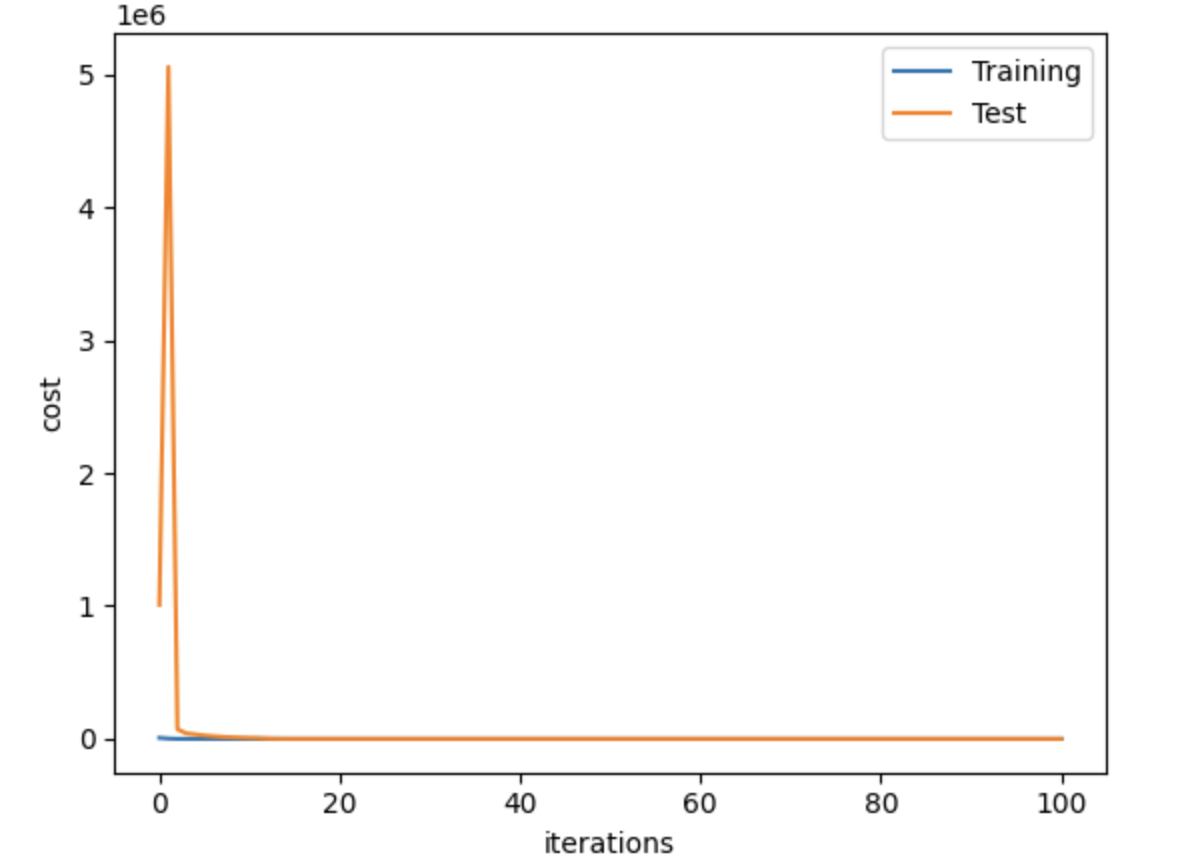
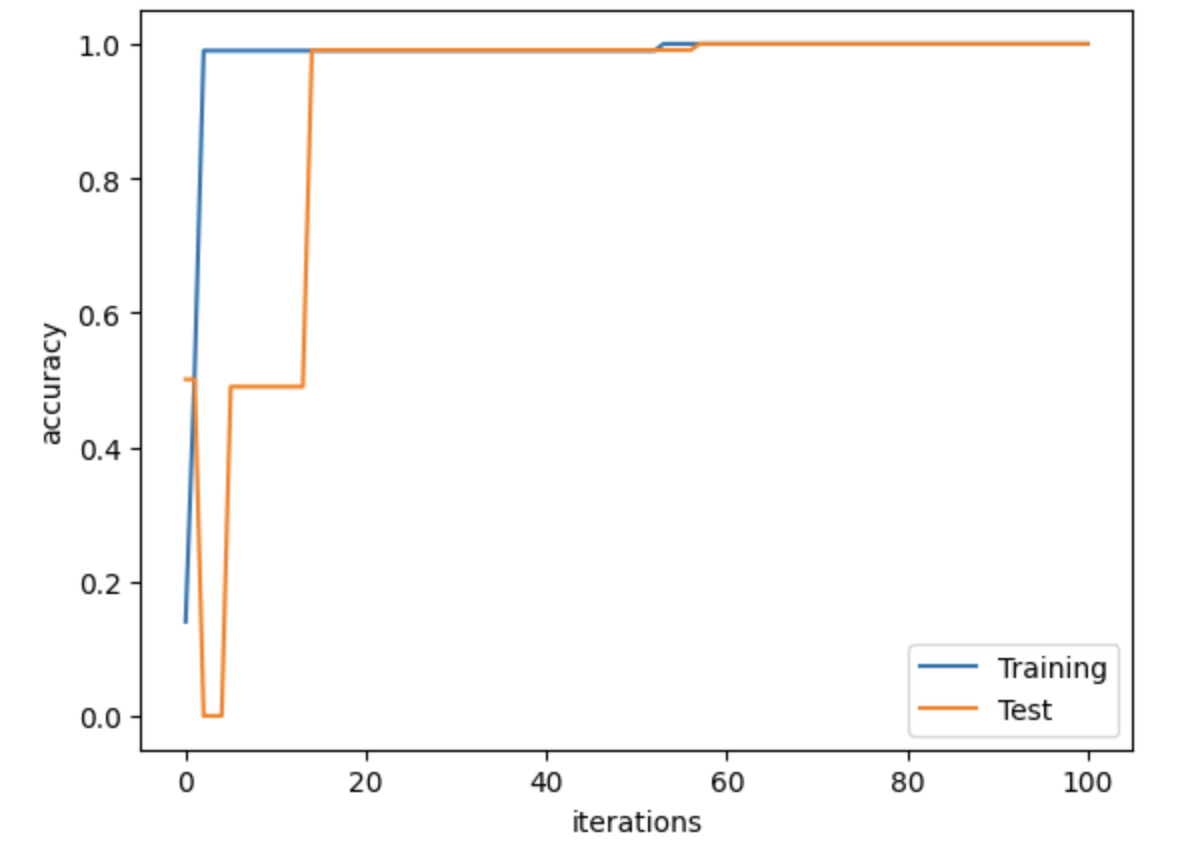
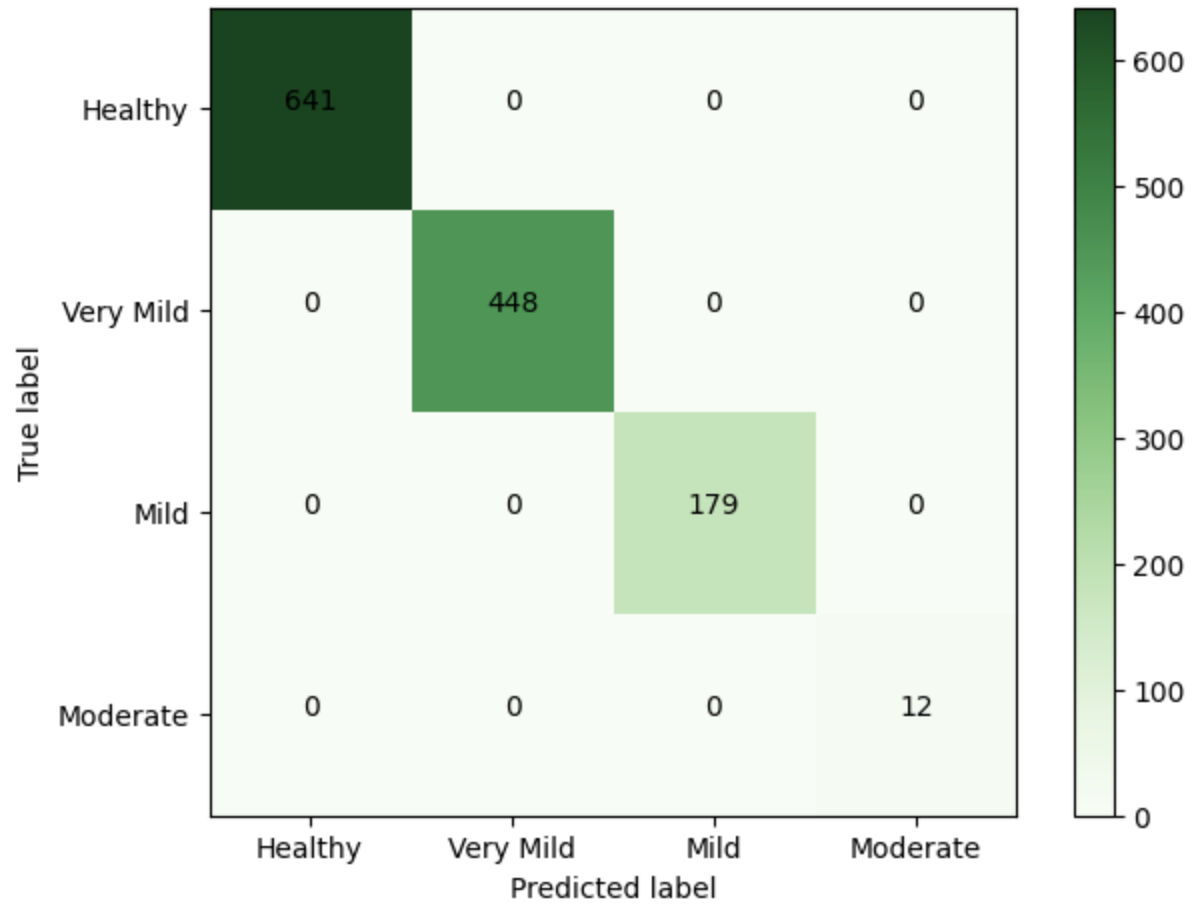
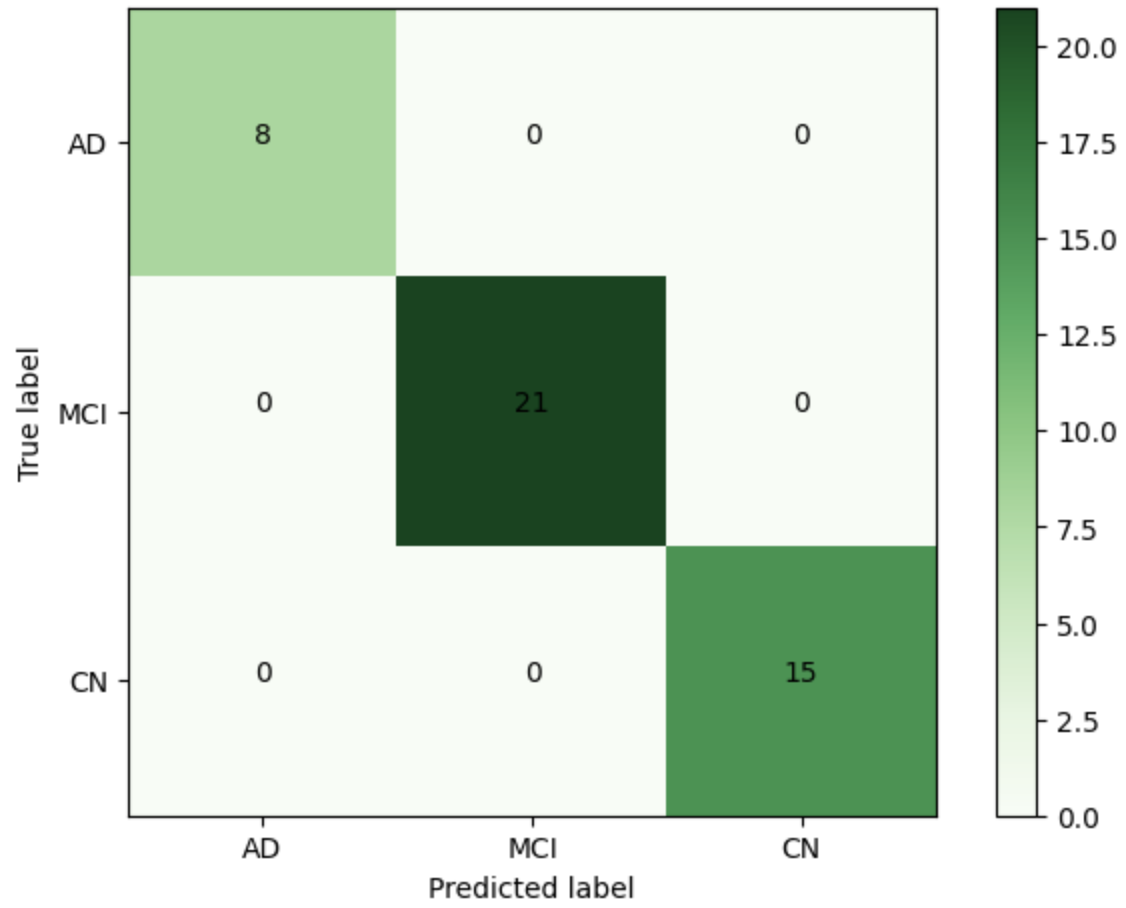
Neuroimaging experts in biotech industries can benefit from using cutting-edge artificial intelligence techniques for Alzheimer’s disease (AD)- and dementia-stage prediction, even though it is difficult to anticipate the precise stage of dementia and AD. Therefore, we propose a cutting-edge, computer-assisted method based on an advanced deep learning algorithm to differentiate between people with varying degrees of dementia, including healthy, very mild dementia, mild dementia, and moderate dementia classes. In this paper, four separate models were developed for classifying different dementia stages: convolutional neural networks (CNNs) built from scratch, pre-trained VGG16 with additional convolutional layers, graph convolutional networks (GCNs), and CNN-GCN models. The CNNs were implemented, and then the flattened layer output was fed to the GCN classifier, resulting in the proposed CNN-GCN architecture. A total of 6400 whole-brain magnetic resonance imaging scans were obtained from the Alzheimer’s Disease Neuroimaging Initiative database to train and evaluate the proposed methods. We applied the 5-fold cross-validation (CV) technique for all the models. We presented the results from the best fold out of the five folds in assessing the performance of the models developed in this study. Hence, for the best fold of the 5-fold CV, the above-mentioned models achieved an overall accuracy of 43.83%, 71.17%, 99.06%, and 100%, respectively. The CNN-GCN model, in particular, demonstrates excellent performance in classifying different stages of dementia. Understanding the stages of dementia can assist biotech industry researchers in uncovering molecular markers and pathways connected with each stage.
Overview
The claims and statistics of this paper haven’t been checked yet.
Run the check — free, no account needed. It reads the open-access text and checks the sources it cites.
Integrity signals
Registry
Cites
Statistics
Figures
Verification
Claims the paper makes
The claims and statistics of this paper haven’t been checked yet.
Run the check — free, no account needed. It reads the open-access text and checks the sources it cites.
Claims other papers make about this one
Each is checked against this paper’s own text: does it say what the citing paper says it does?
The source backs part of the claim, not all of it — or backs it for a different population, condition or comparison.
In the citing paper
“a CNN–GCN hybrid architecture outperformed standalone models across 6400 scans, achieving 100% accuracy in dementia staging by feeding CNN-extracted features into GCN classifiers”
From Multimodal neuroimaging and AI integration in cognitive disorders: advances, challenges, and future directions for precision medicine (2026) · cites this paper as Hasan and Wagler, 2024
Experimental — accuracy not yet measured
Self-check
Percentages, sums and reported differences re-computed from the paper’s own numbers.
The self-check needs the paper’s full text.
Citations
Cites
ImageNet classification with deep convolutional neural networks
Krizhevsky, A., Sutskever, I., & Hinton, G. E. (2017) · Communications of the ACM · doi:10.1145/3065386 · Cited by 112,155
Research works printed but not linked: 24
- Javeed, 2023, Machine Learning for Dementia Prediction: A Systematic Review and Future Research Directions, J. Med. Syst., 47, 17, 10.1007/s10916-023-01906-7 · DOI
- Lim, 2022, Deep learning model for prediction of progressive mild cognitive impairment to Alzheimer’s disease using structural MRI, Front. Aging Neurosci., 14, 560, 10.3389/fnagi.2022.876202 · DOI
- Basaia, 2019, Automated classification of Alzheimer’s disease and mild cognitive impairment using a single MRI and deep neural networks, Neuroimage Clin., 21, 101645, 10.1016/j.nicl.2018.101645 · DOI · Paper page
- Jiang, 2020, Deep learning based mild cognitive impairment diagnosis using structure MR images, Neurosci. Lett., 730, 134971, 10.1016/j.neulet.2020.134971 · DOI
- Aderghal, 2020, Improving Alzheimer’s stage categorization with Convolutional Neural Network using transfer learning and different magnetic resonance imaging modalities, Heliyon, 6, e05652, 10.1016/j.heliyon.2020.e05652 · DOI
- Basheera, 2020, A novel CNN based Alzheimer’s disease classification using hybrid enhanced ICA segmented gray matter of MRI, Comput. Med Imaging Graph., 81, 101713, 10.1016/j.compmedimag.2020.101713 · DOI
- Acharya, 2019, Automated detection of Alzheimer’s disease using brain MRI images—A study with various feature extraction techniques, J. Med. Syst., 43, 1, 10.1007/s10916-019-1428-9 · DOI
- Nagarathna, 2023, Classifying the stages of Alzheimer’s disease by using multi layer feed forward neural network, Procedia Comput. Sci., 218, 1845, 10.1016/j.procs.2023.01.162 · DOI
- Kapadnis, M.N., Bhattacharyya, A., and Subasi, A. (2023). Applications of Artificial Intelligence in Medical Imaging, Elsevier.
- Wee, 2019, Cortical graph neural network for AD and MCI diagnosis and transfer learning across populations, Neuroimage Clin., 23, 101929, 10.1016/j.nicl.2019.101929 · DOI
- Guo, J., Qiu, W., Li, X., Zhao, X., Guo, N., and Li, Q. (2019, January 9–12). Predicting Alzheimer’s disease by hierarchical graph convolution from positron emission tomography imaging. Proceedings of the 2019 IEEE International Conference on Big Data (Big Data), Los Angeles, CA, USA. · DOI
- Park, 2023, Deep learning application for the classification of Alzheimer’s disease using 18F-flortaucipir (AV-1451) tau positron emission tomography, Sci. Rep., 13, 8096, 10.1038/s41598-023-35389-w · DOI
- Tajammal, 2023, Deep Learning-Based Ensembling Technique to Classify Alzheimer’s Disease Stages Using Functional MRI, J. Healthc. Eng., 2023, 6961346, 10.1155/2023/6961346 · DOI
- Liu, 2022, Generalizable deep learning model for early Alzheimer’s disease detection from structural MRIs, Sci. Rep., 12, 17106, 10.1038/s41598-022-20674-x · DOI
- Simonyan, K., and Zisserman, A. (2014). Very deep convolutional networks for large-scale image recognition. arXiv.
- Hong, 2020, Graph convolutional networks for hyperspectral image classification, IEEE Trans. Geosci. Remote. Sens., 59, 5966, 10.1109/TGRS.2020.3015157 · DOI
- Selvaraju, R., Cogswell, M., Das, A., Vedantam, R., Parikh, D., and Batra, D. (2017, January 22–29). Grad-cam: Visual explanations from deep networks via gradient-based localization. Proceedings of the IEEE International Conference On Computer Vision, Venice, Italy. · DOI · Paper page
- Duchi, 2011, Adaptive subgradient methods for online learning and stochastic optimization, J. Mach. Learn. Res., 12, 2121
- Ioffe, S., and Szegedy, C. (2015, January 6–11). Batch normalization: Accelerating deep network training by reducing internal covariate shift. Proceedings of the International Conference on Machine Learning, PMLR, Lille, France.
- Gupta, 2019, Prediction and classification of Alzheimer’s disease based on combined features from apolipoprotein-E genotype, cerebrospinal fluid, MR, and FDG-PET imaging biomarkers, Front. Comput. Neurosci., 13, 72, 10.3389/fncom.2019.00072 · DOI
- Payan, A., and Montana, G. (2015). Predicting Alzheimer’s disease: A neuroimaging study with 3D convolutional neural networks. arXiv.
- Khvostikov, A., Aderghal, K., Benois-Pineau, J., Krylov, A., and Catheline, G. (2018). 3D CNN-based classification using sMRI and MD-DTI images for Alzheimer disease studies. arXiv.
- Valliani, A., and Soni, A. (2017, January 20–23). Deep residual nets for improved Alzheimer’s diagnosis. Proceedings of the 8th ACM International Conference on Bioinformatics, Computational Biology, and Health Informatics, Boston, MA, USA. · DOI
- Helaly, 2021, Deep learning approach for early detection of Alzheimer’s disease, Cogn. Comput., 14, 1711, 10.1007/s12559-021-09946-2 · DOI
Cited by
Dang, M., Liu, B., Chen, Y., & Zhang, Z. (2026) · Psychoradiology · doi:10.1093/psyrad/kkag007 · Cited by 10
Metadata
- Authors
- Hasan, M. E., & Wagler, A.
- Affiliations
- Department of Mathematical Sciences, The University of Texas at El Paso, 500 W. University Ave., El Paso, TX 79968, USA
- The University of Texas at El Paso (US)
- Venue
- AI
- Publisher
- MDPI AG
- Published
- 2024-02-01
- Volume
- 5
- Issue
- 1
- Pages
- 342-363
- ISSN
- 2673-2688 (ISSN-L)
- OpenAlex
- W4391451187
- Cited by
- 31
- References
- 1
- Citations by year
- 2026: 7 · 2025: 15 · 2024: 9
- FWCI
- 7.33
- Type
- journal article
- Language
- en
- Open access
- gold
- doi.org
- Licence
- Locations
- AI (publishedVersion, cc-by)
- DOAJ (DOAJ: Directory of Open Access Journals) (submittedVersion)
- Topics
- Health Sciences › Medicine › Psychiatry and Mental health › Dementia and Cognitive Impairment Research
- Physical Sciences › Computer Science › Computer Vision and Pattern Recognition › Advanced Neural Network Applications
- Life Sciences › Neuroscience › Cognitive Neuroscience › Functional Brain Connectivity Studies
- Keywords
- Alzheimer's disease, dementia staging, dementia classification, graph convolutional networks, convolutional neural networks, whole-brain MRI, ADNI, neuroimaging, deep learning classification
About these checks
Registry, retraction, Cites and statistics results are computed, not judged, with one exception: a printed reference that no index lists is read once by a model before it counts as a citation error. Claims are extracted by a model and kept only when their quote appears verbatim in the text; each cited source is then checked, with a model’s help, for whether it says what the claim relies on. Those verdicts can be wrong — read the claim’s quote and the cited source before relying on one.
Statistics and arithmetic are recomputed, not judged.
Confidence bands are shown only for fields calibrated on our annotated test set. None is calibrated yet, so no band is shown.
What counts as a claim ›How we measure confidence ›How we check this ›
Are you an author, or do you see a problem with this page? Request a review
