

The DOI matches its Crossref record.
Population Structure Analysis of the Border Collie Dog Breed in Hungary
Open accessAbstract
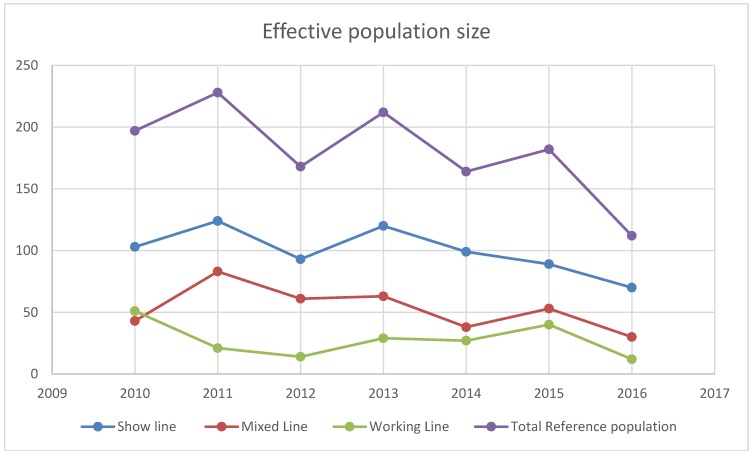
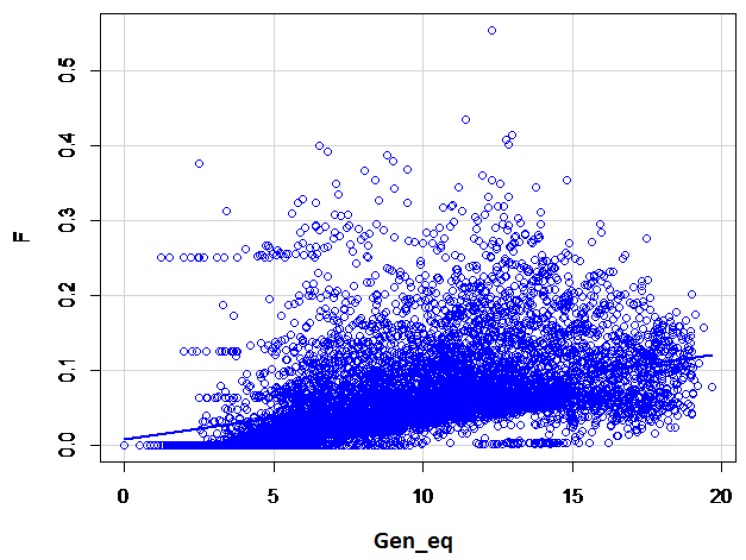
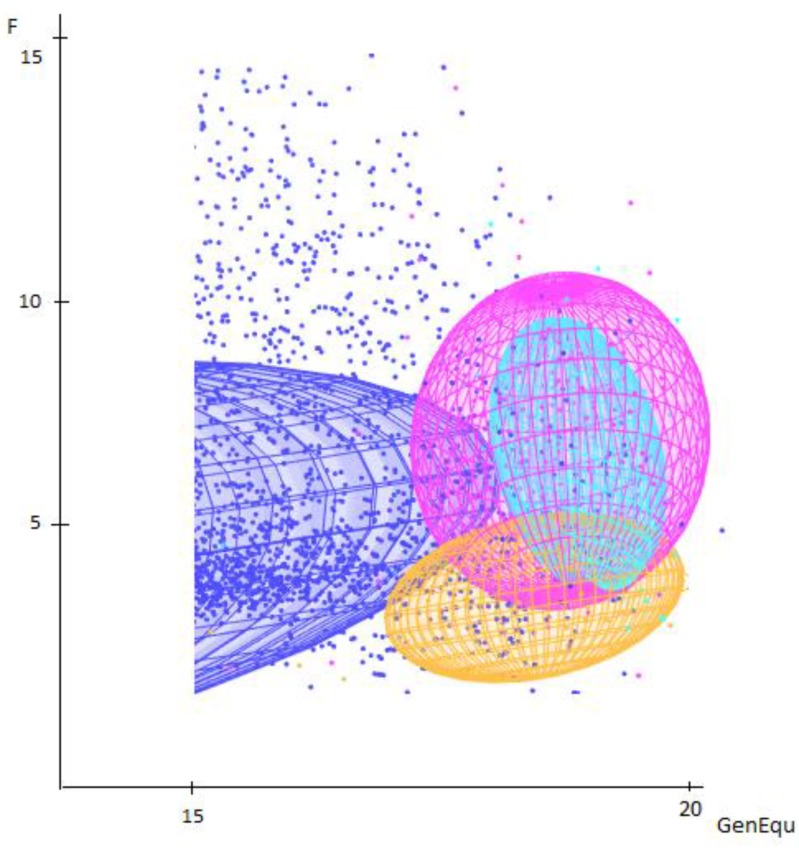
Pedigree data of the Border Collie dog breed were collected in Hungary to examine genetic diversity within the breed and its different lines. The database was based on available herd books dating from the development of the breed (in the late 1800s) to the present day. The constructed pedigree file consisted of 13,339 individuals, of which 1566 dogs (born between 2010 and 2016) composed the alive reference population which was active from breeding perspective. The breed is subdivided by phenotype, showing a thicker coat, harmonic movement, a wide skull, and heavier bones for the show type, and a thinner or sometimes short coat and smaller body for the working line, while the mixed line is quite heterogeneous (a combination of the above). Thus, the reference population was dissected according to the existing lines. The number of founders was 894, but eight individuals were responsible for contributing 50% of the genetic variability. The reference population had a pedigree completeness of 99.6% up to 15 generations and an inbreeding coefficient of 9.86%. Due to the changing breed standards and the requirements of the potential buyers, the effective population size substantially decreased between 2010 and 2016. Generation intervals varied between 4.09 and 4.71 years, where the sire paths were longer due to the later initial age of breeding in males compared to females. Genetic differences among the existing lines calculated by fixation indices are not significant; nonetheless ancestral inbreeding coefficients are able to show contrasts.
Overview
The claims and statistics of this paper haven’t been checked yet.
Run the check — free, no account needed. It reads the open-access text and checks the sources it cites.
Integrity signals
Registry
Cites
Statistics
Figures
Verification
Claims the paper makes
The claims and statistics of this paper haven’t been checked yet.
Run the check — free, no account needed. It reads the open-access text and checks the sources it cites.
Claims other papers make about this one
Each is checked against this paper’s own text: does it say what the citing paper says it does?
The source backs part of the claim, not all of it — or backs it for a different population, condition or comparison.
In the citing paper
“In some breeds, such as the Border Collie, 50% of their genetic variability is linked to fewer than ten animals [134].”
From Ethical Concerns about Fashionable Dog Breeding (2024) · cites this paper as [134]
Experimental — accuracy not yet measured
Self-check
Percentages, sums and reported differences re-computed from the paper’s own numbers.
The self-check needs the paper’s full text.
Citations
Cites
No references could be resolved yet.
Research works printed but not linked: 22
- Lasagna, 2014, Genetic Differentiation Between Segugio Dell’Appeinnino and Segugio Maremmano Dog Breeds Assessed by Microsatellite Markers, Ital. J. Anim. Sci., 14, 3809
- Goyache, 2005, A note on ENDOG: A computer program for analysing pedigree information, J. Anim. Breed. Genet., 122, 172, 10.1111/j.1439-0388.2005.00512.x · DOI
- Cervantes, 2008, Individual increase in inbreeding allows estimating realised effective sizes from pedigrees, Genet. Sel. Evol., 40, 359, 10.1186/1297-9686-40-4-359 · DOI
- Wright, S. (1978). Evolution and the Genetics of Populations: Variability within and among Natural Populations, University of Chicago Press.
- Caballero, 2000, Interrelations between effective population size and other pedigree tools for the management of conserved populations, Genet. Res., 75, 331, 10.1017/S0016672399004449 · DOI
- Caballero, 2002, Analysis of genetic diversity for the management of conserved subdivided populations, Conserv. Gener., 3, 289, 10.1023/A:1019956205473 · DOI
- Ballou, 1997, Ancestral inbreeding only minimally affects inbreeding depression in mammalian populations, J. Hered., 88, 169, 10.1093/oxfordjournals.jhered.a023085 · DOI
- Kalinowski, 2000, Inbreeding Depression in the Speke’s Gazelle Captive Breeding Program, Conserv. Biol., 14, 1375, 10.1046/j.1523-1739.2000.98209.x · DOI
- Kalinowski, 2002, Evolutionary and Statistical Properties of Three Genetic Distances, Mol. Ecol., 11, 1263, 10.1046/j.1365-294X.2002.01520.x · DOI
- Baumung, 2015, GRAIN: A computer program to calculate ancestral and partial inbreeding coefficients using a gene dropping approach, J. Anim. Breed. Genet., 132, 100, 10.1111/jbg.12145 · DOI
- Leroy, 2011, Mating practices and the dissemination of genetic disorders in domestic animals, based on the example of dog breeding, Anim. Genet., 42, 66, 10.1111/j.1365-2052.2010.02079.x · DOI
- Calboli, 2008, Population Structure and Inbreeding from Pedigree Analysis of Purebred Dogs, Genetics, 1, 593, 10.1534/genetics.107.084954 · DOI
- Maignel, 1996, Genetic variability of French dairy breeds estimated from pedigree information, Interbull Bull., 14, 49
- Leroy, 2013, Methods to estimate effective population size using pedigree data: Examples in dog, sheep, cattle and horse, Genet. Sel. Evol., 45, 1, 10.1186/1297-9686-45-1 · DOI
- Cecchi, 2016, Demographic approach on the study of genetic parameters in the dog Braque Francais type Pyrénées Italian population, Ital. J. Anim. Sci., 15, 30, 10.1080/1828051X.2015.1128689 · DOI
- Leroy, 2006, Genetic variability in French dog breeds assessed by pedigree data, J. Anim. Breed. Genet., 123, 1, 10.1111/j.1439-0388.2006.00565.x · DOI
- Boichard, 1997, The value of using probabilities of gene origin to measure genetic variability in a population, Genet. Sel. Evol., 29, 5, 10.1186/1297-9686-29-1-5 · DOI
- 2010, Population structure and genetic diversity of worldwide Nova Scotia Duck Tolling Retriever and Lancashire Heeler dog populations, J. Anim. Breed. Genet., 4, 318
- Ubbink, G.J. (1998). Inherited Disease in Purebred Dog Populations; Prediction Based on Common Ancestry. [Ph.D. Thesis, Utrecht University].
- Nielen, 1999, Evaluation of genetic, common-litter, and within-litter effects on preweaning mortality in a birth cohort of puppies, Am. J. Vet. Res., 60, 1106, 10.2460/ajvr.1999.60.09.1106 · DOI
- Bokor, 2013, Pedigree analysis of the Hungarian Thoroughbred population, Livest. Sci., 151, 1, 10.1016/j.livsci.2012.10.010 · DOI
- Nagy, 2010, Genetic diversity and population structure of the synthetic Pannon White rabbit revealed by pedigree analyses, J. Anim. Sci., 88, 1267, 10.2527/jas.2009-2273 · DOI
Cited by
Sorted by citations
Ethical Concerns about Fashionable Dog Breeding
Menor-Campos, D. J. (2024) · Animals · doi:10.3390/ani14050756 · Cited by 20
Metadata
- Authors
- Ács, V., Bokor, Á., & Nagy, I.
- Affiliations
- University of Kaposvár (HU)
- Corresponding author
- Ács, Virág
- Venue
- Animals
- Publisher
- MDPI AG
- Published
- 2019-05-16
- Volume
- 9
- Issue
- 5
- Pages
- 250
- ISSN
- 2076-2615 (ISSN-L)
- PMC
- PMC6562970
- OpenAlex
- W2939546222
- Cited by
- 19
- References
- 0
- Citations by year
- 2026: 1 · 2025: 1 · 2024: 4 · 2023: 2 · 2022: 3 · 2021: 2 · 2020: 6
- FWCI
- 1.66
- Type
- journal article
- Language
- en
- Open access
- gold
- doi.org
- Licence
- Locations
- Animals (publishedVersion, cc-by)
- Europe PMC (PubMed Central) (publishedVersion, cc-by)
- PubMed Central (publishedVersion, cc-by)
- PubMed (publishedVersion)
- DOAJ (DOAJ: Directory of Open Access Journals) (submittedVersion, cc-by-sa)
- Funders
- Országos Tudományos Kutatási Alapprogramok (128177)
- National Excellence Program of the Ministry of Human Capacities (ÚNKP-18-3)
- Topics
- Life Sciences › Biochemistry, Genetics and Molecular Biology › Genetics › Genetic and phenotypic traits in livestock
- Life Sciences › Biochemistry, Genetics and Molecular Biology › Genetics › Genetic diversity and population structure
- Life Sciences › Agricultural and Biological Sciences › Animal Science and Zoology › Human-Animal Interaction Studies
- Keywords
- Border Collie, dog breeds, population structure, genetic diversity, pedigree analysis, founder effect, inbreeding coefficient, effective population size, generation interval
About these checks
Registry, retraction, Cites and statistics results are computed, not judged, with one exception: a printed reference that no index lists is read once by a model before it counts as a citation error. Claims are extracted by a model and kept only when their quote appears verbatim in the text; each cited source is then checked, with a model’s help, for whether it says what the claim relies on. Those verdicts can be wrong — read the claim’s quote and the cited source before relying on one.
Statistics and arithmetic are recomputed, not judged.
Confidence bands are shown only for fields calibrated on our annotated test set. None is calibrated yet, so no band is shown.
What counts as a claim ›How we measure confidence ›How we check this ›
Are you an author, or do you see a problem with this page? Request a review
