

The DOI matches its Crossref record.
Optimizing the Seeding Density of Human Mononuclear Cells to Improve the Purity of Highly Proliferative Mesenchymal Stem Cells
Open accessAbstract
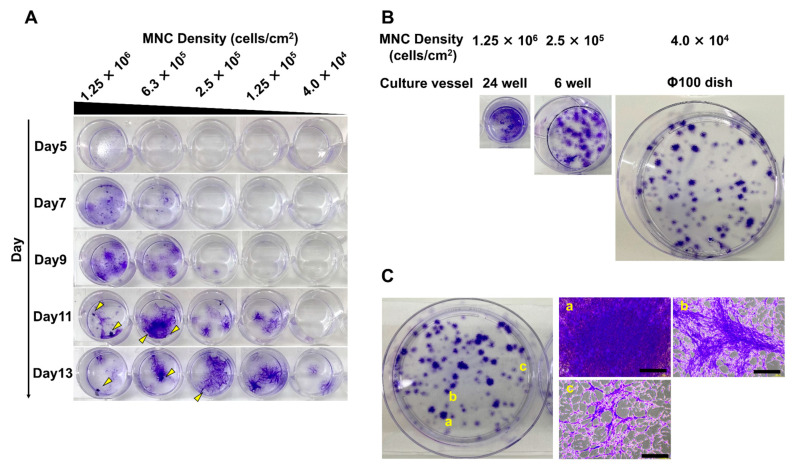
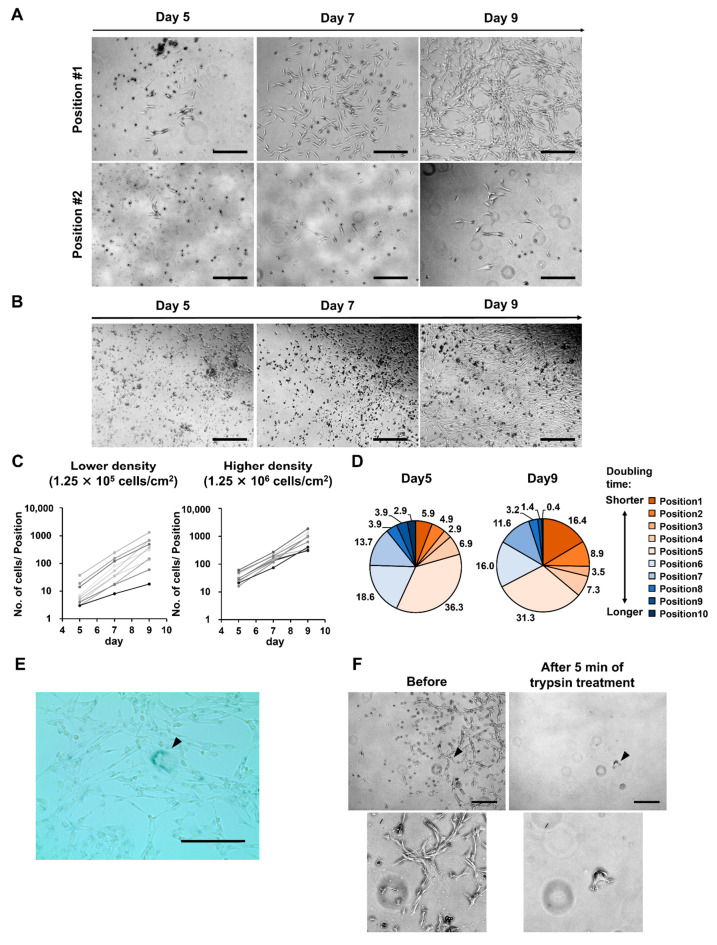
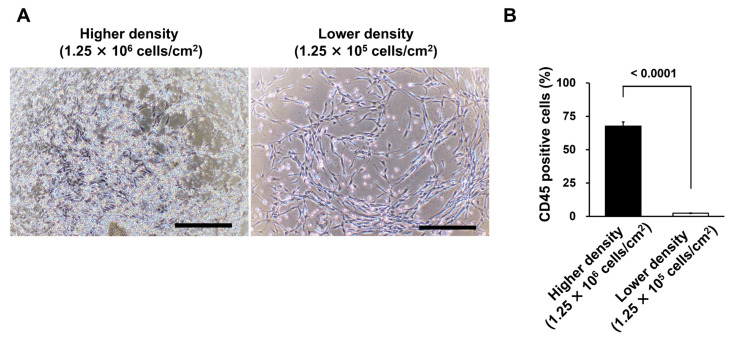
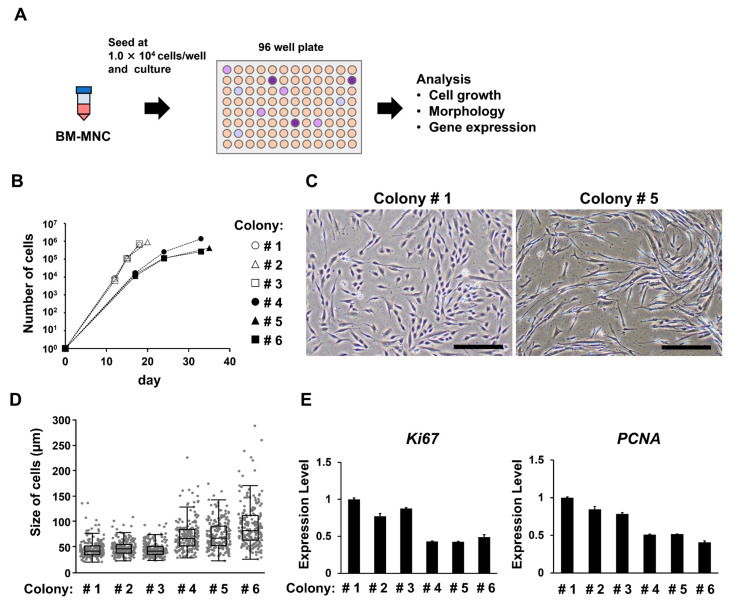
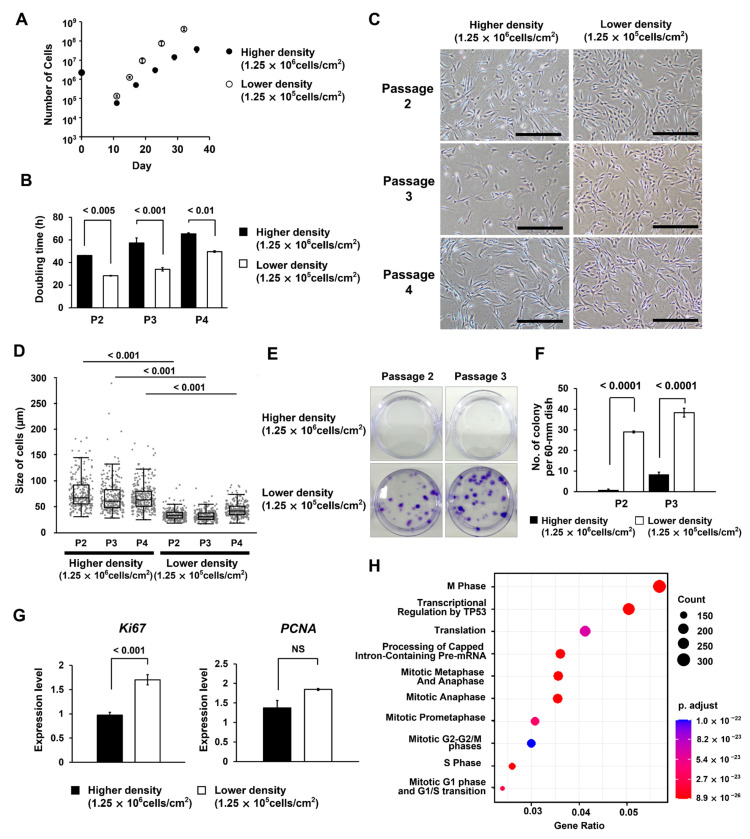
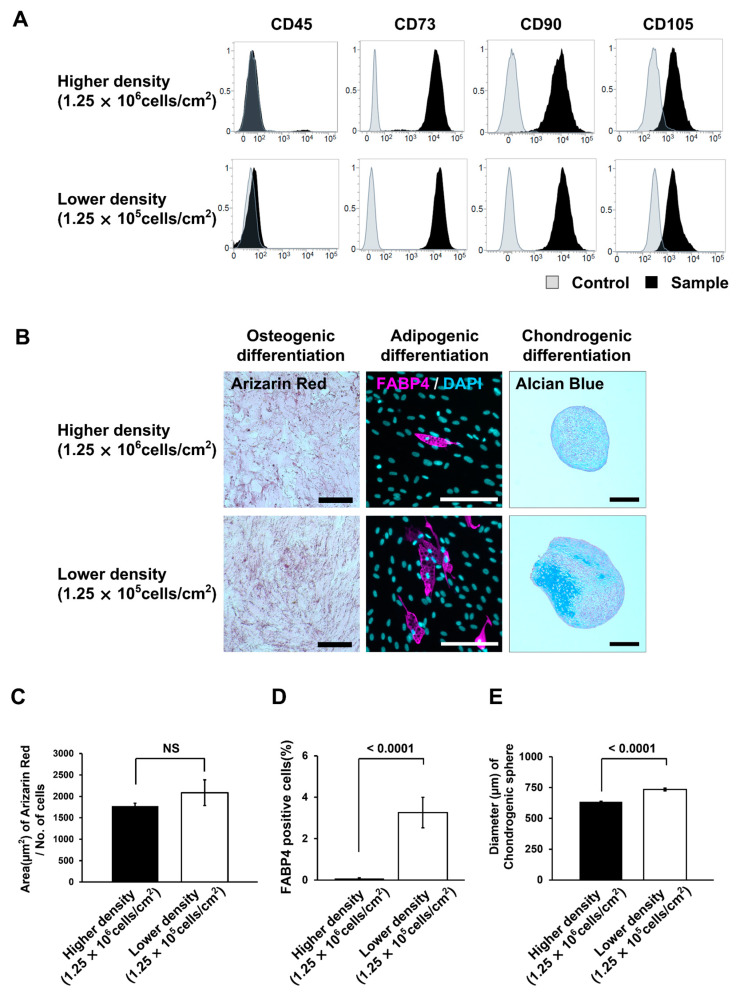
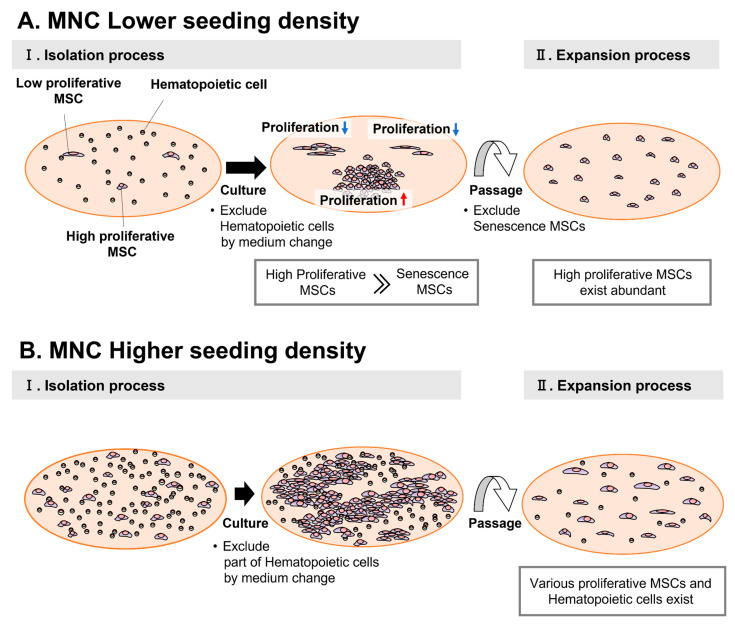
Mesenchymal stem cells (MSCs) hold considerable promise for regenerative medicine. Optimization of the seeding density of mononuclear cells (MNCs) improves the proliferative and differentiation potential of isolated MSCs. However, the underlying mechanism is unclear. We cultured human bone marrow MNCs at various seeding densities (4.0 × 10⁴, 1.25 × 10⁵, 2.5 × 10⁵, 6.0 × 10⁵, 1.25 × 10⁶ cells/cm2) and examined MSC colony formation. At lower seeding densities (4.0 × 10⁴, 1.25 × 10⁵ cells/cm2), colonies varied in diameter and density, from dense to sparse. In these colonies, the proportion of highly proliferative MSCs increased over time. In contrast, lower proliferative MSCs enlarged more rapidly. Senescent cells were removed using a short detachment treatment. We found that these mechanisms increase the purity of highly proliferative MSCs. Thereafter, we compared MSCs isolated under optimized conditions with a higher density (1.25 × 10⁶ cells/cm2). MSCs under optimized conditions exhibited significantly higher proliferative and differentiation potential into adipocytes and chondrocytes, except for osteocytes. We propose the following conditions to improve MSC quality: (1) optimizing MNC seeding density to form single-cell colonies; (2) adjusting incubation times to increase highly proliferative MSCs; and (3) establishing a detachment processing time that excludes senescent cells.
Overview
The claims and statistics of this paper haven’t been checked yet.
Run the check — free, no account needed. It reads the open-access text and checks the sources it cites.
Integrity signals
Registry
Cites
Statistics
Figures
Verification
Claims the paper makes
The claims and statistics of this paper haven’t been checked yet.
Run the check — free, no account needed. It reads the open-access text and checks the sources it cites.
Claims other papers make about this one
Each is checked against this paper’s own text: does it say what the citing paper says it does?
The source backs part of the claim, not all of it — or backs it for a different population, condition or comparison.
In the citing paper
“Inappropriate seeding densities, whether excessively high causing rapid passaging or too low prolonging culture, can impair MSC proliferation and differentiation, potentially triggering senescence or genetic instability [327, 328].”
From Mechanisms, efficacy, and future perspectives of cellular-based therapies for liver fibrosis/cirrhosis: focusing on mesenchymal stromal cells (2025) · cites this paper as [328]
Experimental — accuracy not yet measuredThe cited source says what the claim attributes to it.
In the citing paper
“Similarly, Nagai et al. (2023) showed that optimizing and standardizing the seeding density of human bone marrow mononuclear cells during MSC isolation improved the uniformity of highly proliferative MSC populations, which exhibited enhanced proliferation and differentiation potential under the optimized lower-density condition.”
From Primary cell cultures versus immortalized cell lines: critical comparative insights into biological fidelity and translational applications (2026) · cites this paper as Nagai et al. (2023)
The cited source says what the claim attributes to it.
In the citing paper
“Similarly, Nagai et al. (2023) showed that optimizing and standardizing the seeding density of human bone marrow mononuclear cells during MSC isolation improved the uniformity of highly proliferative MSC populations, which exhibited enhanced proliferation and differentiation potential under the optimized lower-density condition.”
From Primary cell cultures versus immortalized cell lines: critical comparative insights into biological fidelity and translational applications (2026) · cites this paper as Nagai et al. (2023)
Self-check
Percentages, sums and reported differences re-computed from the paper’s own numbers.
The self-check needs the paper’s full text.
Citations
Cites
Still being checked.
Research works printed but not linked: 40
- Squillaro, 2016, Clinical trials with mesenchymal stem cells: An update, Cell Transplant., 25, 829, 10.3727/096368915X689622 · DOI
- Sharma, 2014, Mesenchymal stem or stromal cells: A review of clinical applications and manufacturing practices, Transfusion, 54, 1418, 10.1111/trf.12421 · DOI
- Seong, J.M., Kim, B.-C., Park, J.-H., Kwon, K.I., Mantalaris, A., and Hwang, Y.-S. (2010). Stem cells in bone tissue engineering. Biomed. Mater., 5. · DOI
- Stoltz, 2012, Human stem cells and articular cartilage tissue engineering, Curr. Pharm. Biotechnol., 13, 2682, 10.2174/138920112804724846 · DOI
- Namioka, 2019, Intravenous infusion of mesenchymal stem cells promotes functional recovery in a rat model of chronic cerebral infarction, J. Neurosurg., 131, 1289, 10.3171/2018.5.JNS18140 · DOI
- Lee, 2009, Intravenous hmscs improve myocardial infarction in mice because cells embolized in lung are activated to secrete the anti-inflammatory protein TSG-6 Cell, Stem Cell, 5, 54
- Chen, 2020, Exosomes in clinical trial and their production in compliance with good manufacturing practice, Tzu. Chi. Med. J., 32, 113, 10.4236/cm.2020.113007 · DOI
- Terai, 2006, Improved liver function in patients with liver cirrhosis after autologous bone marrow cell infusion therapy, STEM CELLS, 24, 2292, 10.1634/stemcells.2005-0542 · DOI
- Tanimoto, 2013, Improvement of liver fibrosis by infusion of cultured cells derived from human bone marrow, Cell Tissue Res., 354, 717, 10.1007/s00441-013-1727-2 · DOI
- Sakaida, 2004, Transplantation of bone marrow cells reduces CCl4-induced liver fibrosis in mice, Hepatology, 40, 1304, 10.1002/hep.20452 · DOI
- Matsuda, 2017, A canine liver fibrosis model to develop a therapy for liver cirrhosis using cultured bone marrow-derived cells, Hepatol. Commun., 1, 691, 10.1002/hep4.1071 · DOI
- Nishimura, T., Takami, T., Sasaki, R., Aibe, Y., Matsuda, T., Fujisawa, K., Matsumoto, T., Yamamoto, N., Tani, K., and Taura, Y. (2019). Liver regeneration therapy through the hepatic artery-infusion of cultured bone marrow cells in a canine liver fibrosis model. PLoS ONE, 14. · DOI
- Liu, 2020, Senescence in mesenchymal stem cells: Functional alterations, molecular mechanisms, and rejuvenation strategies, Front. Cell Dev. Biol., 8, 258, 10.3389/fcell.2020.00258 · DOI
- Sidler, 2017, Epigenetic regulation of cellular senescence and aging, Front. Genet., 8, 138, 10.3389/fgene.2017.00138 · DOI
- Hussain, 2022, The role of epigenetic in dental and oral regenerative medicine by different types of dental stem cells: A comprehensive overview, Stem Cells Int., 2022, 5304860, 10.1155/2022/5304860 · DOI
- Wang, 2020, Epigenetic regulation in mesenchymal stem cell aging and differentiation and osteoporosis, Stem Cells Int., 2020, 8836258, 10.1155/2020/8836258 · DOI
- Bieback, 2008, Clinical protocols for the isolation and expansion of mesenchymal stromal cells, Transfus. Med. Hemotherapy, 35, 4, 10.1159/000141567 · DOI
- Zahedi, 2018, Equine bone marrow-derived mesenchymal stem cells: Optimization of cell density in primary culture, Stem Cell Investig., 5, 31, 10.21037/sci.2018.09.01 · DOI
- Sotiropoulou, 2005, Characterization of the optimal culture conditions for clinical scale production of human mesenchymal stem cells, Stem Cells, 24, 462, 10.1634/stemcells.2004-0331 · DOI
- Pittenger, 1999, Multilineage potential of adult human mesenchymal stem cells, Science, 284, 143, 10.1126/science.284.5411.143 · DOI · Paper page
- Fuhrmann, 2015, The cytoskeleton regulates cell attachment strength, Biophys. J., 109, 57, 10.1016/j.bpj.2015.06.003 · DOI
- Cho, 2004, Morphological adjustment of senescent cells by modulating caveolin-1 status, J. Biol. Chem., 279, 42270, 10.1074/jbc.M402352200 · DOI
- Sarugaser, R., Hanoun, L., Keating, A., Stanford, W.L., and Davies, J.E. (2009). Human mesenchymal stem cells self-renew and differentiate according to a deterministic hierarchy. PLoS ONE, 4. · DOI
- Marceau, 2015, Human bone marrow stromal cell confluence: Effects on cell characteristics and methods of assessment, Cytotherapy, 57, 742
- Nakamura, 2019, Initial cell plating density affects properties of human primary synovial mesenchymal stem cells, J. Orthop. Res., 37, 1358, 10.1002/jor.24112 · DOI
- Mabuchi, 2013, LNGFR+THY-1 + VCAM-1hi + cells reveal functionally distinct subpopulations in mesenchymal stem cells, Stem Cell Rep., 1, 152, 10.1016/j.stemcr.2013.06.001 · DOI
- Mizuno, 2019, Time-lapse image analysis for whole colony growth curves and daily distribution of the cell number per colony during the expansion of mesenchymal stem cells, Sci. Rep., 9, 16835, 10.1038/s41598-019-53383-z · DOI
- Owens, 1974, Epithelial cell cultures from normal glandular tissue of mice, J. Natl. Cancer Inst., 53, 261, 10.1093/jnci/53.1.261 · DOI
- Tarifa, 2016, Low adherent cancer cell subpopulations are enriched in tumorigenic and metastatic epithelial-to-mesenchymal transition-induced cancer stem-like cells, Sci. Rep., 6, srep18772, 10.1038/srep18772 · DOI
- Segawa, 2009, Mesenchymal stem cells derived from synovium, meniscus, anterior cruciate ligament, and articular chondrocytes share similar gene expression profiles, J. Orthop. Res., 27, 435, 10.1002/jor.20786 · DOI
- Rennerfeldt, 2016, Concise review: When colonies are not clones: Evidence and implications of intracolony heterogeneity in mesenchymal stem cells, Stem Cells, 34, 1135, 10.1002/stem.2296 · DOI
- Bruedigam, 2010, A new concept underlying stem cell lineage skewing that explains the detrimental effects of thiazolidinediones on bone, Stem Cells, 28, 916, 10.1002/stem.405 · DOI
- Gnani, 2019, An early-senescence state in aged mesenchymal stromal cells contributes to hematopoietic stem and progenitor cell clonogenic impairment through the activation of a pro-inflammatory program, Aging Cell, 18, e12933, 10.1111/acel.12933 · DOI · Paper page
- Ulrich, 2020, An evaluation of T-cell functionality after flow cytometry sorting revealed p38 MAPK activation, Cytom. Part A, 97, 171, 10.1002/cyto.a.23964 · DOI
- Ryan, 2021, Sheath fluid impacts the depletion of cellular metabolites in cells afflicted by sorting induced cellular stress (SICS), Cytom. Part A, 99, 921, 10.1002/cyto.a.24361 · DOI
- Pfister, 2020, An evaluation of sorter induced cell stress (SICS) on peripheral blood mononuclear cells (PBMCs) after different sort conditions—Are your sorted cells getting SICS?, J. Immunol. Methods, 487, 112902, 10.1016/j.jim.2020.112902 · DOI
- Kim, 2020, Culturing at low cell density delays cellular senescence of human bone marrow-derived mesenchymal stem cells in long-term cultures, Int. J. Stem Cells, 14, 103, 10.15283/ijsc20078 · DOI
- Harada, 2020, FZD5 regulates cellular senescence in human mesenchymal stem/stromal cells, Stem Cells, 39, 318, 10.1002/stem.3317 · DOI
- Tushinski, 1982, Survival of mononuclear phagocytes depends on a lineage-specific growth factor that the differentiated cells selectively destroy, Cell, 28, 71, 10.1016/0092-8674(82)90376-2 · DOI
- Takizawa, 2017, Bone marrow-derived mesenchymal stem cells propagate immunosuppressive/anti-inflammatory macrophages in cell-to-cell contact-independent and dependent manners under hypoxic culture, Exp. Cell Res., 358, 411, 10.1016/j.yexcr.2017.07.014 · DOI
Cited by
Sorted by citations
Pan, X., Gao, T., & Wang, B. (2025) · Cell & Bioscience · doi:10.1186/s13578-025-01520-9 · Cited by 2
“…cell seeding density is also critical for the culture of MSCs. Inappropriate seeding densities, whether excessively high causing rapid passaging or too low pro-longing culture, can impair MSC proliferation and differentiation, potentially triggering senescence or genetic instability [327, 328].”
Suali, L., Chia, Y., Rustin, C., Lem, F. F., Ching, X. J., Mansur, M. A. B., Henry, Z. A., Chan, M. K. S., Wong, M. B. F., & Pan, S. Y. (2026) · Biotechnic & Histochemistry · doi:10.1080/10520295.2026.2714776 · Cited by 2
“…donor selection (Carp and Liang 2022; Maged et al. 2024), pooled-donor approaches (Kannan et al. 2024), and standardized culture protocols (Nagai et al. 2023), have improved the reproducibility, functional stability, and scalability of primary cells, yet their integration into…”
Metadata
- Authors
- Nagai, H., Miwa, A., Yoneda, K., Fujisawa, K., & Takami, T.
- Affiliations
- Yamaguchi University (JP)
- Shibuya (Japan) (JP)
- Corresponding author
- Takami, Taro
- Venue
- Bioengineering
- Publisher
- MDPI AG
- Published
- 2023-01-11
- Volume
- 10
- Issue
- 1
- Pages
- 102
- ISSN
- 2306-5354 (ISSN-L)
- PMC
- PMC9855129
- OpenAlex
- W4315795778
- Cited by
- 9
- References
- 0
- Citations by year
- 2026: 4 · 2025: 2 · 2024: 2 · 2023: 1
- FWCI
- 1.56
- Type
- journal article
- Language
- en
- Open access
- gold
- doi.org
- Licence
- Locations
- Bioengineering (publishedVersion, cc-by)
- PubMed Central (publishedVersion, cc-by)
- PubMed (publishedVersion)
- DOAJ (DOAJ: Directory of Open Access Journals) (submittedVersion, cc-by-sa)
- Funders
- Shibuya Corporation
- Topics
- Life Sciences › Biochemistry, Genetics and Molecular Biology › Cell Biology › Mesenchymal stem cell research
- Health Sciences › Medicine › Hematology › Hematopoietic Stem Cell Transplantation
- Health Sciences › Dentistry › Periodontics › Periodontal Regeneration and Treatments
- Keywords
- mesenchymal stem cells, seeding rate, mononuclear cells, bone marrow, colony formation, cell proliferation, senescence, adipogenesis, chondrogenic differentiation, osteogenic differentiation, cell purity
About these checks
Registry, retraction, Cites and statistics results are computed, not judged, with one exception: a printed reference that no index lists is read once by a model before it counts as a citation error. Claims are extracted by a model and kept only when their quote appears verbatim in the text; each cited source is then checked, with a model’s help, for whether it says what the claim relies on. Those verdicts can be wrong — read the claim’s quote and the cited source before relying on one.
Statistics and arithmetic are recomputed, not judged.
Confidence bands are shown only for fields calibrated on our annotated test set. None is calibrated yet, so no band is shown.
What counts as a claim ›How we measure confidence ›How we check this ›
Are you an author, or do you see a problem with this page? Request a review
