

The DOI matches its Crossref record; 3 of the 3 references it cites were found in a registry or an index.
TAFPred: Torsion Angle Fluctuations Prediction from Protein Sequences
Open accessPublished version of a preprint
Abstract
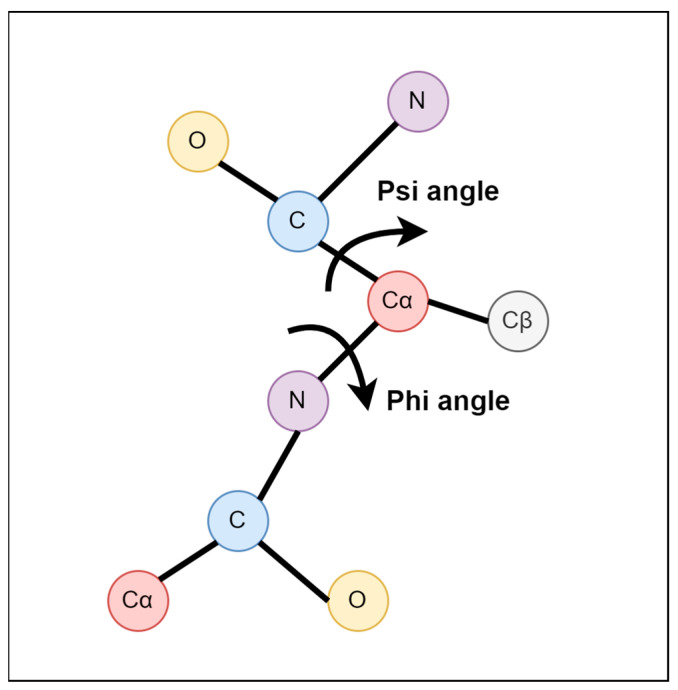
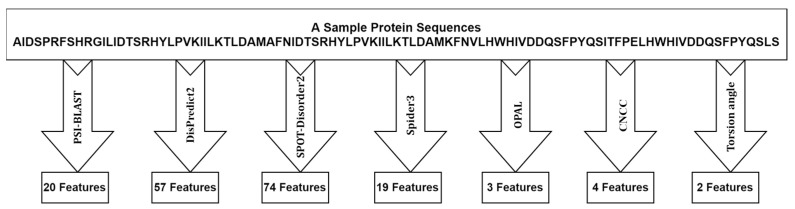
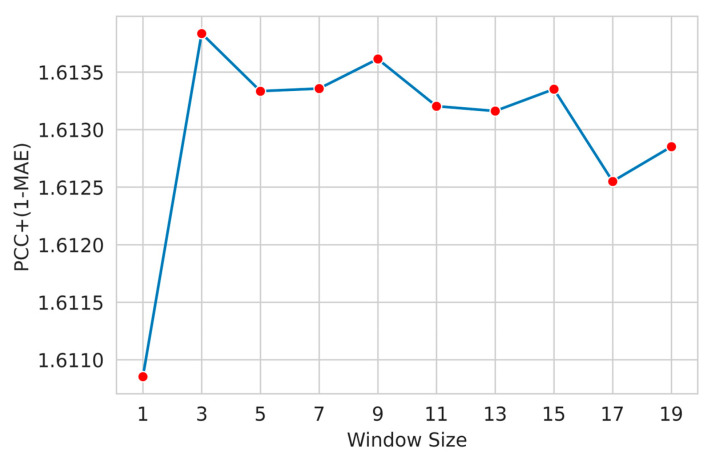
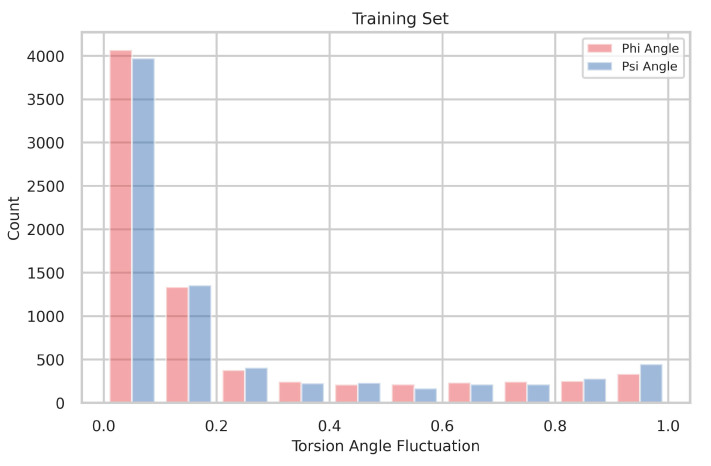
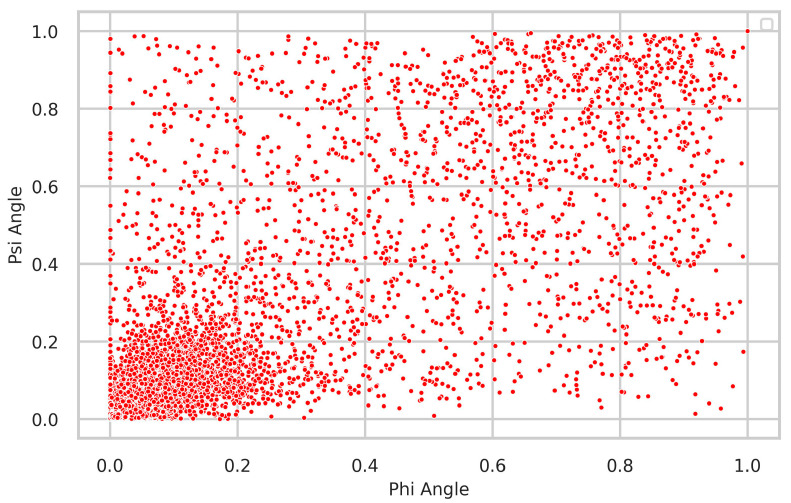
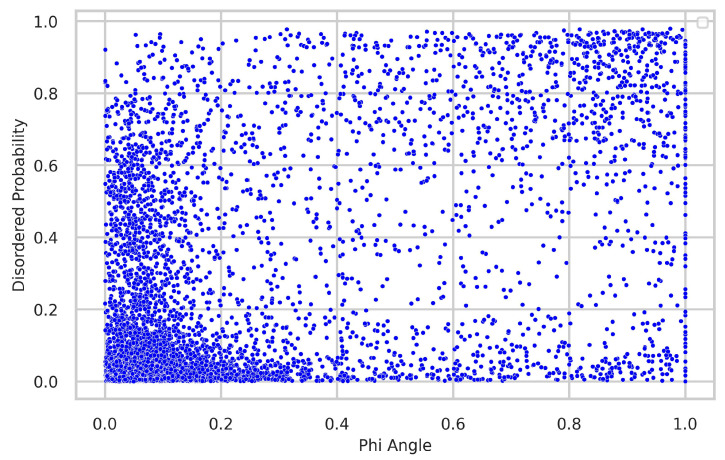
Protein molecules show varying degrees of flexibility throughout their three-dimensional structures. The flexibility is determined by the fluctuations in torsion angles, specifically phi (φ) and psi (ψ), which define the protein backbone. These angle fluctuations are derived from variations in backbone torsion angles observed in different models. By analyzing the fluctuations in Cartesian coordinate space, we can understand the structural flexibility of proteins. Predicting torsion angle fluctuations is valuable for determining protein function and structure when these angles act as constraints. In this study, a machine learning method called TAFPred is developed to predict torsion angle fluctuations using protein sequences directly. The method incorporates various features, such as disorder probability, position-specific scoring matrix profiles, secondary structure probabilities, and more. TAFPred, employing an optimized Light Gradient Boosting Machine Regressor (LightGBM), achieved high accuracy with correlation coefficients of 0.746 and 0.737 and mean absolute errors of 0.114 and 0.123 for the φ and ψ angles, respectively. Compared to the state-of-the-art method, TAFPred demonstrated significant improvements of 10.08% in MAE and 24.83% in PCC for the phi angle and 9.93% in MAE, and 22.37% in PCC for the psi angle.
Overview
The claims and statistics of this paper haven’t been checked yet.
Run the check — free, no account needed. It reads the open-access text and checks the sources it cites.
Integrity signals
Registry
Cites
Statistics
Figures
Verification
Claims the paper makes
The claims and statistics of this paper haven’t been checked yet.
Run the check — free, no account needed. It reads the open-access text and checks the sources it cites.
Self-check
Percentages, sums and reported differences re-computed from the paper’s own numbers.
The self-check needs the paper’s full text.
Citations
Cites
Highly accurate protein structure prediction with AlphaFold
Jumper, J., Evans, R., Pritzel, A., Green, T., Figurnov, M., Ronneberger, O., Tunyasuvunakool, K., Bates, R., Žídek, A., Potapenko, A., et al. (2021) · Nature · doi:10.1038/s41586-021-03819-2 · Cited by 43,764
Advances in protein structure prediction and design
Kuhlman, B., & Bradley, P. (2019) · Nature Reviews Molecular Cell Biology · doi:10.1038/s41580-019-0163-x · Cited by 806
AlphaFold heralds a data-driven revolution in biology and medicine
Thornton, J. M., Laskowski, R. A., & Borkakoti, N. (2021) · Nature Medicine · doi:10.1038/s41591-021-01533-0 · Cited by 185
Research works printed but not linked: 50
- Cornell, 1995, A second generation force field for the simulation of proteins, nucleic acids, and organic molecules, J. Am. Chem. Soc., 117, 5179, 10.1021/ja00124a002 · DOI
- Tompa, 2002, Intrinsically unstructured proteins, Trends Biol. Sci., 27, 527, 10.1016/S0968-0004(02)02169-2 · DOI
- Jonsson, 2017, Essential chemistry for biochemists, Essays Biochem., 61, 401, 10.1042/EBC20160094 · DOI
- Kulmanov, 2020, DeepGOPlus: Improved protein function prediction from sequence, Bioinformatics, 36, 422, 10.1093/bioinformatics/btz595 · DOI
- Nechab, 2014, 1,n-Hydrogen-Atom Transfer (HAT) Reactions in Which n≠ 5: An Updated Inventory, Chemistry, 20, 16034, 10.1002/chem.201403951 · DOI
- Wright, 1999, Intrinsically unstructured proteins: Re-assessing the protein structure-function paradigm, J. Mol. Biol., 293, 321, 10.1006/jmbi.1999.3110 · DOI · Paper page
- Quiocho, 1986, Carbohydrate-binding proteins: Tertiary structures and protein-sugar interactions, Annu. Rev. Biochem., 55, 287, 10.1146/annurev.bi.55.070186.001443 · DOI
- Mosimann, 1995, A critical assessment of comparative molecular modeling of tertiary structures of proteins, Proteins Struct. Funct. Bioinform., 23, 301, 10.1002/prot.340230305 · DOI
- Gao, J., Yang, Y., and Zhou, Y. (2018). Grid-based prediction of torsion angle probabilities of protein backbone and its application to discrimination of protein intrinsic disorder regions and selection of model structures. BMC Bioinform., 19. · DOI
- Heffernan, 2017, Capturing non-local interactions by long short-term memory bidirectional recurrent neural networks for improving prediction of protein secondary structure, backbone angles, contact numbers and solvent accessibility, Bioinformatics, 33, 2842, 10.1093/bioinformatics/btx218 · DOI
- Lyons, 2014, Predicting backbone Cα angles and dihedrals from protein sequences by stacked sparse auto-encoder deep neural network, J. Comput. Chem., 35, 2040, 10.1002/jcc.23718 · DOI
- Iqbal, S., and Hoque, M.T. (2015). DisPredict: A Predictor of Disordered Protein Using Optimized RBF Kernel. PLoS ONE, 10. · DOI
- Konrat, 2014, NMR contributions to structural dynamics studies of intrinsically disordered proteins, J. Magn. Reson., 241, 74, 10.1016/j.jmr.2013.11.011 · DOI
- Hu, 2021, flDPnn: Accurate intrinsic disorder prediction with putative propensities of disorder functions, Nat. Commun., 12, 4438, 10.1038/s41467-021-24773-7 · DOI
- Zhang, 2010, Fluctuations of backbone torsion angles obtained from NMR-determined structures and their prediction, Proteins, 78, 3353, 10.1002/prot.22842 · DOI
- Babu, 2011, Intrinsically disordered proteins: Regulation and disease, Curr. Opin. Struct. Biol., 21, 432, 10.1016/j.sbi.2011.03.011 · DOI
- Uversky, 2008, Intrinsically Disordered Proteins in Human Diseases: Introducing the D2 Concept, Annu. Rev. Biophys., 37, 215, 10.1146/annurev.biophys.37.032807.125924 · DOI
- Krishnan, 2022, De Novo Structure-Based Drug Design Using Deep Learning, J. Chem. Inf. Model., 62, 5100, 10.1021/acs.jcim.1c01319 · DOI
- Bulacu, 2013, Improved Angle Potentials for Coarse-Grained Molecular Dynamics Simulations, J. Chem. Theory Comput., 9, 3282, 10.1021/ct400219n · DOI
- Yee, 2005, NMR and X-ray Crystallography, Complementary Tools in Structural Proteomics of Small Proteins, J. Am. Chem. Soc., 127, 16512, 10.1021/ja053565+ · DOI
- Bryant, 1983, The NMR time scale, J. Chem. Educ., 60, 933, 10.1021/ed060p933 · DOI
- Schnapka, 2022, NMR Provides Unique Insight into the Functional Dynamics and Interactions of Intrinsically Disordered Proteins, Chem. Rev., 122, 9331, 10.1021/acs.chemrev.1c01023 · DOI
- Adamski, 2019, A Unified Description of Intrinsically Disordered Protein Dynamics under Physiological Conditions Using NMR Spectroscopy, J. Am. Chem. Soc., 141, 17817, 10.1021/jacs.9b09002 · DOI
- Kosol, 2013, Structural characterization of intrinsically disordered proteins by NMR spectroscopy, Molecules, 18, 10802, 10.3390/molecules180910802 · DOI
- Graether, 2019, Troubleshooting Guide to Expressing Intrinsically Disordered Proteins for Use in NMR Experiments, Front. Mol. Biosci., 5, 118, 10.3389/fmolb.2018.00118 · DOI
- Yang, 2011, Improving protein fold recognition and template-based modeling by employing probabilistic-based matching between predicted one-dimensional structural properties of query and corresponding native properties of templates, Bioinformatics, 27, 2076, 10.1093/bioinformatics/btr350 · DOI
- Karchin, 2003, Hidden Markov models that use predicted local structure for fold recognition: Alphabets of backbone geometry, Proteins Struct. Funct. Bioinform., 51, 504, 10.1002/prot.10369 · DOI
- Rohl, C.A., Strauss, C.E., Misura, K.M., and Baker, D. (2004). Methods in Enzymology, Elsevier.
- Faraggi, 2009, Predicting continuous local structure and the effect of its substitution for secondary structure in fragment-free protein structure prediction, Structure, 17, 1515, 10.1016/j.str.2009.09.006 · DOI
- Wu, S., and and Zhang, Y. (2008). ANGLOR: A composite machine-learning algorithm for protein backbone torsion angle prediction. PLoS ONE, 3. · DOI
- Yang, 2018, Sixty-five years of the long march in protein secondary structure prediction: The final stretch?, Brief. Bioinform., 19, 482
- Li, H., Hou, J., Adhikari, B., Lyu, Q., and Cheng, J. (2017). Deep learning methods for protein torsion angle prediction. BMC Bioinform., 18. · DOI
- Wu, R., Ding, F., Wang, R., Shen, R., Zhang, X., Luo, S., Su, C., Wu, Z., Xie, Q., and Berger, B. (2022). High-resolution de novo structure prediction from primary sequence. bioRxiv. · DOI · Paper page
- Lin, Z., Akin, H., Rao, R., Hie, B., Zhu, Z., Lu, W., dos Santos Costa, A., Fazel-Zarandi, M., Sercu, T., and Candido, S. (2022). Language models of protein sequences at the scale of evolution enable accurate structure prediction. bioRxiv.
- Kabir, M.W.U., Alawad, D.M., Mishra, A., and Hoque, M.T. (2023, January 29–31). Prediction of Phi and Psi Angle Fluctuations from Protein Sequences. Proceedings of the 20th IEEE Conference on Computational Intelligence in Bioinformatics and Computational Biology, Eindhoven, The Netherlands. · DOI · Paper page
- Iqbal, 2015, Improved Prediction of Accessible Surface Area Results in Efficient Energy Function Application, J. Theor. Biol., 380, 380, 10.1016/j.jtbi.2015.06.012 · DOI
- Iqbal, 2018, PBRpredict-Suite: A suite of models to predict peptide-recognition domain residues from protein sequence, Bioinformatics, 34, 3289, 10.1093/bioinformatics/bty352 · DOI
- Iqbal, S., and Hoque, M.T. (2016). Estimation of position specific energy as a feature of protein residues from sequence alone for structural classification. PLoS ONE, 11. · DOI
- Zhu, 2010, Improving the accuracy of predicting disulfide connectivity by feature selection, Comput. Chem., 31, 1478, 10.1002/jcc.21433 · DOI
- Islam, 2016, A balanced secondary structure predictor, J. Theor. Biol., 389, 60, 10.1016/j.jtbi.2015.10.015 · DOI
- Liu, 2002, Loopy proteins appear conserved in evolution, J. Mol. Biol., 322, 53, 10.1016/S0022-2836(02)00736-2 · DOI
- Ke, G., Meng, Q., Finley, T., Wang, T., Chen, W., Ma, W., Ye, Q., and Liu, T.-Y. (2017, January 4–9). LightGBM: A highly efficient gradient boosting decision tree. Proceedings of the 31st International Conference on Neural Information Processing Systems, Long Beach, CA, USA.
- Chen, T., and Guestrin, C. (2016, January 13–17). XGBoost: A scalable tree boosting system. Proceedings of the 22nd ACM SIGKDD International Conference on Knowledge Discovery and Data Mining (ACM, 2016), San Francisco, CA, USA. · DOI · Paper page
- Geurts, 2006, Extremely randomized trees, Mach. Learn., 63, 3, 10.1007/s10994-006-6226-1 · DOI · Paper page
- Hastie, T., Tibshirani, R., and Friedman, J. (2009). The Elements of Statistical Learning, Springer. [2nd ed.]. · DOI · Paper page
- Altman, 1992, An Introduction to Kernel and Nearest-Neighbor Nonparametric Regression, Am. Stat., 46, 175, 10.1080/00031305.1992.10475879 · DOI
- Arik, S.O., and Pfister, T. (2019). TabNet: Attentive Interpretable Tabular Learning. arXiv.
- Hoque, 2017, Genetic algorithm-based improved sampling for protein structure prediction, Int. J. Bio-Inspired Comput., 9, 129, 10.1504/IJBIC.2017.083702 · DOI
- Hoque, M.T., Chetty, M., and Sattar, A. (2007, January 25–28). Protein Folding Prediction in 3D FCC HP Lattice Model using Genetic Algorithm. Proceedings of the IEEE Congress on Evolutionary Computation (CEC), Singapore. · DOI
- Hoque, 2010, DFS Generated Pathways in GA Crossover for Protein Structure Prediction, Neurocomputing, 73, 2308, 10.1016/j.neucom.2010.02.021 · DOI
Metadata
- Authors
- Kabir, M. W. U., Alawad, D. M., Mishra, A., & Hoque, M. T.
- Affiliations
- LSU New Orleans (US)
- Texas A&M University – Kingsville (US)
- Corresponding author
- Hoque, Md Tamjidul
- Venue
- Biology
- Publisher
- MDPI AG
- Published
- 2023-07-19
- Volume
- 12
- Issue
- 7
- Pages
- 1020
- ISSN
- 2079-7737 (ISSN-L)
- PMC
- PMC10376102
- OpenAlex
- W4384929351
- Cited by
- 5
- References
- 3
- Citations by year
- 2026: 1 · 2025: 1 · 2024: 2 · 2023: 1
- FWCI
- 0.45
- Type
- journal article
- Language
- en
- Open access
- gold
- doi.org
- Licence
- Locations
- Biology (publishedVersion, cc-by)
- Preprints.org (acceptedVersion, cc-by)
- PubMed Central (publishedVersion, cc-by)
- PubMed (publishedVersion)
- DOAJ (DOAJ: Directory of Open Access Journals) (submittedVersion, cc-by-sa)
- Funders
- Department of Homeland Security (DHS) (21STSLA00011-01-0)
- Topics
- Life Sciences › Biochemistry, Genetics and Molecular Biology › Molecular Biology › Protein Structure and Dynamics
- Life Sciences › Biochemistry, Genetics and Molecular Biology › Molecular Biology › Machine Learning in Bioinformatics
- Life Sciences › Biochemistry, Genetics and Molecular Biology › Structural Biology › Enzyme Structure and Function
- Keywords
- phi and psi angles, protein flexibility, sequence-based prediction, LightGBM regression
About these checks
Registry, retraction, Cites and statistics results are computed, not judged, with one exception: a printed reference that no index lists is read once by a model before it counts as a citation error. Claims are extracted by a model and kept only when their quote appears verbatim in the text; each cited source is then checked, with a model’s help, for whether it says what the claim relies on. Those verdicts can be wrong — read the claim’s quote and the cited source before relying on one.
Statistics and arithmetic are recomputed, not judged.
Confidence bands are shown only for fields calibrated on our annotated test set. None is calibrated yet, so no band is shown.
What counts as a claim ›How we measure confidence ›How we check this ›
Are you an author, or do you see a problem with this page? Request a review
How to cite
Cite CoChat for the checks on this page, and the paper for its own findings.
- This page
- CoChat. (2026). Citation check: TAFPred: Torsion Angle Fluctuations Prediction from Protein Sequences. https://app.cochat.ai/papers/10.3390/biology12071020
- The paper
- Kabir, M. W. U., Alawad, D. M., Mishra, A., & Hoque, M. T. (2023). TAFPred: Torsion Angle Fluctuations Prediction from Protein Sequences. Biology. https://doi.org/10.3390/biology12071020
