

The DOI matches its Crossref record; 73 of the 74 references it cites were found in a registry or an index, and 1 are not checked yet.
Selective Inhibition of Deamidated Triosephosphate Isomerase by Disulfiram, Curcumin, and Sodium Dichloroacetate: Synergistic Therapeutic Strategies for T-Cell Acute Lymphoblastic Leukemia in Jurkat Cells
Open accessAbstract
T-cell acute lymphoblastic leukemia (T-ALL) is a challenging childhood cancer to treat, with limited therapeutic options and high relapse rates. This study explores deamidated triosephosphate isomerase (dTPI) as a novel therapeutic target. We hypothesized that selectively inhibiting dTPI could reduce T-ALL cell viability without affecting normal T lymphocytes. Computational modeling and recombinant enzyme assays revealed that disulfiram (DS) and curcumin (CU) selectively bind and inhibit dTPI activity without affecting the non-deamidated enzyme. At the cellular level, treatment with DS and CU significantly reduced Jurkat T-ALL cell viability and endogenous TPI enzymatic activity, with no effect on normal T lymphocytes, whereas the combination of sodium dichloroacetate (DCA) with DS or CU showed synergistic effects. Furthermore, we demonstrated that dTPI was present and accumulated only in Jurkat cells, confirming our hypothesis. Finally, flow cytometry confirmed apoptosis in Jurkat cells after treatment with DS and CU or their combination with DCA. These findings strongly suggest that targeting dTPI represents a promising and selective target for T-ALL therapy.
Overview
The claims and statistics of this paper haven’t been checked yet.
Run the check — free, no account needed. It reads the open-access text and checks the sources it cites.
Integrity signals
Registry
Cites
Statistics
Figures
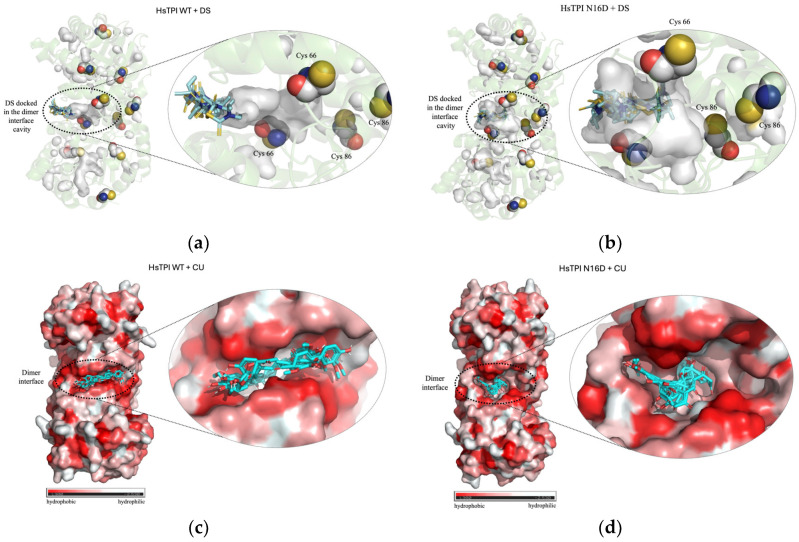
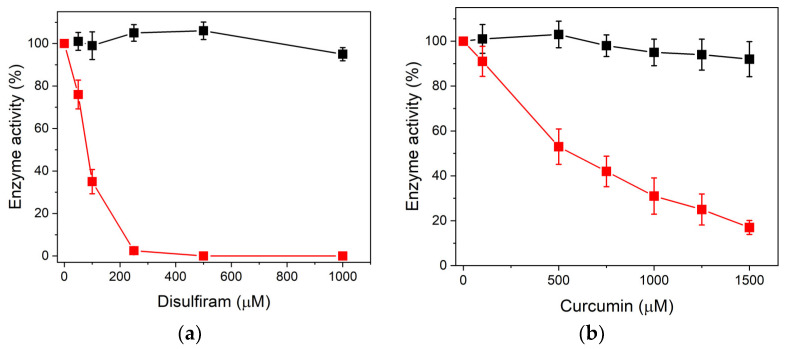
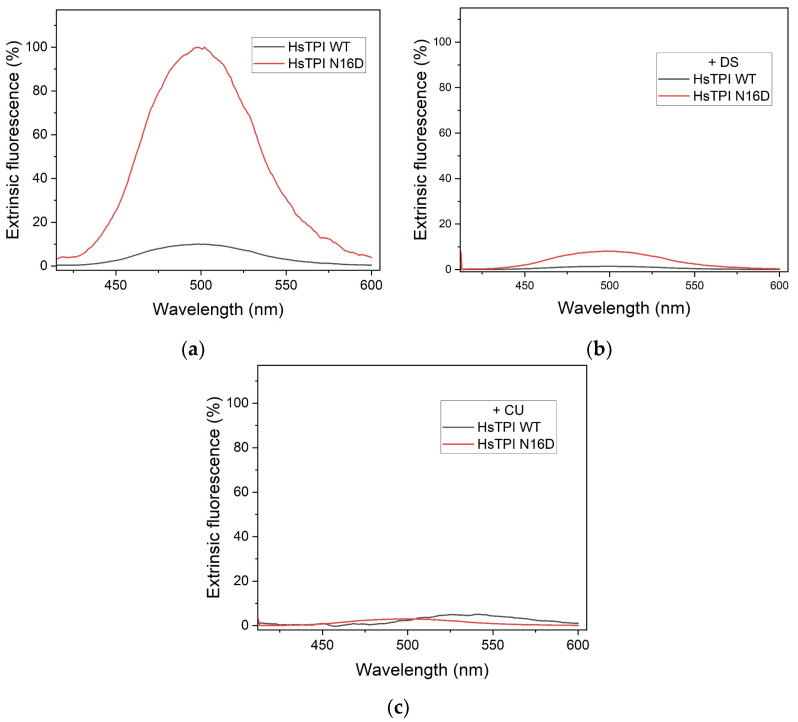
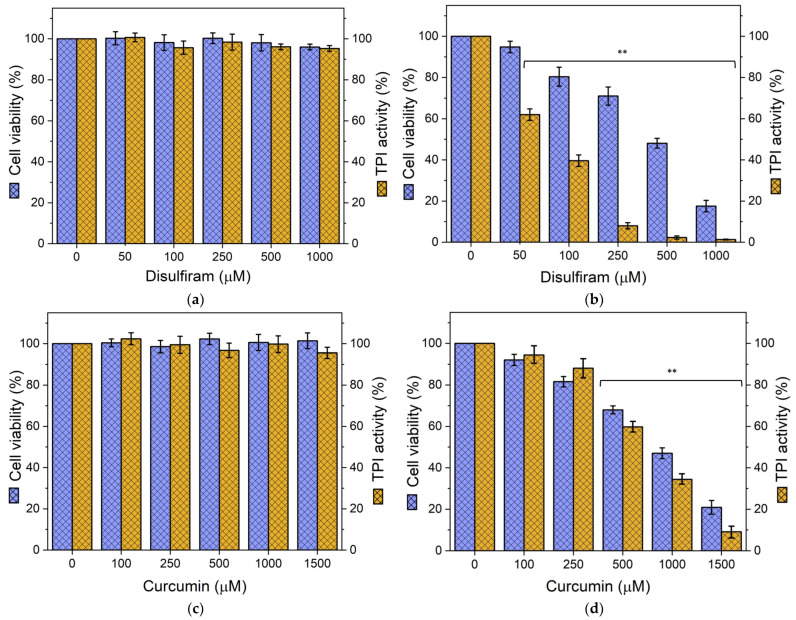
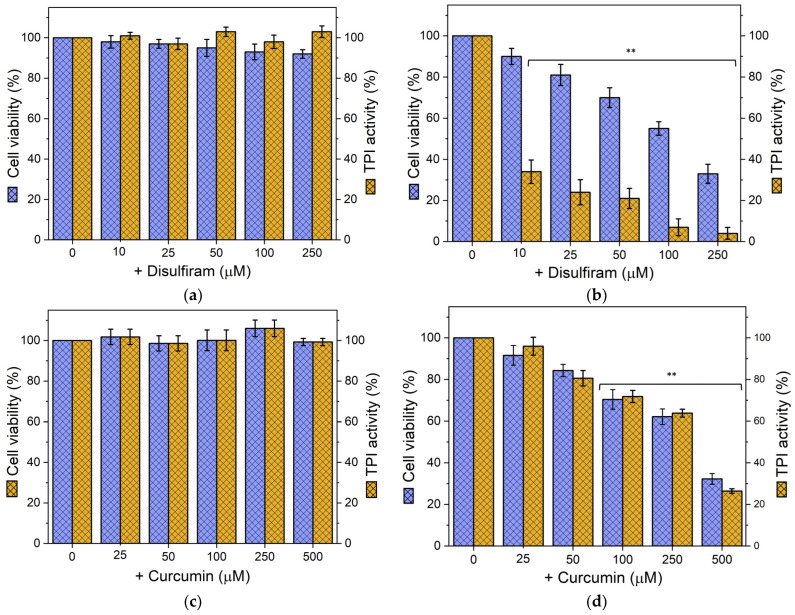
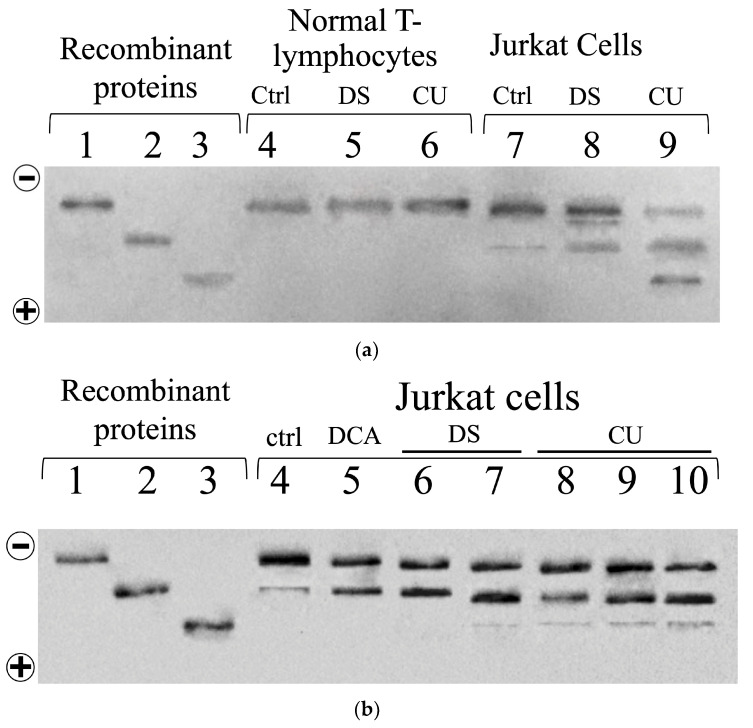
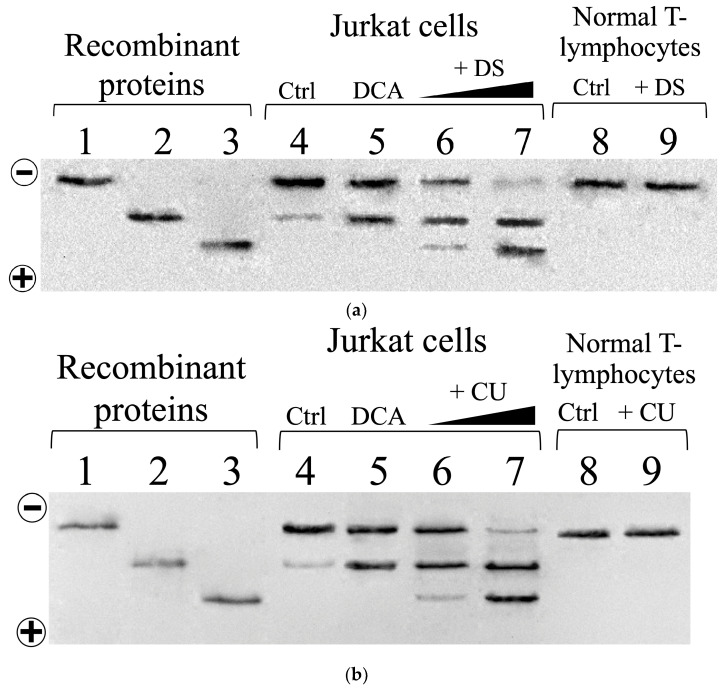
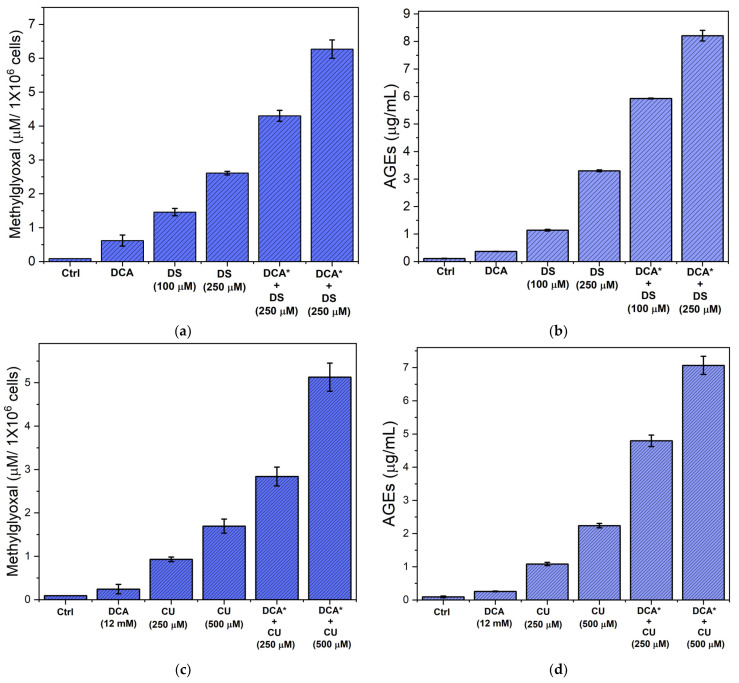
Verification
Claims the paper makes
The claims and statistics of this paper haven’t been checked yet.
Run the check — free, no account needed. It reads the open-access text and checks the sources it cites.
Claims other papers make about this one
Each is checked against this paper’s own text: does it say what the citing paper says it does?
The cited source says what the claim attributes to it.
In the citing paper
“Similarly, lysine acetyltransferase 2A (KAT2A)89 and deamidated triosephosphate isomerase (dTPI) were introduced as another target of DIS.90”
From Off-label and repurposed use of disulfiram beyond alcohol dependence: A systematic review of clinical and preclinical evidence (2026) · cites this paper as [90]
Self-check
Percentages, sums and reported differences re-computed from the paper’s own numbers.
The self-check needs the paper’s full text.
Citations
Cites
1 retracted
Sultana, S., Munir, N., Mahmood, Z., Riaz, M., Akram, M., Ребезов, М. Б., Адамбековна, К. Н., Moldabayeva, Z., Shariati, M. A., Rauf, A., et al. (2021) · Biomedicine & Pharmacotherapy · doi:10.1016/j.biopha.2020.111078 · Cited by 96
RetractedUCSF Chimera—A visualization system for exploratory research and analysis
Pettersen, E. F., Goddard, T. D., Huang, C. C., Couch, G. S., Greenblatt, D. M., Meng, E. C., & Ferrin, T. E. (2004) · Journal of Computational Chemistry · doi:10.1002/jcc.20084 · Cited by 46,061
AutoDock4 and AutoDockTools4: Automated docking with selective receptor flexibility
Morris, G. M., Huey, R., Lindstrom, W., Sanner, M. F., Belew, R. K., Goodsell, D. S., & Olson, A. J. (2009) · Journal of Computational Chemistry · doi:10.1002/jcc.21256 · Cited by 26,294
Understanding the Warburg Effect: The Metabolic Requirements of Cell Proliferation
Vander Heiden, M. G., Cantley, L. C., & Thompson, C. B. (2009) · Science · doi:10.1126/science.1160809 · Cited by 16,197
Acute lymphoblastic leukemia: a comprehensive review and 2017 update
Terwilliger, T., & Abdul‐Hay, M. (2017) · Blood Cancer Journal · doi:10.1038/bcj.2017.53 · Cited by 1,353
Sharifi‐Rad, J., Rayess, Y. E., Abi-Rizk, A., Sadaka, C., Zgheib, R., Zam, W., Sestito, S., Rapposelli, S., Neffe‐Skocińska, K., Zielińska, D., et al. (2020) · Frontiers in Pharmacology · doi:10.3389/fphar.2020.01021 · Cited by 1,164
A colorimetric method for determining low concentrations of mercaptans
Ellman, G. L. (1958) · Archives of Biochemistry and Biophysics · doi:10.1016/0003-9861(58)90014-6 · Cited by 1,094
CB-Dock: a web server for cavity detection-guided protein–ligand blind docking
Liu, Y., Grimm, M., Dai, W., Hou, M.-C., Xiao, Z. J., & Cao, Y. (2019) · Acta Pharmacologica Sinica · doi:10.1038/s41401-019-0228-6 · Cited by 927
Twarda‐Clapa, A., Olczak, A., Białkowska, A. M., & Koziołkiewicz, M. (2022) · Cells · doi:10.3390/cells11081312 · Cited by 833
Dichloroacetate (DCA) as a potential metabolic-targeting therapy for cancer
Michelakis, E. D., Webster, L., & Mackey, J. R. (2008) · British Journal of Cancer · doi:10.1038/sj.bjc.6604554 · Cited by 676
Mechanisms of Metabolic Reprogramming in Cancer Cells Supporting Enhanced Growth and Proliferation
Schiliro, C., & Firestein, B. L. (2021) · Cells · doi:10.3390/cells10051056 · Cited by 666
Schalkwijk, C., & Stehouwer, C. D. A. (2019) · Physiological Reviews · doi:10.1152/physrev.00001.2019 · Cited by 650
The formation of methylglyoxal from triose phosphates
Phillips, S. A., & Thornalley, P. J. (1993) · European Journal of Biochemistry · doi:10.1111/j.1432-1033.1993.tb17638.x · Cited by 578
Drug repurposing for cancer therapy
Xia, Y., Sun, M., Huang, H., & Jin, W.-L. (2024) · Signal Transduction and Targeted Therapy · doi:10.1038/s41392-024-01808-1 · Cited by 443
The Role of Curcumin in Cancer Treatment
Zoi, V., Galani, V., Lianos, G. D., Voulgaris, S., Kyritsis, A. P., & Alexiou, G. Α. (2021) · Biomedicines · doi:10.3390/biomedicines9091086 · Cited by 353
Dicarbonyl stress in cell and tissue dysfunction contributing to ageing and disease
Rabbani, N., & Thornalley, P. J. (2015) · Biochemical and Biophysical Research Communications · doi:10.1016/j.bbrc.2015.01.140 · Cited by 353
Comparative features and outcomes between paediatric T-cell and B-cell acute lymphoblastic leukaemia
Teachey, D. T., & Pui, C. (2019) · The Lancet Oncology · doi:10.1016/s1470-2045(19)30031-2 · Cited by 295
Kalyanaraman, B. (2017) · Redox Biology · doi:10.1016/j.redox.2017.04.018 · Cited by 254
Dichloroacetate (DCA) and Cancer: An Overview towards Clinical Applications
Tataranni, T., & Piccoli, C. (2019) · Oxidative Medicine and Cellular Longevity · doi:10.1155/2019/8201079 · Cited by 251
Spectrophotometric Determination of Protein Concentration
Grimsley, G. R., & Pace, C. N. (2003) · Current Protocols in Protein Science · doi:10.1002/0471140864.ps0301s33 · Cited by 182
Dichloroacetate induces apoptosis and cell-cycle arrest in colorectal cancer cells
Madhok, B., Yeluri, S., Perry, S., Hughes, T. A., & Jayne, D. G. (2010) · British Journal of Cancer · doi:10.1038/sj.bjc.6605701 · Cited by 180
Curcumin Inhibits Glyoxalase 1—A Possible Link to Its Anti-Inflammatory and Anti-Tumor Activity
Santel, T., Pflug, G., Hemdan, N. Y. A., Schäfer, A., Hollenbach, M., Buchold, M., Hintersdorf, A., Lindner, I., Otto, A., Bigl, M., et al. (2008) · PLoS ONE · doi:10.1371/journal.pone.0003508 · Cited by 171
pH-dependence of the triose phosphate isomerase reaction
Plaut, B., & Knowles, J. R. (1972) · Biochemical Journal · doi:10.1042/bj1290311 · Cited by 162
Treatment of HER2-overexpressing breast cancer
Baselga, J. M. (2010) · Annals of Oncology · doi:10.1093/annonc/mdq421 · Cited by 146
Sanchez, W. Y., McGee, S. L., Connor, T., Mottram, B. M., Wilkinson, A., Whitehead, J. P., Vučković, S., & Catley, L. P. (2013) · British Journal of Cancer · doi:10.1038/bjc.2013.120 · Cited by 144
Therapeutic applications of dichloroacetate and the role of glutathione transferase zeta-1
James, M. O., Jahn, S. C., Zhong, G. G., Smeltz, M. G., Hu, Z., & Stacpoole, P. W. (2016) · Pharmacology & Therapeutics · doi:10.1016/j.pharmthera.2016.10.018 · Cited by 137
Advanced glycation endproducts and their pathogenic roles in neurological disorders
Münch, G. W., Westcott, B., Menini, T., & Gugliucci, A. (2010) · Amino Acids · doi:10.1007/s00726-010-0777-y · Cited by 133
Disulfiram: Mechanisms, Applications, and Challenges
Lanz, J., Biniaz-Harris, N., Kuvaldina, M., Jain, S., Lewis, K., & Fallon, B. A. (2023) · Antibiotics · doi:10.3390/antibiotics12030524 · Cited by 129
Wang, S., Xie, J., Pei, J., & Lai, L. (2023) · Journal of Molecular Biology · doi:10.1016/j.jmb.2023.168141 · Cited by 129
Targeting FROUNT with Disulfiram Regulates Macrophage Responses in Cancer
Terashima, Y., Toda, E., Itakura, M., Otsuji, M., Yoshinaga, S., Okumura, K., Shand, F. H. W., Komohara, Y., Takeda, M., Kokubo, K., et al. (2018) · Nature Communications · doi:10.1038/s41467-020-14338-5 · Cited by 105
Structural Basis of Human Triosephosphate Isomerase Deficiency
Rodríguez-Almazán, C., Arreola, R., Rodríguez‐Larrea, D., Aguirre‐López, B., de Gómez‐Puyou, M. T., Pérez‐Montfort, R., Costas, M., Gómez‐Puyou, A., & Torres‐Larios, A. (2008) · Journal of Biological Chemistry · doi:10.1074/jbc.m802145200 · Cited by 94
Ahmad, I., Hoque, M., Alam, S. S. M., Zughaibi, T. A., & Tabrez, S. S. M. (2023) · International Journal of Molecular Sciences · doi:10.3390/ijms24076651 · Cited by 92
Current Findings and Mechanisms of Action of Disulfiram in the Treatment of Alcohol Dependence
Mutschler, J., Grosshans, M., Soyka, M., & Rösner, S. (2016) · Pharmacopsychiatry · doi:10.1055/s-0042-103592 · Cited by 91
Molecular basis for the accumulation of acidic isozymes of triosephosphate isomerase on aging
Yuan, P. M., Talent, J. M., & Gracy, R. W. (1981) · Mechanisms of Ageing and Development · doi:10.1016/0047-6374(81)90081-6 · Cited by 91
Nokin, M., Durieux, F., Bellier, J., Peulen, O., Uchida, K., Spiegel, D. A., Cochrane, J. R., Hutton, C. A., Castronovo, V., & Bellahcène, A. (2017) · Scientific Reports · doi:10.1038/s41598-017-12119-7 · Cited by 88
Advances in B‐cell Precursor Acute Lymphoblastic Leukemia Genomics
Schwab, C. J., & Harrison, C. J. (2018) · HemaSphere · doi:10.1097/hs9.0000000000000053 · Cited by 86
Téllez‐Valencia, A., Olivares‐Illana, V., Hernández‐Santoyo, A., Pérez‐Montfort, R., Costas, M., Rodríguez‐Romero, A., López‐Calahorra, F., de Gómez‐Puyou, M. T., & Gómez‐Puyou, A. (2004) · Journal of Molecular Biology · doi:10.1016/j.jmb.2004.06.056 · Cited by 75
Autophagy in cancer resistance to paclitaxel: Development of combination strategies
Škubník, J., Pavlíčková, V. S., Ruml, T., & Rimpelová, S. (2023) · Biomedicine & Pharmacotherapy · doi:10.1016/j.biopha.2023.114458 · Cited by 70
Guo, Y., Zhang, Y., Yang, X., Lu, P., Yan, X., Xiao, F., Zhou, H., Wen, C., Shi, M., Lü, J., et al. (2015) · Cancer Biology & Therapy · doi:10.1080/15384047.2015.1121346 · Cited by 67
Tufvesson, E., & Westergren‐Thorsson, G. (2000) · Journal of Cellular Biochemistry · doi:10.1002/(sici)1097-4644(20000501)77:2 · Cited by 65
Disulfiram blocks inflammatory TLR4 signaling by targeting MD-2
Bai, Y., Min, R., Chen, P., Mei, S., Deng, F., Zheng, Z., Jiang, C., Miao, R., Wu, Z., Zhang, P., et al. (2023) · Proceedings of the National Academy of Sciences · doi:10.1073/pnas.2306399120 · Cited by 64
Treatment of Pediatric Acute Lymphoblastic Leukemia: A Historical Perspective
Hayashi, H., Makimoto, A., & Yuza, Y. (2024) · Cancers · doi:10.3390/cancers16040723 · Cited by 61
Combination of Sulindac and Dichloroacetate Kills Cancer Cells via Oxidative Damage
Ayyanathan, K., Kesaraju, S., Dawson-Scully, K. D., & Weissbach, H. (2012) · PLoS ONE · doi:10.1371/journal.pone.0039949 · Cited by 60
The Dual-Role of Methylglyoxal in Tumor Progression – Novel Therapeutic Approaches
Leone, A., Nigro, C., Nicolò, A., Prevenzano, I., Formisano, P., Bèguinot, F., & Miele, C. (2021) · Frontiers in Oncology · doi:10.3389/fonc.2021.645686 · Cited by 59
Spectrophotometric determination of methyl glyoxal with 2,4-dinitrophenylhydrazine
Gilbert, R. P., & Brandt, R. B. (1975) · Analytical Chemistry · doi:10.1021/ac60364a003 · Cited by 57
Up-regulation of key glycolysis proteins in cancer development
Nowak, N., Kulma, A., & Gutowicz, J. (2018) · Open Life Sciences · doi:10.1515/biol-2018-0068 · Cited by 56
Disulfiram as a Therapeutic Agent for Metastatic Malignant Melanoma—Old Myth or New Logos?
Meraz-Torres, F., Plöger, S., Garbe, C., Niessner, H., & Sinnberg, T. W. (2020) · Cancers · doi:10.3390/cancers12123538 · Cited by 51
Vemuri, S. K., Halder, S., Banala, R. R., Rachamalla, H. K., Devraj, V. M., Mallarpu, C. S., Neerudu, U. K., Bodlapati, R., Mukherjee, S., Venkata, S. G. P., et al. (2022) · International Journal of Molecular Sciences · doi:10.3390/ijms23042150 · Cited by 43
Cai, Q., Sun, Z., Xu, S., Jiao, X., Guo, S., Li, Y., Wu, H. G., & Yu, X. (2022) · Renal Failure · doi:10.1080/0886022x.2022.2098764 · Cited by 41
Zhou, L., Liu, L., Chai, W., Zhao, T., Jin, X., Guo, X., Han, L., & Yuan, C. (2019) · OncoTargets and Therapy · doi:10.2147/ott.s194329 · Cited by 39
Therapeutic Targeting of Cancer Metabolism with Triosephosphate Isomerase
Pekel, G., & Arı, F. (2020) · Chemistry & Biodiversity · doi:10.1002/cbdv.202000012 · Cited by 38
Vogel, C. L., Cobleigh, M., Tripathy, D., Gutheil, J. C., Harris, L. N., Fehrenbacher, L., Slamon, D. J., Murphy, M., Novotny, W. F., Burchmore, M., et al. (2023) · Journal of Clinical Oncology · doi:10.1200/jco.22.02516 · Cited by 38
Hipkiss, A. R. (2011) · Ageing Research Reviews · doi:10.1016/j.arr.2011.05.003 · Cited by 37
Editorial: Altered Expression of Proteins in Cancer: Function and Potential Therapeutic Targets
Pessoa, J., Martins, M., Casimiro, S., Pérez‐Plasencia, C., & Shoshan‐Barmatz, V. (2022) · Frontiers in Oncology · doi:10.3389/fonc.2022.949139 · Cited by 37
Pérez‐Montfort, R., Garza‐Ramos, G., Hernández‐Alcántara, G., Reyes‐Vivas, H., Gao, X., Maldonado, E., de Gómez‐Puyou, M. T., & Gómez‐Puyou, A. (1999) · Biochemistry · doi:10.1021/bi982425s · Cited by 35
Self-citationNative top-down proteomics enables discovery in endocrine resistant breast cancer
Gomes, F. P., Durbin, K. R., Schauer, K. L., Nwachukwu, J., Kobylski, R. R., Njeri, J., Seath, C. P., Saviola, A. J., McClatchy, D. B., Diedrich, J. K., et al. (2025) · Nature Chemical Biology · doi:10.1038/s41589-025-01866-8 · Cited by 34
Loureiro, R., Novais, S. M., Mesquita, K. A., Baldeiras, I., Sousa, I., Tavares, L. C., Barbosa, I. A., Oliveira, P. J., & Vega‐Naredo, I. (2015) · Oncotarget · doi:10.18632/oncotarget.4012 · Cited by 32
Mechanism of zinc ejection by disulfiram in nonstructural protein 5A
Rehman, A. U., Zhen, G., Zhong, B., Ni, D., Li, J., Nasır, A., Gabr, M. T., Rafiq, H., Wadood, A., Lu, S., et al. (2021) · Physical Chemistry Chemical Physics · doi:10.1039/d0cp06360f · Cited by 32
Yoshino, H., Yamada, Y., Enokida, H., Osako, Y., Tsuruda, M., Kuroshima, K., Sakaguchi, T., Sugita, S., Tatarano, S., & Nakagawa, M. (2020) · PLoS ONE · doi:10.1371/journal.pone.0236119 · Cited by 30
In vitro cytotoxicity of combinations of dichloroacetate with anticancer platinum compounds
Hamilton (2010) · Clinical Pharmacology Advances and Applications · doi:10.2147/cpaa.s11795 · Cited by 30
la Mora, I. D. L. M.-D., Torres‐Larios, A., Enríquez‐Flores, S., Méndez, S. T., Castillo‐Villanueva, A., Gómez‐Manzo, S., López‐Velázquez, G., Marcial‐Quino, J., Torres‐Arroyo, A., García‐Torres, I., et al. (2015) · PLoS ONE · doi:10.1371/journal.pone.0123379 · Cited by 29
Self-citationHernández‐Alcántara, G., Torres‐Larios, A., Enríquez‐Flores, S., García‐Torres, I., Castillo‐Villanueva, A., Méndez, S. T., la Mora, I. D. L. M.-D., Gómez‐Manzo, S., Torres‐Arroyo, A., López‐Velázquez, G., et al. (2013) · PLoS ONE · doi:10.1371/journal.pone.0069031 · Cited by 27
Self-citationChen, Y., Fang, L., Zhang, J., Li, G., Ma, M., Li, C., Lyu, J., & Meng, Q. H. (2017) · International Journal of Molecular Sciences · doi:10.3390/ijms18030570 · Cited by 26
Insights on Metabolic Reprogramming and Its Therapeutic Potential in Acute Leukemia
Martino, L. D., Tosello, V., Peroni, E., & Piovan, E. (2021) · International Journal of Molecular Sciences · doi:10.3390/ijms22168738 · Cited by 25
Stander, X. X., Stander, B. A., & Joubert, A. M. (2015) · Cellular Physiology and Biochemistry · doi:10.1159/000369710 · Cited by 23
Korsakova, L., Kraśko, J. A., & Stankevıčıus, E. (2021) · In Vivo · doi:10.21873/invivo.12265 · Cited by 22
Nasrollahzadeh, A., Momeny, M., Fasehee, H., Yaghmaie, M., Bashash, D., Hassani, S., Mousavi, S. A., & Ghaffari, S. H. (2021) · Biochimica et Biophysica Acta (BBA) - Molecular Cell Research · doi:10.1016/j.bbamcr.2021.119087 · Cited by 20
(2022) · PubMed Central · Cited by 17
Biophysical analysis of interaction between curcumin and alpha-2-macroglobulin
Ali, S. S., Zia, M. K., Siddiqui, T., Ahsan, H., & Khan, F. H. (2019) · International Journal of Biological Macromolecules · doi:10.1016/j.ijbiomac.2019.01.136 · Cited by 16
Enríquez‐Flores, S., Flores-López, L. A., la Mora, I. D. L. M.-D., García‐Torres, I., Gracia‐Mora, I., Gutiérrez‐Castrellón, P., Fernández‐Lainez, C., Martínez-Pérez, Y., Olaya‐Vargas, A., de Vos, P., et al. (2022) · Scientific Reports · doi:10.1038/s41598-022-08051-0 · Cited by 15
Self-citationSchiliro, C., & Firestein, B. L. (2022) · Cells · doi:10.3390/cells11223593 · Cited by 14
Coupling Dichloroacetate Treatment with Curcumin Significantly Enhances Anticancer Potential
KAN, P.-C., Chang, Y., Chien, C., Su, C.-Y., & Fang, H.-W. (2018) · Anticancer Research · doi:10.21873/anticanres.12981 · Cited by 13
Deamidated Human Triosephosphate Isomerase is a Promising Druggable Target
Enríquez‐Flores, S., Flores-López, L. A., García‐Torres, I., la Mora, I. D. L. M.-D., Cabrera, N., Gutiérrez‐Castrellón, P., Martínez-Pérez, Y., & López-Velázquez, G. (2020) · Biomolecules · doi:10.3390/biom10071050 · Cited by 13
Self-citationYates, J., Gomes, F. P., Durbin, K. R., Schauer, K. L., Nwachukwu, J., Russo, R. J., Njeri, J., Saviola, A. J., Mcclatchy, D., Diedrich, J., et al. (2023) · Research Square · doi:10.21203/rs.3.rs-3097806/v1 · Cited by 1
Cited by
Sorted by citations
Cabrera-Serrano, A. J., Sánchez‐Maldonado, J. M., González‐Olmedo, C., Carretero-Fernández, M., Díaz-Beltrán, L., Gutiérrez‐Bautista, J. F., García‐Verdejo, F. J., Gálvez-Montosa, F., López-López, J. A., García-Martín, P., et al. (2025) · Antioxidants · doi:10.3390/antiox14030264 · Cited by 50
Benkő, B.-M., De Brito Parreirinha, N. S., Sebe, I., & Zelkó, R. (2026) · iScience · doi:10.1016/j.isci.2026.115441 · Cited by 2
Martínez-Pérez, Y., la Mora, I. D. L. M.-D., Hernández-Alcántara, G., López‐Herrera, G., García‐Torres, I., Gómez-Manzo, S., Olaya-Vargas, A., León-Ávila, G., Hernández-Hernández, J. M., González-Rubio, F., et al. (2026) · Biochemical Journal · doi:10.1042/bcj20253451 · Cited by 1
Self-citationFlores-López, L. A., López‐Herrera, G., Martínez-Pérez, Y., Matadamas-Ortiz, E.-J., Gómez-Manzo, S., Hernández‐Alcántara, G., González-Maciel, A., Reynoso-Robles, R., Hernández‐Ochoa, B., Chino-Ríos, L., et al. (2026) · International Journal of Molecular Sciences · doi:10.3390/ijms27104167 · Cited by 1
Self-citationPan, J., Li, B., Lin, R., Fang, C., Lau, L., Hong, Z., & Chen, Y. (2026) · International Journal of Oncology · doi:10.3892/ijo.2026.5932 · Cited by 1
Metadata
- Authors
- Flores-López, L. A., De la Mora-De la Mora, I., Malagón-Reyes, C. M., García-Torres, I., Martínez-Pérez, Y., López-Herrera, G., Hernández-Alcántara, G., León-Avila, G., López-Velázquez, G., Olaya-Vargas, A., Gómez-Manzo, S., & Enríquez-Flores, S.
- Affiliations
- Instituto Nacional de Pediatria (MX)
- Laboratorio de Biomoléculas y Salud Infantil, Instituto Nacional de Pediatría, Mexico City 04530, Mexico
- Universidad Nacional Autónoma de México (MX)
- Tecnológico de Monterrey (MX)
- Laboratorio de Inmunodeficiencias, Instituto Nacional de Pediatría, Mexico City 04530, Mexico
- Departamento de Bioquímica, Facultad de Medicina, Universidad Nacional Autónoma de México, Apartado Postal 70-159, Mexico City 04510, Mexico
- Departamento de Zoología, Escuela Nacional de Ciencias Biológicas, Instituto Politécnico Nacional, Carpio y Plan de Ayala S/N, Casco de Santo Tomás, Ciudad de México 11340, Mexico
- Trasplante de Células Madre y Terapia Celular, Instituto Nacional de Pediatría, Mexico City 04530, Mexico
- Laboratorio de Bioquímica Genética, Instituto Nacional de Pediatría, Mexico City 04530, Mexico
- Corresponding author
- Flores-López, Luis A.
- ORCID
- Venue
- Biomolecules
- Publisher
- MDPI AG
- Published
- 2024-10-13
- Volume
- 14
- Issue
- 10
- Pages
- 1295
- ISSN
- 2218-273X (ISSN-L)
- PMC
- PMC11506356
- OpenAlex
- W4403401779
- Cited by
- 6
- References
- 74
- Citations by year
- 2026: 5 · 2025: 1
- FWCI
- 2.49
- Type
- journal article
- Language
- en
- Open access
- gold
- doi.org
- Licence
- Locations
- Biomolecules (publishedVersion, cc-by)
- PubMed Central (publishedVersion, cc-by)
- PubMed (publishedVersion)
- DOAJ (DOAJ: Directory of Open Access Journals) (submittedVersion, cc-by-sa)
- Funders
- Consejo Nacional de Humanidades, Ciencias y Tecnologías (CONAHCYT), Ciencia de Frontera 2023 (CF-2023-I-811, CF-2023-I-2755, 2019/072, 2022/067)
- E022 Program, National Institute of Pediatrics, Mexico City, Mexico (Recursos Fiscales para la Investigación) (CF-2023-I-811, CF-2023-I-2755, 2019/072, 2022/067)
- Topics
- Health Sciences › Medicine › Hematology › Acute Lymphoblastic Leukemia research
- Life Sciences › Biochemistry, Genetics and Molecular Biology › Cancer Research › Cancer, Hypoxia, and Metabolism
- Life Sciences › Biochemistry, Genetics and Molecular Biology › Molecular Biology › Biochemical and Molecular Research
- Keywords
- T-cell acute lymphoblastic leukemia, disulfiram, curcumin, dichloroacetate, enzyme inhibition, synergistic drug combination, apoptosis, Jurkat cells, T cells
- MeSH terms
- Cell Survival, Curcumin, Dichloroacetic Acid, Disulfiram, Drug Synergism, Enzyme Inhibitors, Humans, Triose-Phosphate Isomerase, Apoptosis, Jurkat Cells, Precursor T-Cell Lymphoblastic Leukemia-Lymphoma
About these checks
Registry, retraction, Cites and statistics results are computed, not judged, with one exception: a printed reference that no index lists is read once by a model before it counts as a citation error. Claims are extracted by a model and kept only when their quote appears verbatim in the text; each cited source is then checked, with a model’s help, for whether it says what the claim relies on. Those verdicts can be wrong — read the claim’s quote and the cited source before relying on one.
Statistics and arithmetic are recomputed, not judged.
Confidence bands are shown only for fields calibrated on our annotated test set. None is calibrated yet, so no band is shown.
What counts as a claim ›How we measure confidence ›How we check this ›
Are you an author, or do you see a problem with this page? Request a review
