Cited by 5

The DOI matches its Crossref record; 3 of the 3 references it cites were found in a registry or an index.

Restoration of T and B Cell Differentiation after RAG1 Gene Transfer in Human RAG1 Defective Hematopoietic Stem Cells

Sorel, Nataël, Díaz-Pascual, Francisco, Bessot, Boris, Sadek, Hanem, Mollet, Chloé, Chouteau, Myriam, Zahn, Marco, Gil-Farina, Irene, Tajer, Parisa, van Eggermond, Marja, Berghuis, Dagmar, Lankester, Arjan C., André, Isabelle, Gabriel, Richard, Cavazzana, Marina, Pike-Overzet, Kasrin, Staal, Frank J. T., Lagresle-Peyrou, Chantal·2024·Biomedicines

Abstract

Recombinase-activating gene (RAG)-deficient SCID patients lack B and T lymphocytes due to the inability to rearrange immunoglobulin and T cell receptor genes. The two RAG genes act as a required dimer to initiate gene recombination. Gene therapy is a valid treatment alternative for RAG-SCID patients who lack a suitable bone marrow donor, but developing such therapy for RAG1/2 has proven challenging. Using a clinically approved lentiviral vector with a codon-optimized RAG1 gene, we report here preclinical studies using CD34+ cells from four RAG1-SCID patients. We used in vitro T cell developmental assays and in vivo assays in xenografted NSG mice. The RAG1-SCID patient CD34+ cells transduced with the RAG1 vector and transplanted into NSG mice led to restored human B and T cell development. Together with favorable safety data on integration sites, these results substantiate an ongoing phase I/II clinical trial for RAG1-SCID.

Overview

The claims and statistics of this paper haven’t been checked yet.

Run the check — free, no account needed. It reads the open-access text and checks the sources it cites.

A few free checks a day · papers already verified open instantly · results are public

Integrity signals

Registry

Crossref · 10.3390/biomedicines12071495

Cites

3 of 3 references verified0 citation errors · 0 not checkable

Statistics

Figures

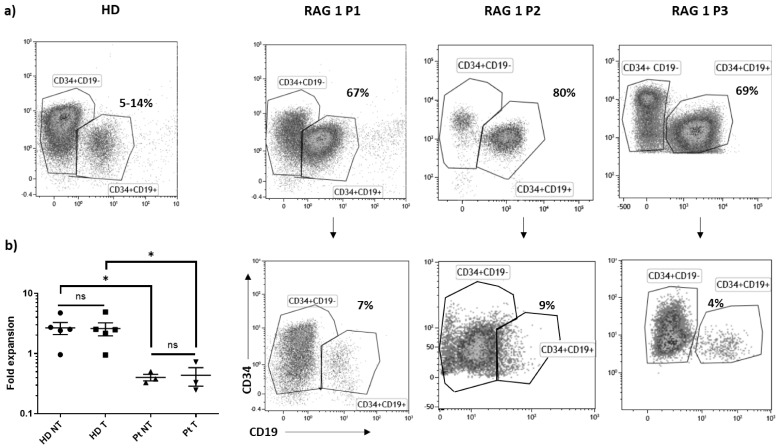
Figure 1 RAG1 bone-marrow samples phenotype. Healthy donor (HD) or RAG1 patient (P1, P2, P3) bone marrow CD34+ cells were transduced (T) or not (NT) with the RAG1-pre GMP lentiviral batch. (a) Phenotype analysis before and after the transduction step by flow cytometry. (b) Fold expansion in HD and patient (Pt) measured as cell number after the transduction step (Day 3)/cell number at the beginning of the culture (Day 0). * p < 0.05; ns: not significant.
Figure 1 RAG1 bone-marrow samples phenotype. Healthy donor (HD) or RAG1 patient (P1, P2, P3) bone marrow CD34+ cells were transduced (T) or not (NT) with the RAG1-pre GMP lentiviral batch. (a) Phenotype analysis before and after the transduction step by flow cytometry. (b) Fold expansion in HD and patient (Pt) measured as cell number after the transduction step (Day 3)/cell number at the beginning of the culture (Day 0). * p < 0.05; ns: not significant.CC BY · PubMed Central
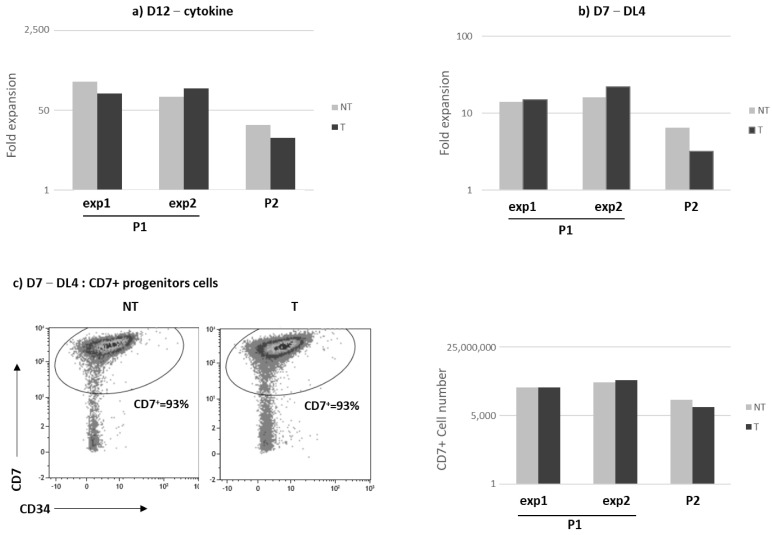
Figure 2 In vitro proliferation and differentiation of RAG1 gene therapy corrected HSPCs from P1 and P2 bone marrow samples. RAG1 patient (P1, P2) bone marrow CD34+ cells were transduced (T, black histogram) or not (NT, grey histogram) with the RAG1-pre GMP lentiviral batch. (a) Cell expansion was evaluated after a 12-day culture with cytokines in two different experiments (exp1 and exp2) for P1 patients. (b) Fold change cell expansion after a 7-day culture on DL4. (c) CD7+ percentage and cell number after a 7-day culture on DL4. (d) CD4+CD8+ percentage and cell number after culture on OP9-DL1 stroma for P1. (e) CD4+CD8+ percentage after culture on OP9-DL1 stroma for P2. The percentage of CD7, CD4 and CD8 positive cells was evaluated by flow cytometry.
Figure 2 In vitro proliferation and differentiation of RAG1 gene therapy corrected HSPCs from P1 and P2 bone marrow samples. RAG1 patient (P1, P2) bone marrow CD34+ cells were transduced (T, black histogram) or not (NT, grey histogram) with the RAG1-pre GMP lentiviral batch. (a) Cell expansion was evaluated after a 12-day culture with cytokines in two different experiments (exp1 and exp2) for P1 patients. (b) Fold change cell expansion after a 7-day culture on DL4. (c) CD7+ percentage and cell number after a 7-day culture on DL4. (d) CD4+CD8+ percentage and cell number after culture on OP9-DL1 stroma for P1. (e) CD4+CD8+ percentage after culture on OP9-DL1 stroma for P2. The percentage of CD7, CD4 and CD8 positive cells was evaluated by flow cytometry.CC BY · PubMed Central
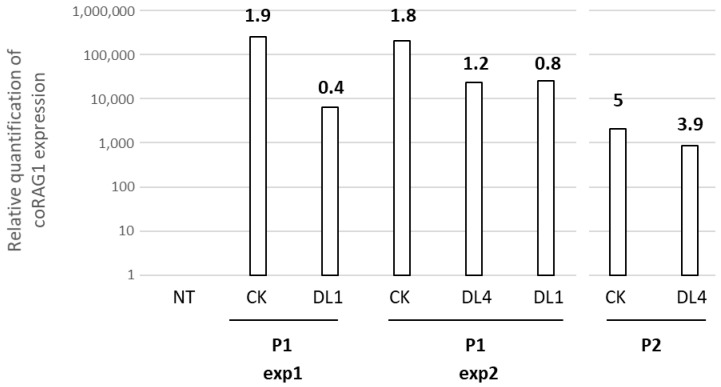
Figure 3 VCN and RAG1 transgene expression after in vitro cultures. Relative quantification of coRAG1 expression and VCN (number in bold) were analyzed in two different BM samples from P1 and P2 RAG1 patients after culture in the cytokine cocktail (CK), on DL4 or OP9-DL1 (DL1).
Figure 3 VCN and RAG1 transgene expression after in vitro cultures. Relative quantification of coRAG1 expression and VCN (number in bold) were analyzed in two different BM samples from P1 and P2 RAG1 patients after culture in the cytokine cocktail (CK), on DL4 or OP9-DL1 (DL1).CC BY · PubMed Central
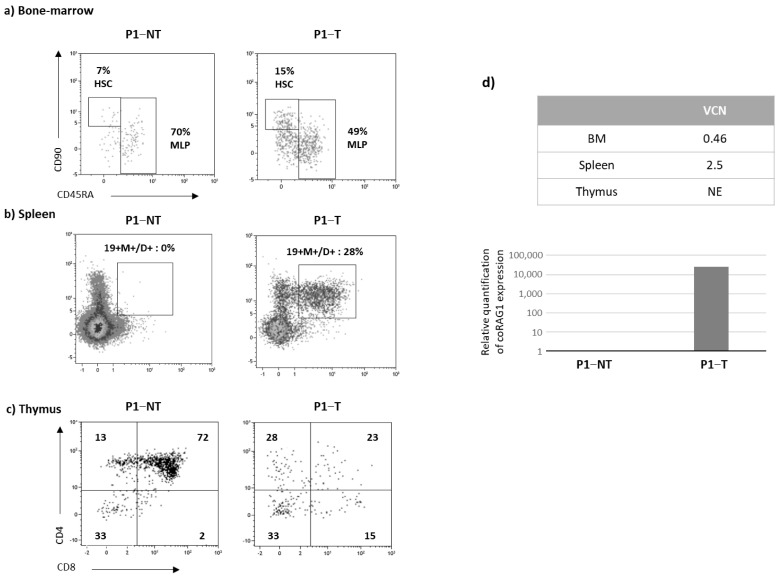
Figure 4 Immune reconstitution in P1 NSG mice (16 weeks). CD34+ cells from P1 patients were transduced (T) or not (NT) and injected into NSG mice. Four months after transplantation, phenotype analysis of the bone marrow (a), spleen (b) and thymus (c) was evaluated by flow cytometry after gating on the human CD45+ cells. (d) VCN evaluation in hematopoietic organs and relative quantification of coRAG1 expression in the spleen. (e) Diversity of the TCRB and TCRA repertoire of spleen samples from mice transplanted with P1cells. Plots show the V- and J-gene recombination of clonotypes detected in each sample. Upper plots correspond to replicates of mice transplanted with non-transduced (NT) cells and lower plots correspond to replicates of spleen samples transplanted with RAG1-transduced (T) cells. Each bow between the V- and J-gene represents a clonotype. The broader the bow, the higher the relative frequency detected for the respective clonotype. Each sample was analyzed in two replicates (replicate 1 in Figure 4e and replicate 2 in Figure S3). (f) CD3R length distribution in the spleen. Plots show the length of CDR3 sequences of clonotypes detected in each sample. Upper plots correspond to replicates of mice transplanted with non-transduced (NT) cells and lower plots correspond to replicates of spleen samples transplanted with RAG1-transduced (T) cells. The x-axis shows the CDR3 length in base pairs and the y-axis shows the relative frequency of the corresponding clonotype.
Figure 4 Immune reconstitution in P1 NSG mice (16 weeks). CD34+ cells from P1 patients were transduced (T) or not (NT) and injected into NSG mice. Four months after transplantation, phenotype analysis of the bone marrow (a), spleen (b) and thymus (c) was evaluated by flow cytometry after gating on the human CD45+ cells. (d) VCN evaluation in hematopoietic organs and relative quantification of coRAG1 expression in the spleen. (e) Diversity of the TCRB and TCRA repertoire of spleen samples from mice transplanted with P1cells. Plots show the V- and J-gene recombination of clonotypes detected in each sample. Upper plots correspond to replicates of mice transplanted with non-transduced (NT) cells and lower plots correspond to replicates of spleen samples transplanted with RAG1-transduced (T) cells. Each bow between the V- and J-gene represents a clonotype. The broader the bow, the higher the relative frequency detected for the respective clonotype. Each sample was analyzed in two replicates (replicate 1 in Figure 4e and replicate 2 in Figure S3). (f) CD3R length distribution in the spleen. Plots show the length of CDR3 sequences of clonotypes detected in each sample. Upper plots correspond to replicates of mice transplanted with non-transduced (NT) cells and lower plots correspond to replicates of spleen samples transplanted with RAG1-transduced (T) cells. The x-axis shows the CDR3 length in base pairs and the y-axis shows the relative frequency of the corresponding clonotype.CC BY · PubMed Central
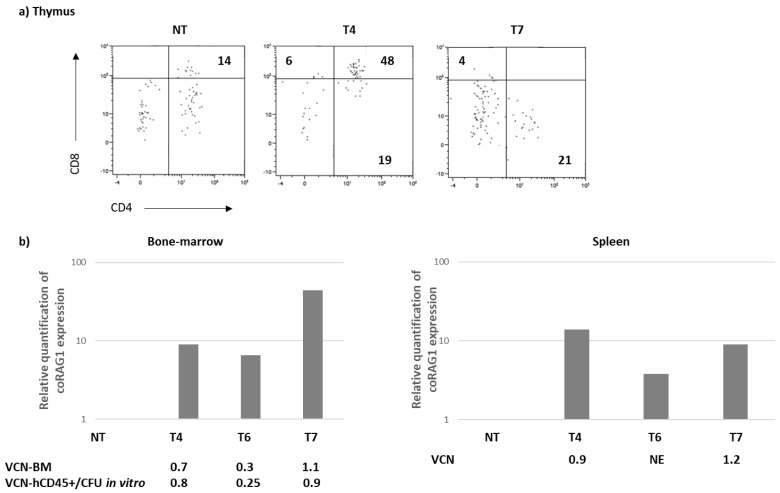
Figure 5 Immune reconstitution in NSG mice (16 weeks)-P2. CD34+ cells from P2 patients were transduced (T) or not (NT) and injected into NSG mice. (a) Four months after transplantation, the chimerism (%) and phenotype analysis were performed by flow cytometry after gating in the human CD45+ cells. (b) Relative quantification of coRAG1 expression and VCN evaluation in the bone marrow and spleen of the 4 transplanted mice (NT, T4, T6, T7).
Figure 5 Immune reconstitution in NSG mice (16 weeks)-P2. CD34+ cells from P2 patients were transduced (T) or not (NT) and injected into NSG mice. (a) Four months after transplantation, the chimerism (%) and phenotype analysis were performed by flow cytometry after gating in the human CD45+ cells. (b) Relative quantification of coRAG1 expression and VCN evaluation in the bone marrow and spleen of the 4 transplanted mice (NT, T4, T6, T7).CC BY · PubMed Central
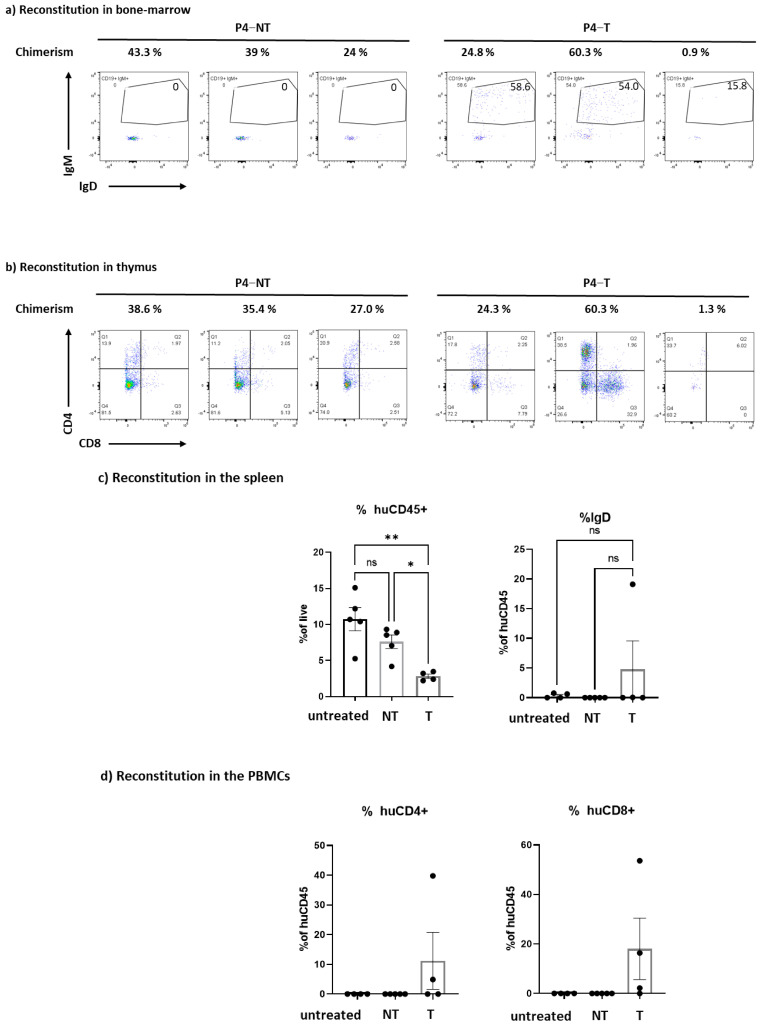
Figure 6 Immune reconstitution in NSG mice transplanted with HSPCs from the 1st patient included in the GT clinical trial (P4). Mobilized CD34+ cells from P4 patients were transduced (T) or not (NT) and injected into NSG mice (n = 5 mice/group). The chimerism and the phenotype were evaluated 4 months after transplantation. (a) Chimerism (% gated on alive cells) and human B cell reconstitution (gated on the CD19+ population) in the bone marrow. The circle represent the percentage of CD19+IgM+ cells (b) Chimerism (% gated on alive cells) and human T cell reconstitution in the thymus. c) Evaluation of the percentage of human CD45+ cells (% huCD45+) and immature B cell (% IgD in the human CD45+ gate) in the spleen. As an internal control, untreated (no culture, no transduction) mobilized CD34+ were also injected in the mice. (c) Evaluation of the percentage of human CD45+ cells (% huCD45+) and mature B cell (% IgD in the human CD45+ gate) in the spleen. As an internal control, untreated (no culture, no transduction) mobilized CD34+ were also injected in the mice. (d) Evaluation of the percentage of human CD4+ cells (% huCD4+) and human CD8+ cells (% huCD8+) in the peripheral blood mononuclear cells (PBMCs) after a gating on the huCD45+ population. As an internal control, untreated (no culture, no transduction) mobilized CD34+ were also injected in the mice. ns = not significant, * p < 0.05 ** p < 0.001; ns: not significant.
Figure 6 Immune reconstitution in NSG mice transplanted with HSPCs from the 1st patient included in the GT clinical trial (P4). Mobilized CD34+ cells from P4 patients were transduced (T) or not (NT) and injected into NSG mice (n = 5 mice/group). The chimerism and the phenotype were evaluated 4 months after transplantation. (a) Chimerism (% gated on alive cells) and human B cell reconstitution (gated on the CD19+ population) in the bone marrow. The circle represent the percentage of CD19+IgM+ cells (b) Chimerism (% gated on alive cells) and human T cell reconstitution in the thymus. c) Evaluation of the percentage of human CD45+ cells (% huCD45+) and immature B cell (% IgD in the human CD45+ gate) in the spleen. As an internal control, untreated (no culture, no transduction) mobilized CD34+ were also injected in the mice. (c) Evaluation of the percentage of human CD45+ cells (% huCD45+) and mature B cell (% IgD in the human CD45+ gate) in the spleen. As an internal control, untreated (no culture, no transduction) mobilized CD34+ were also injected in the mice. (d) Evaluation of the percentage of human CD4+ cells (% huCD4+) and human CD8+ cells (% huCD8+) in the peripheral blood mononuclear cells (PBMCs) after a gating on the huCD45+ population. As an internal control, untreated (no culture, no transduction) mobilized CD34+ were also injected in the mice. ns = not significant, * p < 0.05 ** p < 0.001; ns: not significant.CC BY · PubMed Central
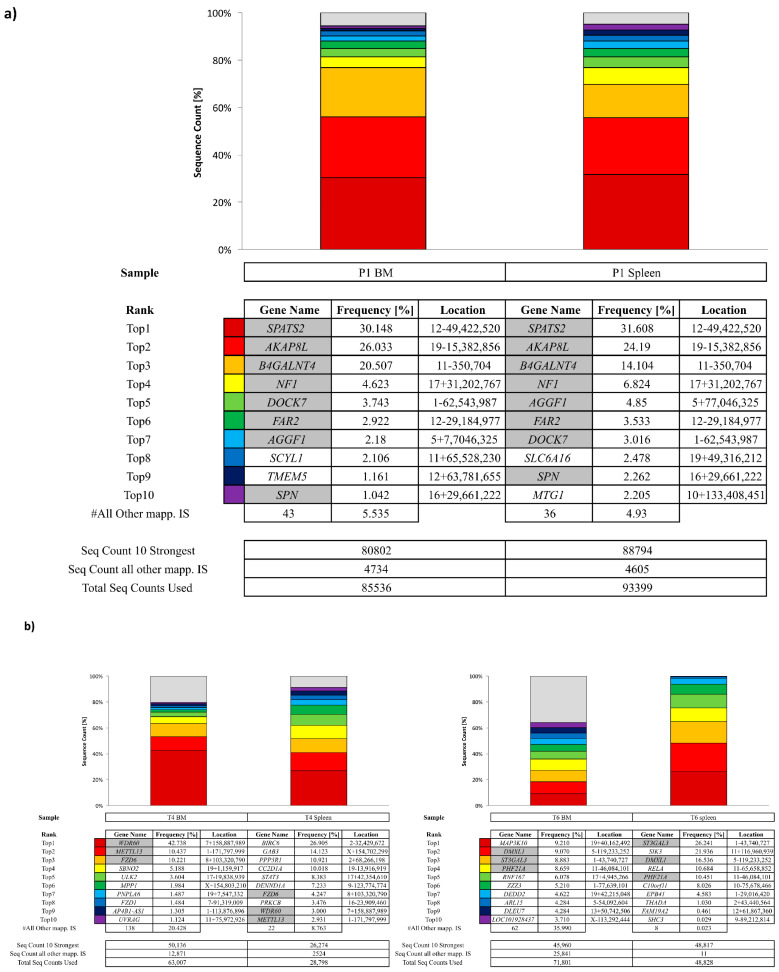
Figure 7 Integration site analysis in NSG mice (16 weeks). Integration site (IS) analysis was analyzed in samples from NSG mice transplanted with P1 (a) or P2 (b) and (c) IS analysis in CD34+ from P2 patients cells after a 14-day in vitro culture. Cumulative retrieval frequencies of the ten most prominent IS detected are shown. For individual samples, sequence data from all S-EPTS/LM-PCR replicates are combined. Sequence count of the ten most prominent IS (Seq Count 10 Strongest), sequence count of all remaining IS (Seq Count all other mapp. IS) and total IS-specific sequence count from all replicates (Total Seq Count Used) are shown at the bottom for each sample. RefSeq names of genes located closest to the respective IS are given in the (Gene Name). Relative sequence count contributions of the ten most prominent IS and all remaining mappable IS are shown (Freq., Frequency [%]). The location column is composed of chromosome number, sequence orientation (plus or minus) and IS locus (based on human reference genome hg38). Grey-marked fields represent the top 10 ISs detected in both samples.
Figure 7 Integration site analysis in NSG mice (16 weeks). Integration site (IS) analysis was analyzed in samples from NSG mice transplanted with P1 (a) or P2 (b) and (c) IS analysis in CD34+ from P2 patients cells after a 14-day in vitro culture. Cumulative retrieval frequencies of the ten most prominent IS detected are shown. For individual samples, sequence data from all S-EPTS/LM-PCR replicates are combined. Sequence count of the ten most prominent IS (Seq Count 10 Strongest), sequence count of all remaining IS (Seq Count all other mapp. IS) and total IS-specific sequence count from all replicates (Total Seq Count Used) are shown at the bottom for each sample. RefSeq names of genes located closest to the respective IS are given in the (Gene Name). Relative sequence count contributions of the ten most prominent IS and all remaining mappable IS are shown (Freq., Frequency [%]). The location column is composed of chromosome number, sequence orientation (plus or minus) and IS locus (based on human reference genome hg38). Grey-marked fields represent the top 10 ISs detected in both samples.CC BY · PubMed Central
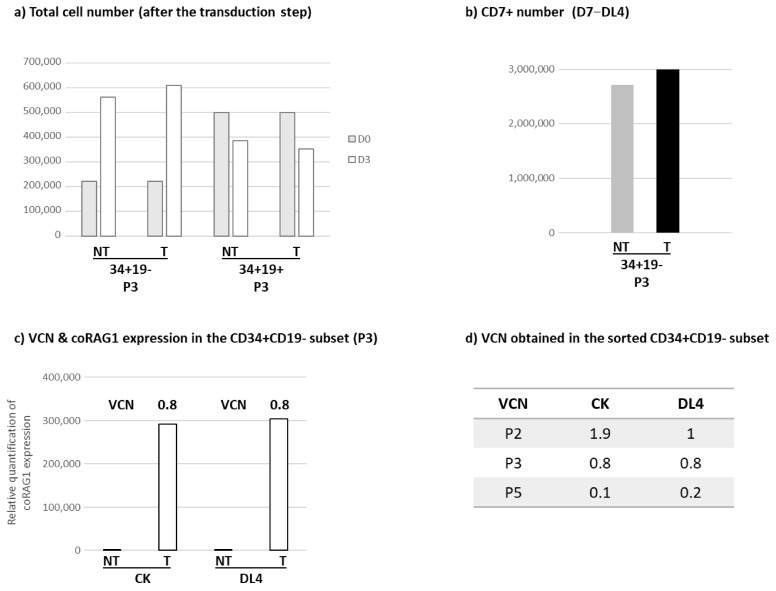
Figure 8 Proliferation and differentiation of the sorted CD34+CD19- and CD34+CD19+ HSPCs subsets isolated from RAG1 mutated patients. CD34+ cells from patient bone marrow samples were sorted into two groups depending on the expression of the CD19, resulting in the following subsets: CD34+CD19- and CD34+CD19+. Sorted cells were transduced (T) or not (NT) with the RAG1-pre GMP lentiviral batch. (a) Total cell number evaluation in CD34+CD19- and CD34+CD19+ subsets before the transduction step (D0, grey histogram) and after the transduction step (D3, white histogram). (b) CD7+ cell count obtained after a 7-day culture on DL4 in the NT (grey histogram) and T (black histogram) conditions. (c) Relative quantification of coRAG1 expression and VCN evaluation within the CD34+CD19- subset after a 14-day culture in cytokine cocktail (CK) and a 7-day culture on DL4. (d) VCN obtained in the transduced CD34+CD19- subset after culture in the CK or DL4 conditions. Samples from 3 patients were represented (P2, P3 and P5). (e) CD4+CD8+ percentage and cell number evaluation after a 28-day culture on the OP9-DL1 stroma. (f) Chimerism and CD4+CD8+ percentage were evaluated by flow cytometry in the thymus of six-week-old NSG mice injected with CD34+CD19-cells 3 days after birth.
Figure 8 Proliferation and differentiation of the sorted CD34+CD19- and CD34+CD19+ HSPCs subsets isolated from RAG1 mutated patients. CD34+ cells from patient bone marrow samples were sorted into two groups depending on the expression of the CD19, resulting in the following subsets: CD34+CD19- and CD34+CD19+. Sorted cells were transduced (T) or not (NT) with the RAG1-pre GMP lentiviral batch. (a) Total cell number evaluation in CD34+CD19- and CD34+CD19+ subsets before the transduction step (D0, grey histogram) and after the transduction step (D3, white histogram). (b) CD7+ cell count obtained after a 7-day culture on DL4 in the NT (grey histogram) and T (black histogram) conditions. (c) Relative quantification of coRAG1 expression and VCN evaluation within the CD34+CD19- subset after a 14-day culture in cytokine cocktail (CK) and a 7-day culture on DL4. (d) VCN obtained in the transduced CD34+CD19- subset after culture in the CK or DL4 conditions. Samples from 3 patients were represented (P2, P3 and P5). (e) CD4+CD8+ percentage and cell number evaluation after a 28-day culture on the OP9-DL1 stroma. (f) Chimerism and CD4+CD8+ percentage were evaluated by flow cytometry in the thymus of six-week-old NSG mice injected with CD34+CD19-cells 3 days after birth.CC BY · PubMed Central

Verification

Claims the paper makes

The claims and statistics of this paper haven’t been checked yet.

Run the check — free, no account needed. It reads the open-access text and checks the sources it cites.

A few free checks a day · papers already verified open instantly · results are public

Claims other papers make about this one

Each is checked against this paper’s own text: does it say what the citing paper says it does?

Self-check

Percentages, sums and reported differences re-computed from the paper’s own numbers.

The self-check needs the paper’s full text.

Citations

Cites

Show all 3 references

Research works printed but not linked: 44

  1. Braams, M., Pike-Overzet, K., and Staal, F.J.T. (2023). The recombinase activating genes: Architects of immune diversity during lymphocyte development. Front. Immunol., 14. · DOI
  2. Buckley, 2004, Molecular defects in human severe combined immunodeficiency and approaches to immune reconstitution, Annu. Rev. Immunol., 22, 625, 10.1146/annurev.immunol.22.012703.104614 · DOI
  3. Bosticardo, 2021, RAG deficiencies: Recent advances in disease pathogenesis and novel therapeutic approaches, Eur. J. Immunol., 51, 1028, 10.1002/eji.202048880 · DOI
  4. Kwan, 2014, Newborn screening for severe combined immunodeficiency in 11 screening programs in the United States, JAMA, 312, 729, 10.1001/jama.2014.9132 · DOI
  5. Delmonte, 2018, RAG Deficiency: Two Genes, Many Diseases, J. Clin. Immunol., 38, 646, 10.1007/s10875-018-0537-4 · DOI
  6. Cifaldi, 2022, Clinical, Immunological, and Molecular Variability of RAG Deficiency: A Retrospective Analysis of 22 RAG Patients, J. Clin. Immunol., 42, 130, 10.1007/s10875-021-01130-3 · DOI
  7. Fischer, 2015, Severe combined immunodeficiencies and related disorders, Nat. Rev. Dis. Prim., 1, 15061, 10.1038/nrdp.2015.61 · DOI
  8. Dvorak, 2014, Comparison of outcomes of hematopoietic stem cell transplantation without chemotherapy conditioning by using matched sibling and unrelated donors for treatment of severe combined immunodeficiency, J. Allergy Clin. Immunol., 134, 935, 10.1016/j.jaci.2014.06.021 · DOI
  9. Neven, 2009, Long-term outcome after hematopoietic stem cell transplantation of a single-center cohort of 90 patients with severe combined immunodeficiency, Blood, 113, 4114, 10.1182/blood-2008-09-177923 · DOI
  10. Buckley, 2010, Transplantation of hematopoietic stem cells in human severe combined immunodeficiency: Longterm outcomes, Immunol. Res., 49, 25, 10.1007/s12026-010-8191-9 · DOI
  11. Lankester, 2022, Hematopoietic cell transplantation in severe combined immunodeficiency: The SCETIDE 2006-2014 European cohort, J. Allergy Clin. Immunol., 149, 1744, 10.1016/j.jaci.2021.10.017 · DOI
  12. Fischer, 2020, Gene therapy for severe combined immunodeficiencies and beyond, J. Exp. Med., 217, e20190607, 10.1084/jem.20190607 · DOI
  13. Ferrari, 2020, Gene therapy using haematopoietic stem and progenitor cells, Nat. Rev. Genet., 22, 216, 10.1038/s41576-020-00298-5 · DOI
  14. Lankester, 2023, Advances in gene therapy for inborn errors of immunity, Curr. Opin. Allergy Clin. Immunol., 23, 467, 10.1097/ACI.0000000000000952 · DOI
  15. Yates, 2005, Long-term immune reconstitution in RAG-1-deficient mice treated by retroviral gene therapy: A balance between efficiency and toxicity, Blood, 107, 63
  16. Benjelloun, 2008, Restoration of Human B-cell Differentiation Into NOD-SCID Mice Engrafted With Gene-corrected CD34+ Cells Isolated From Artemis or RAG1-deficient Patients, Mol. Ther., 16, 396, 10.1038/sj.mt.6300353 · DOI
  17. Rodijk, 2011, Correction of murine Rag1 deficiency by self-inactivating lentiviral vector-mediated gene transfer, Leukemia, 25, 1471, 10.1038/leu.2011.106 · DOI
  18. Baum, 2014, Successful RAG1-SCID gene therapy depends on the level of RAG1 expression, J. Allergy Clin. Immunol., 134, 242, 10.1016/j.jaci.2014.04.033 · DOI
  19. Sarwari, 2014, Recombination-activating gene 1 (Rag1)–deficient mice with severe combined immunodeficiency treated with lentiviral gene therapy demonstrate autoimmune Omenn-like syndrome, J. Allergy Clin. Immunol., 133, 1116, 10.1016/j.jaci.2013.10.009 · DOI
  20. Vloemans, 2020, Successful preclinical development of gene therapy for recombinase-activating gene-1-deficient SCID, Mol. Ther. Methods Clin. Dev., 17, 666, 10.1016/j.omtm.2020.03.016 · DOI
  21. Six, 2008, Human adenylate kinase 2 deficiency causes a profound hematopoietic defect associated with sensorineural deafness, Nat. Genet., 41, 106
  22. Moirangthem, 2021, A DL-4-and TNFα-based culture system to generate high numbers of nonmodified or genetically modified immunotherapeutic human T-lymphoid progenitors, Cell. Mol. Immunol., 18, 1662, 10.1038/s41423-021-00706-8 · DOI
  23. Schmidt, 2001, Detection and direct genomic sequencing of multiple rare unknown flanking DNA in highly complex samples, Hum. Gene Ther., 12, 743, 10.1089/104303401750148649 · DOI
  24. Afzal, 2017, GENE-IS: Time-Efficient and Accurate Analysis of Viral Integration Events in Large-Scale Gene Therapy Data, Mol. Ther. Nucleic Acids, 6, 133, 10.1016/j.omtn.2016.12.001 · DOI
  25. Fronza, 2015, A Graph Based Framework to Model Virus Integration Sites, Comput. Struct. Biotechnol. J., 14, 69, 10.1016/j.csbj.2015.10.006 · DOI
  26. Shen, 2003, Common Sites of Retroviral Integration in Mouse Hematopoietic Tumors Identified by High-Throughput, Single Nucleotide Polymorphism-Based Mapping and Bacterial Artificial Chromosome Hybridization, J. Virol., 77, 1584, 10.1128/JVI.77.2.1584-1588.2003 · DOI
  27. Abel, U., Deichmann, A., Nowrouzi, A., Gabriel, R., Bartholomae, C.C., Glimm, H., von Kalle, C., and Schmidt, M. (2011). Analyzing the number of common integration sites of viral vectors—New methods and computer programs. PLoS ONE, 6. · DOI
  28. Sun, 2011, Computational identification of insertional mutagenesis targets for cancer gene discovery, Nucleic. Acids Res., 39, e105, 10.1093/nar/gkr447 · DOI
  29. Mamedov, I.Z., Britanova, O.V., Zvyagin, I.V., Turchaninova, M.A., Bolotin, D.A., Putintseva, E.V., Lebedev, Y.B., and Chudakov, D.M. (2012). Preparing unbiased T-cell receptor and antibody cDNA libraries for the deep next generation sequencing profiling. Front. Immunol., 4. · DOI
  30. Bolotin, 2015, MiXCR: Software for comprehensive adaptive immunity profiling, Nat. Methods, 12, 380, 10.1038/nmeth.3364 · DOI
  31. Shugay, M., Bagaev, D.V., Turchaninova, M.A., Bolotin, D.A., Britanova, O.V., Putintseva, E.V., Pogorelyy, M.V., Nazarov, V.I., Zvyagin, I.V., and Kirgizova, V.I. (2015). VDJtools: Unifying Post-analysis of T Cell Receptor Repertoires. PLoS Comput. Biol., 11. · DOI
  32. Tucci, 2022, A systematic review and meta-analysis of gene therapy with hematopoietic stem and progenitor cells for monogenic disorders, Nat. Commun., 13, 1315, 10.1038/s41467-022-28762-2 · DOI · Paper page
  33. Jang, 2020, Optimizing lentiviral vector transduction of hematopoietic stem cells for gene therapy, Gene Ther., 27, 545, 10.1038/s41434-020-0150-z · DOI
  34. Masiuk, 2019, PGE2 and poloxamer synperonic F108 enhance transduction of human HSPCs with a β-globin lentiviral vector, Mol. Ther. Methods Clin. Dev., 13, 390, 10.1016/j.omtm.2019.03.005 · DOI
  35. Wu, 2004, Integration target site selection for retroviruses and transposable elements, Cell. Mol. Life Sci., 61, 2588, 10.1007/s00018-004-4206-9 · DOI
  36. Cattoglio, 2007, Hot spots of retroviral integration in human CD34+ hematopoietic cells, Blood, 110, 1770, 10.1182/blood-2007-01-068759 · DOI
  37. Brecht, 2020, Nucleolar localization of RAG1 modulates V(D)J recombination activity, Proc. Natl. Acad. Sci. USA, 117, 4300, 10.1073/pnas.1920021117 · DOI
  38. Beilinson, 2021, The RAG1 N-terminal region regulates the efficiency and pathways of synapsis for V(D)J recombination, J. Exp. Med., 218, e20210250, 10.1084/jem.20210250 · DOI
  39. Lee, 2013, A systematic analysis of recombination activity and genotype-phenotype correlation in human recombination-activating gene 1 deficiency, J. Allergy Clin. Immunol., 133, 1099, 10.1016/j.jaci.2013.10.007 · DOI
  40. Corneo, 2001, Identical mutations in RAG1 or RAG2 genes leading to defective V(D)J recombinase activity can cause either T-B–severe combined immune deficiency or Omenn syndrome, Blood, 97, 2772, 10.1182/blood.V97.9.2772 · DOI
  41. Csomos, 2022, Partial RAG deficiency in humans induces dysregulated peripheral lymphocyte development and humoral tolerance defect with accumulation of T-bet+ B cells, Nat. Immunol., 23, 1256, 10.1038/s41590-022-01271-6 · DOI
  42. Villa, 2019, RAG gene defects at the verge of immunodeficiency and immune dysregulation, Immunol. Rev., 287, 73, 10.1111/imr.12713 · DOI
  43. Abina, 2015, Outcomes following gene therapy in patients with severe wiskott-aldrich syndrome, JAMA, 313, 1550, 10.1001/jama.2015.3253 · DOI · Paper page
  44. Magnani, 2022, Long-term safety and efficacy of lentiviral hematopoietic stem/progenitor cell gene therapy for Wiskott–Aldrich syndrome, Nat. Med., 28, 71, 10.1038/s41591-021-01641-x · DOI · Paper page

Cited by

Metadata

Authors
Sorel, N., Díaz-Pascual, F., Bessot, B., Sadek, H., Mollet, C., Chouteau, M., Zahn, M., Gil-Farina, I., Tajer, P., van Eggermond, M., Berghuis, D., Lankester, A. C., André, I., Gabriel, R., Cavazzana, M., Pike-Overzet, K., Staal, F. J. T., & Lagresle-Peyrou, C.
Affiliations
  • Human Lymphohematopoiesis Laboratory, Université Paris Cité, Imagine Institute, INSERM UMR 1163, 75015 Paris, France
  • ProtaGene CGT GmbH, Im Neuenheimer Feld 582, 69120 Heidelberg, Germany
  • Biotherapy Clinical Investigation Center, Groupe Hospitalier Universitaire Ouest, AP-HP, INSERM, 75015 Paris, France
  • Department of Immunohematology and Blood Transfusion, L3-Q Leiden University Medical Center, 2333 ZA Leiden, The Netherlands
  • Department of Pediatrics, Leiden University Medical Center, 2333 ZA Leiden, The Netherlands
  • Biotherapy Department, Necker-Enfants Malades Hospital, AP-HP, 75015 Paris, France
Venue
Biomedicines
Publisher
MDPI AG
Published
2024-07-05
Volume
12
Issue
7
Pages
1495
ISSN
2227-9059
Cited by
5
References
3
Language
en
Funders
  • EU (755170-2, NNF21CC0073729)
  • the Novo Nordisk Foundation for Stem Cell Research (755170-2, NNF21CC0073729)

About these checks

Registry, retraction, Cites and statistics results are computed, not judged, with one exception: a printed reference that no index lists is read once by a model before it counts as a citation error. Claims are extracted by a model and kept only when their quote appears verbatim in the text; each cited source is then checked, with a model’s help, for whether it says what the claim relies on. Those verdicts can be wrong — read the claim’s quote and the cited source before relying on one.

Statistics and arithmetic are recomputed, not judged.

Confidence bands are shown only for fields calibrated on our annotated test set. None is calibrated yet, so no band is shown.

What counts as a claim ›How we measure confidence ›How we check this ›

Are you an author, or do you see a problem with this page? Request a review