

The DOI matches its Crossref record; 65 of the 65 references it cites were found in a registry or an index; none of the 51 sources its claims cite is checked for support yet.
Concussion Disrupts Sleep in Adolescents: A Systematic Review and Meta-Analysis
Open accessAbstract
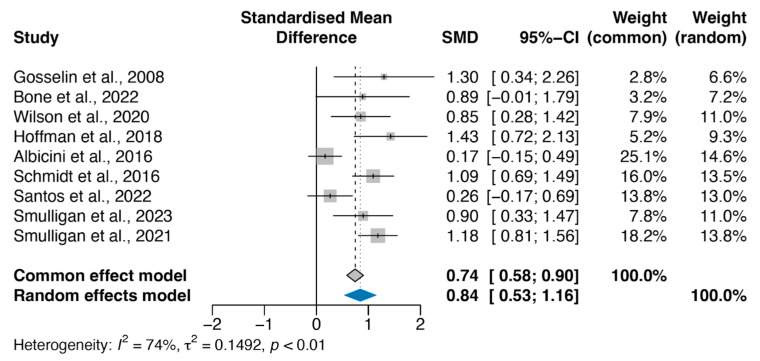
Concussions significantly impact sleep quality among adolescents. Despite increasing recognition of these effects, the complex relationship between adolescent concussions and sleep disturbances is still not fully understood and presents mixed findings. Here, we conducted a systematic review and meta-analysis to assess how concussions affect sleep-related symptoms in adolescents. We included papers presenting Pittsburgh Sleep Quality Index (PSQI) differences following concussion in high school and collegiate patients, with sleep measures recorded following concussion. Animal studies, research on participants with conditions other than concussion, non-English articles and papers failing to present PSQI data were excluded. We searched MEDLINE®, Embase®, CINAHL, Web of Science™, PsycINFO®, Google Scholar, and Cochrane Central Register of Controlled Trials databases until 23 August 2024. In addition, we performed hand-searching of relevant reference lists and conference proceedings to identify further studies. Risk of bias was assessed using the Newcastle–Ottawa scale. In total, we considered 4477 studies, with nine meeting the inclusion criteria. Our analysis involved 796 participants, 340 of whom had experienced a concussion. Analysis was carried out using the meta and metafor packages in R (version 4.0.0). We showed a deterioration in sleep quality post-concussion, as evidenced by increased PSQI (standardised mean difference 0.84; 95% CI 0.53–1.16; p < 0.0001). Subgroup and quality assessments confirmed the consistency of these findings. Since poor sleep quality impacts daytime activities, we analysed the relationship between concussion and daytime dysfunction. We showed that concussion is associated with a significant worsening of the daytime dysfunction score by 0.55 (95% CI 0.24–0.70; p = 0.006). We conclude that concussions impair both sleep quality and daytime functioning in adolescents. Our research underscores the need for systematic inclusion of sleep quality assessments in post-concussion protocols and calls for targeted interventions to manage sleep disturbances post-concussion to mitigate their broader impacts on daily functioning.
Overview
CoChat Summary
TL;DR
This systematic review and meta-analysis found that concussion in adolescents and collegiate-aged individuals is associated with worse sleep quality and greater daytime dysfunction. Across nine studies and 796 participants, PSQI scores were significantly higher post-concussion, and daytime dysfunction scores were also significantly worse.
Key findings
- Pooled analysis of 9 studies (796 participants; 340 concussed) found concussion associated with increased PSQI, indicating worse sleep quality: standardised mean difference 0.84 (95% CI 0.53–1.16; p < 0.0001); the paper reports this corresponds to a 4.24% decrease in sleep quality.
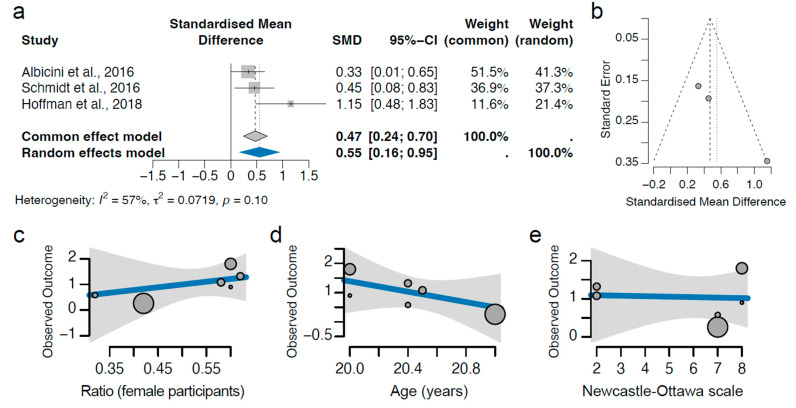
- Daytime dysfunction subscore analysis (3 studies, 404 participants, 35.6% concussed) found significant worsening: standardised effect size 0.55 (95% CI 0.24–0.70; p = 0.006), corresponding to an approximate 9.2% increase in daytime dysfunction.
- Three included studies found non-statistically significant differences in overall PSQI between concussed and non-concussed participants, but some reported significant worsening in specific components such as daytime dysfunction, sleep efficiency, sleep quality, and sleep disturbances.
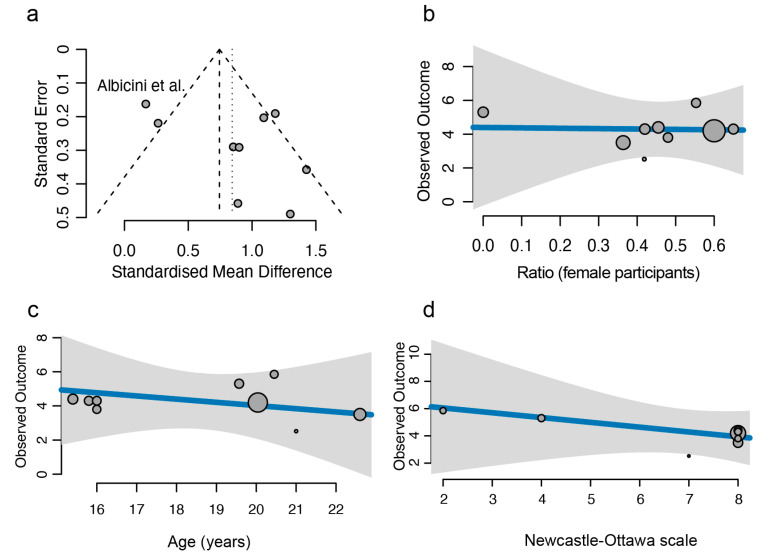
- No moderating effect was found for sex or average age on PSQI, and study quality on the Newcastle–Ottawa scale did not influence the estimated effect of concussion on sleep quality.
Methods
- Systematic review and meta-analysis following PRISMA guidelines, registered with PROSPERO (CRD42021290208); searched MEDLINE, Embase, CINAHL, Web of Science, PsycINFO, Google Scholar, and Cochrane Central Register of Controlled Trials until 23 August 2024, plus hand-searching of reference lists and conference proceedings.
- Included RCTs, abstracts, cross-sectional, and case–control studies published between 1988 and August 2024 that evaluated concussion/mild traumatic brain injury and PSQI in ages 12–30; excluded animal studies, other neurological conditions, non-English articles, duplicates, and articles without full text or results. From 4477 records, 9 studies met inclusion criteria.
- Random-effects models (DerSimonian and Laird method) and mixed-effect models were run in R using the meta and metafor packages; reported weighted standardised mean differences with 95% CIs, assessed heterogeneity with I², publication bias with funnel plots, and study quality with the Newcastle–Ottawa scale.
Limitations
- Stated: the authors were unable to perform moderator analysis for specific confounding factors such as mental health differences or sleep hygiene awareness; future research is needed across diverse populations to understand age, sex, and ethnic differences, and concussions may have sexually dimorphic outcomes.
- Evident from the text: only 9 studies were included, two of which were abstracts not subject to peer review; the primary analysis had heterogeneity, with one study (Albicini et al.) most distinct; Newcastle–Ottawa scores ranged from 2 to 8 out of 9; three studies were drawn from an adolescent population aged 12–18 years while others used student populations; all studies were recruited from English-speaking countries, indicating a homogeneous population.
Model-written summary. Check it against the paper before relying on it.
Integrity signals
Registry
Cites
Statistics
Figures

Verification
Claims the paper makes
0 Valid · 0 Not valid · 27 Not checked · 32 Own results and interpretations
A result the paper reports from its own data — it cites no other source for it, so there is none to check. The quote shows it is in the paper.
In the paper
“We showed that concussion is associated with a significant worsening of the daytime dysfunction score by 0.55 (95% CI 0.24–0.70; p = 0.006).”
- Also stated in: § 3.5. Concussion Impacts Daytime Dysfunction · plain
“We found that concussion is associated with a significant increase in the daytime dysfunction score, with a standardised effect size of 0.55 (95% CI 0.24–0.70; p = 0.006, Figure 4a), which corresponds to an approximate 9.2% increase in the daytime dysfunction score.”
§ Concussion Disrupts Sleep in Adolescents: A Systematic Review and Meta-Analysis > Abstract
plainstates an associationn = 404 ·- Asserted: passes — The authors put it forward as true.
- Checkable: passes — It can be checked against evidence.
- Load-bearing: passes — The paper’s conclusions depend on it.
- Based: passes — The paper gives a reason why it holds.
- Also stated in: § 3.5. Concussion Impacts Daytime Dysfunction · plain
In the paper
“We found no moderating effect for sex (Figure 3b) on PSQI, agreeing with existing literature findings of no difference between sexes and PSQI score in concussion [51].”
§ Concussion Disrupts Sleep in Adolescents: A Systematic Review and Meta-Analysis > 3. Results > 3.4. Risk of Bias, Heterogeneity, and Confounder Analyses
What the sources say
- Not checked yetcites [51] Covassin, 2013, Concussion Symptoms and Neurocognitive Performance of High School and College Athletes Who Incur Multiple Concussions, Am. J. Sports Med. source
plain- Asserted: passes — The authors put it forward as true.
- Checkable: passes — It can be checked against evidence.
- Load-bearing: unclear — It is unclear whether the paper’s conclusions depend on it.
- Based: passes — The paper gives a reason why it holds.
None of the sources cited for this claim have been checked yet.
In the paper
“the daytime dysfunction component of the PSQI was the most consistently reported altered component, even in cases where no overall difference in PSQI was found [48,49].”
§ Concussion Disrupts Sleep in Adolescents: A Systematic Review and Meta-Analysis > 4. Discussion
What the sources say
- Not checked yetcites [48] Yu, 2024, Enhancing Mitochondrial One-Carbon Metabolism Is Neuroprotective in Alzheimer’s Disease Models, Cell Death Dis. source
- Not checked yetcites [49] Yu, Y., Fedele, G., Celardo, I., Zhou, L., Tan, B.W.Z., Loh, S.H.Y., and Martins, L.M. (2025). Distinct Forms of Amyloid-β Moderate Sleep Duration through NAD+-Linked Redox Metabolism in Alzheimer’s Disease. bioRxiv. source
plainstates an association- Asserted: passes — The authors put it forward as true.
- Checkable: passes — It can be checked against evidence.
- Load-bearing: passes — The paper’s conclusions depend on it.
- Based: passes — The paper gives a reason why it holds.
A result the paper reports from its own data — it cites no other source for it, so there is none to check. The quote shows it is in the paper.
In the paper
“We also found that the average age of the study cohort did not impact PSQI (Figure 3c).”
§ Concussion Disrupts Sleep in Adolescents: A Systematic Review and Meta-Analysis > 3. Results > 3.4. Risk of Bias, Heterogeneity, and Confounder Analyses
plain- Asserted: passes — The authors put it forward as true.
- Checkable: passes — It can be checked against evidence.
- Load-bearing: unclear — It is unclear whether the paper’s conclusions depend on it.
- Based: passes — The paper gives a reason why it holds.
A result the paper reports from its own data — it cites no other source for it, so there is none to check. The quote shows it is in the paper.
In the paper
“Our analysis of potential confounding variables, including average age and sex ratio of each study, also showed no associations between these variables and sleep quality.”
§ Concussion Disrupts Sleep in Adolescents: A Systematic Review and Meta-Analysis > 4. Discussion
plain- Asserted: passes — The authors put it forward as true.
- Checkable: passes — It can be checked against evidence.
- Load-bearing: unclear — It is unclear whether the paper’s conclusions depend on it.
- Based: passes — The paper gives a reason why it holds.
21 more claims
Create a free account to see all 59 claims and to verify the 51 references still open.
- It may state two separate claims as one. 23
- The quote only partly states this claim. 3
- Probably not a substantial claim. 21
Self-check
Percentages, sums and reported differences re-computed from the paper’s own numbers.
Each contradiction between two passages listed here was confirmed by an independent check.
Rated major: it would touch a result — a value a result rests on, reported and recomputed p-values on opposite sides of the significance level, two passages that conflict with no sign which is right, or a cited work retracted before this paper was published.
In the paper
“a standardised effect size of 0.55 (95% CI 0.24–0.70; p = 0.006, Figure 4a)”
§ Concussion Disrupts Sleep in Adolescents: A Systematic Review and Meta-Analysis > 3. Results > 3.5. Concussion Impacts Daytime Dysfunction
Reported 0.55 · recomputed 0.47
Rated major: it would touch a result — a value a result rests on, reported and recomputed p-values on opposite sides of the significance level, two passages that conflict with no sign which is right, or a cited work retracted before this paper was published.
In the paper
§ Concussion Disrupts Sleep in Adolescents: A Systematic Review and Meta-Analysis > 3. Results > 3.3. Meta-Analysis on the Effect of Concussion on Sleep Quality
“The nine prospective longitudinal cohort studies that fulfilled the systematic review criteria consisted of 340 concussed participants and 456 controls.”
§ Concussion Disrupts Sleep in Adolescents: A Systematic Review and Meta-Analysis > 3. Results > 3.1. Study Inclusion and Filtering
“Three studies used a case–control approach [9,44,45], of which one was an abstract [44]. Four studies were retrospective cohort trials or longitudinal [46,47,48,49]”
Rated minor: it would not touch a result — a value no result rests on, a p-value that stays on the same side of the significance level, or a conflict that is clerical, resolved elsewhere in the paper, or outside its own findings.
In the paper
§ Concussion Disrupts Sleep in Adolescents: A Systematic Review and Meta-Analysis > 3. Results > 3.2. Study Setting
“Seven studies were performed in the United States [9,43,44,46,49,50].”
§ Concussion Disrupts Sleep in Adolescents: A Systematic Review and Meta-Analysis > 3. Results > 3.2. Study Setting
“One study was performed in Australia [49], and one in Canada [45].”
Rated minor: it would not touch a result — a value no result rests on, a p-value that stays on the same side of the significance level, or a conflict that is clerical, resolved elsewhere in the paper, or outside its own findings.
In the paper
§ Concussion Disrupts Sleep in Adolescents: A Systematic Review and Meta-Analysis > 4. Discussion
“In line with this, the daytime dysfunction component of the PSQI was the most consistently reported altered component, even in cases where no overall difference in PSQI was found [48,49].”
§ Concussion Disrupts Sleep in Adolescents: A Systematic Review and Meta-Analysis > 3. Results > 3.3. Meta-Analysis on the Effect of Concussion on Sleep Quality
“Five studies only provided data on global PSQI scores [43,44,46,47,48].”
Citations
Cites
Measuring inconsistency in meta-analyses
Higgins, J. P. T., Thompson, S. G., Deeks, J. J., & Altman, D. G. (2003) · BMJ · doi:10.1136/bmj.327.7414.557 · Cited by 63,139
Bias in meta-analysis detected by a simple, graphical test
Egger, M., Smith, G. D., Schneider, M., & Minder, C. (1997) · BMJ · doi:10.1136/bmj.315.7109.629 · Cited by 56,722
The Pittsburgh Sleep Quality Index: a new instrument for psychiatric practice and research
Buysse, D. J., Reynolds, C. F., Monk, T. H., Berman, S. R., & Kupfer, D. J. (1989) · Psychiatry Research · doi:10.1016/0165-1781(89)90047-4 · Cited by 35,234
Conducting Meta-Analyses in R with the metafor Package
Viechtbauer, W. (2010) · Journal of Statistical Software · doi:10.18637/jss.v036.i03 · Cited by 20,464
A New Method for Measuring Daytime Sleepiness: The Epworth Sleepiness Scale
Johns, M. W. (1991) · Sleep · doi:10.1093/sleep/14.6.540 · Cited by 17,364
The PRISMA 2020 statement: an updated guideline for reporting systematic reviews
Page, M. J., McKenzie, J. E., Bossuyt, P. M., Boutron, I., Hoffmann, T. C., Mulrow, C. D., Shamseer, L., Tetzlaff, J. M., Akl, E. A., Brennan, S. E., et al. (2021) · Systematic Reviews · doi:10.1186/s13643-021-01626-4 · Cited by 13,874
How to perform a meta-analysis with R: a practical tutorial
Balduzzi, S., Rücker, G., & Schwarzer, G. (2019) · Evidence Based Mental Health · doi:10.1136/ebmental-2019-300117 · Cited by 5,827
Doing Meta-Analysis with R: A Hands-On Guide
Harrer, M., Cuijpers, P., Furukawa, T. A., & Ebert, D. D. (2021) · doi:10.1201/9781003107347 · Cited by 1,850
The nuts and bolts of PROSPERO: an international prospective register of systematic reviews
Booth, A., Clarke, M., Dooley, G., Ghersi, D., Moher, D., Petticrew, M., & Stewart, L. (2012) · Systematic Reviews · doi:10.1186/2046-4053-1-2 · Cited by 1,433
A guide to systematic review and meta-analysis of prognostic factor studies
Riley, R. D., Moons, K. G. M., Snell, K. I. E., Ensor, J., Hooft, L., Altman, D. G., Hayden, J., Collins, G. S., & Debray, T. P. A. (2019) · BMJ · doi:10.1136/bmj.k4597 · Cited by 742
Research works printed but not linked: 1
- Wells, G. (2000, January 3–5). The Newcastle-Ottawa Scale (NOS) for Assessing the Quality of Nonrandomised Studies in Meta-Analyses. Proceedings of the 3rd Symposium on Systemic Review Basics, Oxford, UK.
Cited by
The Integrated Effect of Physical Activity and Sleep Problems on Concussion Symptom Resolution
Salfi, Z. P., Wingerson, M. J., Donahue, C. C., Smulligan, K. L., Simon, S. L., Wilson, J. C., & Howell, D. R. (2026) · Journal of Sport Rehabilitation · doi:10.1123/jsr.2025-0385
Sports Injuries and Mental Health in Child and Adolescent Athletes: A Systematic Review
Gil-Caselles, L., & Zafra, A. O. (2026) · Children · doi:10.3390/children13081076
Metadata
- Authors
- Noordeen, S., Wang, P., Strazda, A. E., Arany, E. S., Ergisi, M., Yeo, L. J., Popovic, R., Mahendran, A., Khawaja, M., Grover, K., Memon, M., Hegde, S., Qiu, C. S., Oulton, C., & Yu, Y.
- Affiliations
- University of Cambridge (GB)
- Imperial College London (GB)
- International Sleep Charity, Shedfield, Southampton SO32 2HQ, UK
- Norfolk and Norwich University Hospital (GB)
- Leeds Teaching Hospitals NHS Trust (GB)
- Eastbourne District General Hospital (GB)
- Corresponding author
- Yu, Yizhou
- ORCID
- Venue
- Clocks & Sleep
- Publisher
- MDPI AG
- Published
- 2025-08-29
- Volume
- 7
- Issue
- 3
- Pages
- 46
- ISSN
- 2624-5175 (ISSN-L)
- PMC
- PMC12452595
- OpenAlex
- W4413807623
- Cited by
- 2
- References
- 65
- Citations by year
- 2026: 2
- FWCI
- 0.29
- Type
- journal article
- Language
- en
- Open access
- gold
- doi.org
- Licence
- Locations
- Clocks & Sleep (publishedVersion, cc-by)
- Europe PMC (PubMed Central) (publishedVersion, cc-by)
- PubMed (publishedVersion)
- PubMed Central (publishedVersion, cc-by)
- Apollo (University of Cambridge) (submittedVersion, cc-by)
- DOAJ (DOAJ: Directory of Open Access Journals) (submittedVersion, cc-by-sa)
- Funders
- International Sleep Charity (1123736)
- Topics
- Health Sciences › Medicine › Clinical Neurology › Traumatic Brain Injury Research
- Social Sciences › Psychology › Experimental and Cognitive Psychology › Sleep and related disorders
- Health Sciences › Medicine › Clinical Neurology › Traumatic Brain Injury and Neurovascular Disturbances
- Keywords
- concussion, sleep quality, adolescents, Pittsburgh Sleep Quality Index, daytime dysfunction, sleep disorders, post-concussion syndrome, high school athletes, collegiate athletes
About these checks
Registry, retraction, Cites and statistics results are computed, not judged, with one exception: a printed reference that no index lists is read once by a model before it counts as a citation error. Claims are extracted by a model and kept only when their quote appears verbatim in the text; each cited source is then checked, with a model’s help, for whether it says what the claim relies on. Those verdicts can be wrong — read the claim’s quote and the cited source before relying on one.
A language model drew the claims from the paper on 2026-11-14, under version 3 of the claim definition (model deepseek-v4.1-flash, prompt extract-v3).
A second model labelled each claim on 2026-11-14 (model jev-1.13-20260917, definition revision gold-guideline-v0.2).
Statistics and arithmetic are recomputed, not judged.
Confidence bands are shown only for fields calibrated on our annotated test set. None is calibrated yet, so no band is shown.
What counts as a claim ›How we measure confidence ›How we check this ›
Are you an author, or do you see a problem with this page? Request a review
Data sources
Bibliographic data: Semantic Scholar, OpenAlex, Crossref.
Contains information from the Semantic Scholar Academic Graph Datasets, made available under the ODC Attribution License (ODC-BY 1.0).
Semantic Scholar’s data is described in: Kinney, R., et al. (2023). The Semantic Scholar Open Data Platform. arXiv:2301.10140.
