

The DOI matches its Crossref record.
Synergistic Information Transfer in the Global System of Financial Markets
Abstract
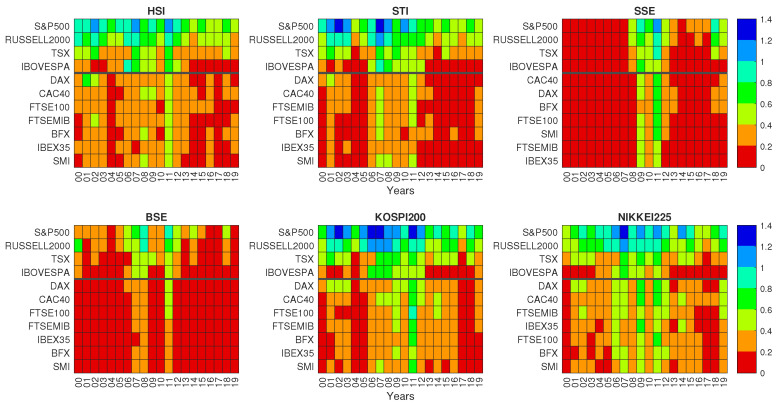
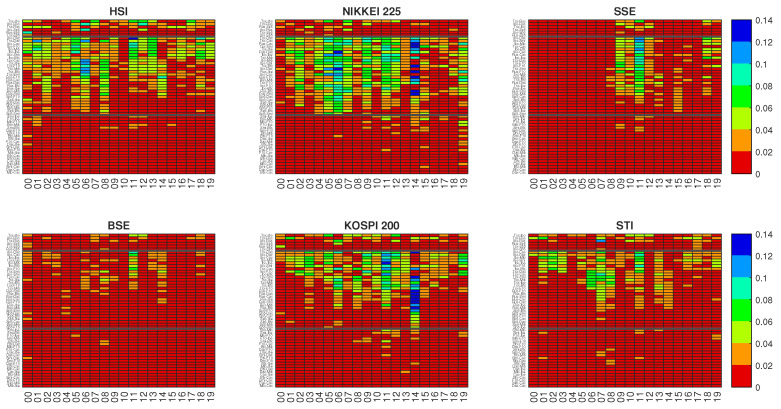
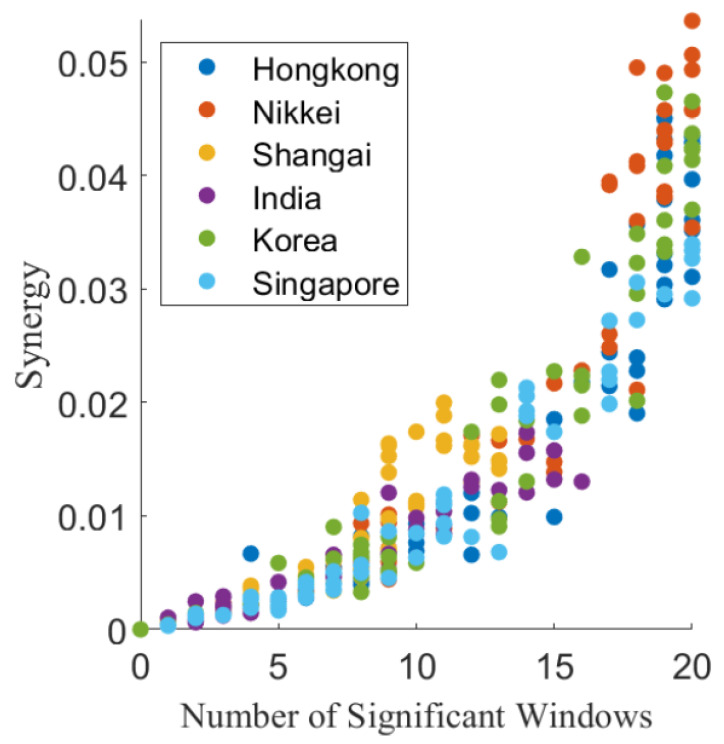
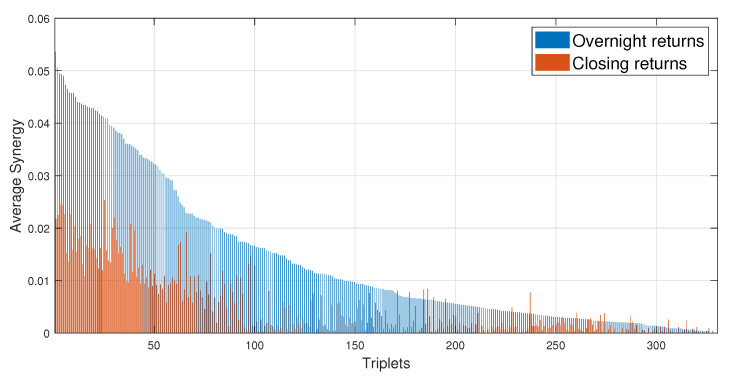
Uncovering dynamic information flow between stock market indices has been the topic of several studies which exploited the notion of transfer entropy or Granger causality, its linear version. The output of the transfer entropy approach is a directed weighted graph measuring the information about the future state of each target provided by the knowledge of the state of each driving stock market index. In order to go beyond the pairwise description of the information flow, thus looking at higher order informational circuits, here we apply the partial information decomposition to triplets consisting of a pair of driving markets (belonging to America or Europe) and a target market in Asia. Our analysis, on daily data recorded during the years 2000 to 2019, allows the identification of the synergistic information that a pair of drivers carry about the target. By studying the influence of the closing returns of drivers on the subsequent overnight changes of target indexes, we find that (i) Korea, Tokyo, Hong Kong, and Singapore are, in order, the most influenced Asian markets; (ii) US indices SP500 and Russell are the strongest drivers with respect to the bivariate Granger causality; and (iii) concerning higher order effects, pairs of European and American stock market indices play a major role as the most synergetic three-variables circuits. Our results show that the Synergy, a proxy of higher order predictive information flow rooted in information theory, provides details that are complementary to those obtained from bivariate and global Granger causality, and can thus be used to get a better characterization of the global financial system.
Overview
The claims and statistics of this paper haven’t been checked yet.
Run the check — free, no account needed. It reads the open-access text and checks the sources it cites.
Integrity signals
Registry
Cites
Statistics
Figures
Verification
Claims the paper makes
The claims and statistics of this paper haven’t been checked yet.
Run the check — free, no account needed. It reads the open-access text and checks the sources it cites.
Claims other papers make about this one
Each is checked against this paper’s own text: does it say what the citing paper says it does?
In the citing paper
“our work could be readily applied more widely, as PID using the discrete or Gaussian estimators studied here are often employed in real-data analyses in non-neuroscience fields”
From Sampling bias corrections for discrete and Gaussian partial information decompositions (2026) · cites this paper as [103]
Self-check
Percentages, sums and reported differences re-computed from the paper’s own numbers.
The self-check needs the paper’s full text.
Citations
Cites
No references could be resolved yet.
Research works printed but not linked: 41
- Wooldridge, D.P., Domanski, D., and Cobau, A. (2003). Changing Links between Mature and Emerging Financial Markets. BIS Q. Rev., Available online: https://papers.ssrn.com/sol3/papers.cfm?abstract_id=1971684.
- Chinn David, M., and Frankel, J.A. (1993). Financial Links around the Pacific Rim: 1982–1992, UC Berkeley. No. 1554-2016-132500. · DOI
- Bonanno, 2000, Taxonomy of stock market indices, Phys. Rev., E62, R7615
- Maslov, 2001, Measures of globalization based on cross-correlations of world financial indices, Phys. A Stat. Mech. Its Appl., 301, 397, 10.1016/S0378-4371(01)00370-3 · DOI
- Drozdz, 2001, Towards identifying the world stock market cross-correlations: DAX versus Dow Jones, Phys. A Stat. Mech. Its Appl., 294, 226, 10.1016/S0378-4371(01)00119-4 · DOI
- Coelho, 2007, The evolution of interdependence in world equity markets? Evidence from minimum spanning trees, Phys. A Stat. Mech. Its Appl., 376, 455, 10.1016/j.physa.2006.10.045 · DOI
- Eryigit, 2009, Network structure of cross-correlations among the world market indices, Phys. A Stat. Mech. Its Appl., 388, 3551, 10.1016/j.physa.2009.04.028 · DOI
- Song, 2011, Evolution of worldwide stock markets, correlation structure, and correlation-based graphs, Phys. Rev. E, 84, 026108, 10.1103/PhysRevE.84.026108 · DOI
- Sandoval, 2012, Correlation of financial markets in times of crisis, Phys. A Stat. Mech. Its Appl., 391, 187, 10.1016/j.physa.2011.07.023 · DOI
- Agbloyor, 2013, Exploring the causality links between financial markets and foreign direct investment in Africa, Res. Int. Bus. Financ., 28, 118, 10.1016/j.ribaf.2012.11.001 · DOI
- Schreiber, 2000, Measuring information transfer, Phys. Rev. Lett., 85, 461, 10.1103/PhysRevLett.85.461 · DOI
- Marschinski, 2002, Analysing the information flow between financial time series, Eur. Phys. J. B Condens. Matter Complex Syst., 30, 275, 10.1140/epjb/e2002-00379-2 · DOI
- Baek, S.K., Jung, W.S., Kwon, O., and Moon, H.T. (2005). Transfer entropy analysis of the stock market. arXiv.
- Kwon, 2008, Information flow between composite stock index and individual stocks, Phys. A Stat. Mech. Its Appl., 387, 2851, 10.1016/j.physa.2008.01.007 · DOI
- Kwon, 2008, Information flow between stock indices, EPL Europhys. Lett., 82, 68003, 10.1209/0295-5075/82/68003 · DOI
- Jizba, 2012, Rényi’s information transfer between financial time series, Phys. A Stat. Mech. Its Appl., 391, 2971, 10.1016/j.physa.2011.12.064 · DOI
- Dimpfl, 2014, The impact of the financial crisis on transatlantic information flows: An intraday analysis, J. Int. Financ. Mark. Inst. Money, 31, 1, 10.1016/j.intfin.2014.03.004 · DOI
- Sandoval, 2014, Structure of a global network of financial companies based on transfer entropy, Entropy, 16, 4443, 10.3390/e16084443 · DOI
- Zhou, 2017, Immediate causality network of stock markets, EPL Europhys. Lett., 121, 48002, 10.1209/0295-5075/121/48002 · DOI
- Bossomaier, 2018, Information flow around stock market collapse, Account. Financ., 58, 45, 10.1111/acfi.12390 · DOI
- Yue, P., Fan, Y., Batten, J.A., and Zhou, W.X. (2020). Information transfer between stock market sectors: A comparison between the USA and China. Entropy, 22. · DOI
- Bossomaier, T., Barnett, L., Harré, M., and Lizier, J.T. (2016). An Introduction to Tranfer Entropy, Springer. · DOI
- Granger, 1969, Investigating causal relations by econometric models and cross-spectral methods, Econom. J. Econom. Soc., 37, 424
- Barnett, 2009, Granger causality and transfer entropy are equivalent for Gaussian variables, Phys. Rev. Lett., 103, 238701, 10.1103/PhysRevLett.103.238701 · DOI
- Billio, 2012, Econometric measures of connectedness and systemic risk in the finance and insurance sectors, J. Financ. Econ., 104, 535, 10.1016/j.jfineco.2011.12.010 · DOI
- 2015, Granger causality stock market networks: Temporal proximity and preferential attachment, Phys. A Stat. Mech. Its Appl., 427, 262, 10.1016/j.physa.2015.02.017 · DOI
- Papana, 2017, Financial networks based on Granger causality: A case study, Phys. A Stat. Mech. Its Appl., 482, 65, 10.1016/j.physa.2017.04.046 · DOI
- Tang, 2019, How do the global stock markets Influence one another? Evidence from finance big data and granger causality directed network, Int. J. Electron. Commer., 23, 85, 10.1080/10864415.2018.1512283 · DOI
- Lizier, J.T., Bertschinger, N., Jost, J., and Wibral, M. (2018). Information Decomposition of Target Effects from Multi-Source Interactions: Perspectives on Previous, Current and Future Work. Entropy, 20. · DOI
- Bertschinger, 2014, Quantifying unique information, Entropy, 16, 2161, 10.3390/e16042161 · DOI · Paper page
- Stramaglia, 2014, Synergy and redundancy in the Granger causal analysis of dynamical networks, New J. Phys., 16, 105003, 10.1088/1367-2630/16/10/105003 · DOI
- Stramaglia, 2012, Expanding the transfer entropy to identify information circuits in complex systems, Phys. Rev. E, 86, 066211, 10.1103/PhysRevE.86.066211 · DOI
- Faes, L., Marinazzo, D., and Stramaglia, S. (2017). Multiscale Information Decomposition: Exact Computation for Multivariate Gaussian Processes. Entropy, 19. · DOI
- Marinazzo, 2019, Synergy as a warning sign of transitions: The case of the two-dimensional Ising model, Phys. Rev. E, 99, 040101, 10.1103/PhysRevE.99.040101 · DOI
- Krohova, J., Faes, L., Czippelova, B., Turianikova, Z., Mazgutova, N., Pernice, R., Busacca, A., Marinazzo, D., Stramaglia, S., and Javorka, M. (2019). Multiscale Information Decomposition Dissects Control Mechanisms of Heart Rate Variability at Rest and During Physiological Stress. Entropy, 21. · DOI
- Camino-Pontes, B., Diez, I., Jimenez-Marin, A., Rasero, J., Erramuzpe, A., Bonifazi, P., Stramaglia, S., Swinnen, S., and Cortes, J.M. (2018). Interaction Information Along Lifespan of the Resting Brain Dynamics Reveals a Major Redundant Role of the Default Mode Network. Entropy, 20. · DOI
- Boonstra, 2019, Information decomposition of multichannel EMG to map functional interactions in the distributed motor system, NeuroImage, 202, 116093, 10.1016/j.neuroimage.2019.116093 · DOI
- Geweke, 1982, Measurement of linear dependence and feedback between multiple time series, J. Am. Stat. Assoc., 77, 304, 10.1080/01621459.1982.10477803 · DOI · Paper page
- Marinazzo, 2008, Kernel method for nonlinear Granger causaliy, Phys. Rev. Lett., 100, 144103, 10.1103/PhysRevLett.100.144103 · DOI
- Schreiber, 1996, Improved Surrogate Data for Nonlinearity Tests, Phys. Rev. Lett., 77, 636, 10.1103/PhysRevLett.77.635 · DOI
- Barrett, 2015, Exploration of synergistic and redundant information sharing in static and dynamical Gaussian systems, Phys. Rev. E, 91, 052802, 10.1103/PhysRevE.91.052802 · DOI
Cited by
Sorted by citations
Sampling bias corrections for discrete and Gaussian partial information decompositions
Lorenz, G. M., Engel, N. M., Koçillari, L., Celotto, M., Orsenigo, D., Curreli, S., Malerba, S. B., Engel, A. K., Kayser, C., Fellin, T., et al. (2026) · Patterns · doi:10.1016/j.patter.2026.101619 · Cited by 9
Metadata
- Authors
- Scagliarini, T., Faes, L., Marinazzo, D., Stramaglia, S., & Mantegna, R. N.
- Affiliations
- Dipartimento Interateneo di Fisica, Universitá Degli Studi di Bari Aldo Moro, 70126 Bari, Italy
- Dipartimento di Ingegneria, Universitá di Palermo, 90128 Palermo, Italy
- Data Analysis Department, Ghent University, 9000 Ghent, Belgium
- Dipartimento di Fisica e Chimica, Universitá di Palermo, 90123 Palermo, Italy
- Venue
- Entropy
- Publisher
- MDPI AG
- Published
- 2020-09-08
- Volume
- 22
- Issue
- 9
- Pages
- 1000
- ISSN
- 1099-4300
- PMC
- PMC7597073
- Cited by
- 16
- References
- 0
- Language
- en
- Funders
- Ministero dell’Istruzione, dell’Università e della Ricerca (PRIN 2017WZFTZP "Stochastic forecasting in complex systems”)
About these checks
Registry, retraction, Cites and statistics results are computed, not judged, with one exception: a printed reference that no index lists is read once by a model before it counts as a citation error. Claims are extracted by a model and kept only when their quote appears verbatim in the text; each cited source is then checked, with a model’s help, for whether it says what the claim relies on. Those verdicts can be wrong — read the claim’s quote and the cited source before relying on one.
Statistics and arithmetic are recomputed, not judged.
Confidence bands are shown only for fields calibrated on our annotated test set. None is calibrated yet, so no band is shown.
What counts as a claim ›How we measure confidence ›How we check this ›
Are you an author, or do you see a problem with this page? Request a review
How to cite
Cite CoChat for the checks on this page, and the paper for its own findings.
- This page
- CoChat. (2026). Citation check: Synergistic Information Transfer in the Global System of Financial Markets. https://app.cochat.ai/papers/10.3390/e22091000
- The paper
- Scagliarini, T., Faes, L., Marinazzo, D., Stramaglia, S., & Mantegna, R. N. (2020). Synergistic Information Transfer in the Global System of Financial Markets. Entropy. https://doi.org/10.3390/e22091000
