

Computed Tomography-Derived Sarcopenia and Two- Versus Three-Dimensional Body Composition for Prognostication in Colorectal Cancer Patients Receiving Chemoradiotherapy: An Automated Deep Learning Segmentation Study with External Reproducibility Assessment
Open accessThe DOI matches its Crossref record; 55 of the 55 references it cites were found in a registry or an index; none of the 89 sources its claims cite is checked for support yet.
Abstract
Background: Skeletal muscle depletion predicts poor outcomes in gastrointestinal cancers, but whether volumetric three-dimensional (3D) body composition adds anything over the standard two-dimensional (2D) single-slice approach in colorectal cancer (CRC) patients receiving chemoradiotherapy is unclear. We quantified CT-derived sarcopenia and directly compared 2D and 3D body composition metrics from a fully automated deep learning pipeline. Methods: We retrospectively analyzed 368 patients with CRC. Body composition was quantified automatically from CT using SMAT-BC, a pipeline combining TotalSegmentator-based vertebral localization with an nnU-Net Residual Encoder XL network incorporating a Transformer bottleneck for four-class tissue segmentation. Single-slice L3 (2D) and L1–L5 volumetric (3D) indices were derived. The primary endpoint was overall survival (OS); recurrence-free survival (RFS) was secondary. Cox proportional hazards models with bootstrap optimism correction were used. Measurement reproducibility was assessed in 25 external TCGA-COAD cases. Results: Sarcopenia was strongly associated with both overall and recurrence-free survival (unadjusted OS HR 2.16, 95% CI 1.55–3.00; unadjusted RFS HR 1.83, 95% CI 1.36–2.47; both raw p < 0.001; adjusted OS HR 1.89, 95% CI 1.57–2.28; adjusted RFS HR 1.44, 95% CI 1.22–1.70; FDR-adjusted p < 0.0001 for both). L3 single-slice indices were strongly correlated with volumetric indices (r = 0.91 for muscle index) and added discriminant value over the clinical model for overall survival (optimism-corrected C-index: clinical 0.602 (95% CI 0.578–0.626), clinical + 2D 0.631 (95% CI 0.609–0.654), clinical + 3D 0.599 (95% CI 0.574–0.624); DeLong p = 0.002 for clinical + 2D vs. clinical, FDR-adjusted p = 0.006). The 2D- and 3D-augmented models yielded overlapping bootstrap confidence intervals and were not clinically meaningfully different in this cohort (OS ΔC = +0.032, 95% CI +0.013 to +0.051; FDR-adjusted p = 0.006; RFS ΔC = +0.008, 95% CI −0.011 to +0.027; FDR-adjusted p = 0.612). Conclusions: Automated CT-derived sarcopenia is an independent predictor of survival in CRC patients receiving chemoradiotherapy. In our cohort, single-slice L3 measurement matched or exceeded volumetric discrimination, but the 2D- and 3D-augmented models yielded overlapping bootstrap confidence intervals for both endpoints: for overall survival, the DeLong FDR-adjusted p value for the 2D-versus-3D contrast was 0.006, and 0.612 for recurrence-free survival. Because no non-inferiority margin was pre-specified, the 2D–3D comparison is presented as exploratory, and we make no formal claim of non-inferiority or equivalence for either endpoint. The findings support single-slice L3 measurement as an efficient biomarker for risk stratification but warrant external validation in larger prospectively designed cohorts.
Overview
CoChat Summary
TL;DR
In 368 colorectal cancer patients receiving chemoradiotherapy, fully automated CT-derived sarcopenia independently predicted worse overall and recurrence-free survival. Single-slice L3 body composition matched or exceeded volumetric L1–L5 discrimination in this cohort, but the 2D-versus-3D comparison was exploratory and external assessment was limited to measurement reproducibility in 25 TCGA-COAD cases.
Key findings
- Sarcopenia was associated with worse survival: unadjusted OS HR 2.16 (95% CI 1.55–3.00) and RFS HR 1.83 (95% CI 1.36–2.47); adjusted OS HR 1.89 (95% CI 1.57–2.28) and RFS HR 1.44 (95% CI 1.22–1.70), with FDR-adjusted p < 0.0001 for both. Five-year OS was 51.9% vs. 74.8% and five-year RFS 35.9% vs. 57.5% in sarcopenic vs. non-sarcopenic patients (log-rank p < 0.001 for both).
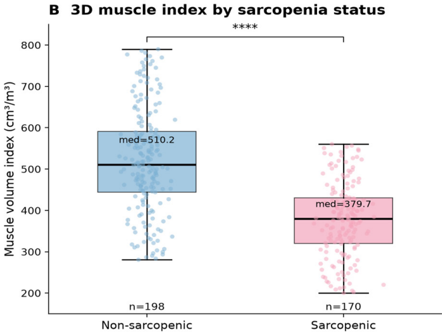
- L3 single-slice indices correlated strongly with volumetric indices: L3 muscle area vs. L1–L5 muscle volume r = 0.93, and L3 SMI vs. muscle volume index r = 0.91. For OS, optimism-corrected C-index was 0.602 (95% CI 0.578–0.626) for clinical, 0.631 (95% CI 0.609–0.654) for clinical + 2D, and 0.599 (95% CI 0.574–0.624) for clinical + 3D; clinical + 2D vs. clinical DeLong p = 0.002, FDR-adjusted p = 0.006.
- Direct 2D-versus-3D contrast: OS ΔC = +0.032 (95% CI +0.013 to +0.051; FDR-adjusted p = 0.006); RFS ΔC = +0.008 (95% CI −0.011 to +0.027; FDR-adjusted p = 0.612). The 2D- and 3D-augmented models yielded overlapping bootstrap confidence intervals, and the paper makes no formal non-inferiority or equivalence claim.
- External reproducibility in 25 TCGA-COAD cases: median SMI 45.0 cm²/m², sarcopenia prevalence 52.0%; external SMI distribution did not differ significantly from the internal cohort (Mann–Whitney p = 0.66), and L3 muscle area vs. L1–L5 muscle volume correlation was r = 0.94 (95% CI 0.86–0.97).
Methods
- Retrospective single-center study of 368 patients with histologically confirmed colorectal cancer who received chemoradiotherapy at the Second Affiliated Hospital of Zhejiang University School of Medicine between January 2015 and December 2022; primary endpoint was overall survival, secondary endpoint recurrence-free survival.
- Body composition was quantified automatically from contrast-enhanced abdominal CT using SMAT-BC, combining TotalSegmentator-based L1–L5 vertebral localization with an nnU-Net Residual Encoder XL network incorporating a Transformer bottleneck for four-class tissue segmentation; mid-L3 single-slice (2D) and L1–L5 volumetric (3D) indices were derived.
- Cox proportional hazards models with bootstrap optimism correction (500 replications), Harrell C-index, DeLong tests, and Benjamini–Hochberg FDR correction were used; measurement reproducibility was assessed in 25 external TCGA-COAD cases processed in inference-only mode.
Limitations
- Stated: retrospective single-center design with possible residual confounding; the external TCGA-COAD cohort (n = 25) was used only for measurement reproducibility, not survival prediction, and its wide correlation CI (0.86–0.97) reflects the small sample size; sarcopenia thresholds are not universally standardized and muscle strength/physical function were not assessed; clinical variable models were not penalized for number of predictors and are exploratory; no non-inferiority margin was pre-specified, so the 2D–3D comparison is exploratory.
- Stated/evident: performance status was operationalized as a binary proxy rather than formal ECOG; scanner vendor metadata was not retained for the present cohort; external-cohort per-vertebra quality-control logs were not recorded; exact training/validation/test split sizes were not recorded; regimen-specific chemotherapy data were unavailable.
- Evident: the cross-sectional design cannot directly test proposed longitudinal advantages of 3D assessment, and external prognostic validation in a larger multi-institutional cohort with linked outcomes is still needed.
Model-written summary. Check it against the paper before relying on it.
Integrity signals
Registry
Cites
Statistics
Figures




Verification
Claims the paper makes
0 Valid · 0 Not valid · 43 Not checked · 150 Own results and interpretations
A result the paper reports from its own data — it cites no other source for it, so there is none to check. The quote shows it is in the paper.
In the paper
“L3 single-slice indices were strongly correlated with volumetric indices (r = 0.91 for muscle index)”
§ Computed Tomography-Derived Sarcopenia and Two- Versus Three-Dimensional Body Composition for Prognostication in Colorectal Cancer Patients Receiving Chemoradiotherapy: An Automated Deep Learning Segmentation Study with External Reproducibility Assessment > Abstract
boostedstates an associationn = 368- Asserted: passes — The authors put it forward as true.
- Checkable: passes — It can be checked against evidence.
- Load-bearing: passes — The paper’s conclusions depend on it.
- Based: passes — The paper gives a reason why it holds.
A result the paper reports from its own data — it cites no other source for it, so there is none to check. The quote shows it is in the paper.
In the paper
“Sarcopenia was strongly associated with both overall and recurrence-free survival (unadjusted OS HR 2.16, 95% CI 1.55–3.00; unadjusted RFS HR 1.83, 95% CI 1.36–2.47; both raw p < 0.001; adjusted OS HR 1.89, 95% CI 1.57–2.28; adjusted RFS HR 1.44, 95% CI 1.22–1.70; FDR-adjusted p < 0.0001 for both).”
§ Computed Tomography-Derived Sarcopenia and Two- Versus Three-Dimensional Body Composition for Prognostication in Colorectal Cancer Patients Receiving Chemoradiotherapy: An Automated Deep Learning Segmentation Study with External Reproducibility Assessment > Abstract
boostedstates an associationn = 368- Asserted: passes — The authors put it forward as true.
- Checkable: passes — It can be checked against evidence.
- Load-bearing: passes — The paper’s conclusions depend on it.
- Based: passes — The paper gives a reason why it holds.
A result the paper reports from its own data — it cites no other source for it, so there is none to check. The quote shows it is in the paper.
In the paper
“Sarcopenia was strongly associated with both overall and recurrence-free survival (unadjusted OS HR 2.16, 95% CI 1.55–3.00; unadjusted RFS HR 1.83, 95% CI 1.36–2.47; both raw p < 0.001; adjusted OS HR 1.89, 95% CI 1.57–2.28; adjusted RFS HR 1.44, 95% CI 1.22–1.70; FDR-adjusted p < 0.0001 for both).”
§ Computed Tomography-Derived Sarcopenia and Two- Versus Three-Dimensional Body Composition for Prognostication in Colorectal Cancer Patients Receiving Chemoradiotherapy: An Automated Deep Learning Segmentation Study with External Reproducibility Assessment > Abstract
boostedstates an associationn = 368- Asserted: passes — The authors put it forward as true.
- Checkable: passes — It can be checked against evidence.
- Load-bearing: passes — The paper’s conclusions depend on it.
- Based: passes — The paper gives a reason why it holds.
A result the paper reports from its own data — it cites no other source for it, so there is none to check. The quote shows it is in the paper.
In the paper
“clinical + 3D 0.599 (95% CI 0.574–0.624)”
§ Computed Tomography-Derived Sarcopenia and Two- Versus Three-Dimensional Body Composition for Prognostication in Colorectal Cancer Patients Receiving Chemoradiotherapy: An Automated Deep Learning Segmentation Study with External Reproducibility Assessment > Abstract
plain- Asserted: passes — The authors put it forward as true.
- Checkable: passes — It can be checked against evidence.
- Load-bearing: unclear — It is unclear whether the paper’s conclusions depend on it.
- Based: passes — The paper gives a reason why it holds.
A result the paper reports from its own data — it cites no other source for it, so there is none to check. The quote shows it is in the paper.
In the paper
“added discriminant value over the clinical model for overall survival (optimism-corrected C-index: clinical 0.602 (95% CI 0.578–0.626), clinical + 2D 0.631 (95% CI 0.609–0.654), clinical + 3D 0.599 (95% CI 0.574–0.624); DeLong p = 0.002 for clinical + 2D vs. clinical, FDR-adjusted p = 0.006)”
§ Computed Tomography-Derived Sarcopenia and Two- Versus Three-Dimensional Body Composition for Prognostication in Colorectal Cancer Patients Receiving Chemoradiotherapy: An Automated Deep Learning Segmentation Study with External Reproducibility Assessment > Abstract
plainstates an association- Asserted: passes — The authors put it forward as true.
- Checkable: passes — It can be checked against evidence.
- Load-bearing: passes — The paper’s conclusions depend on it.
- Based: passes — The paper gives a reason why it holds.
81 more claims
Create a free account to see all 193 claims and to verify the 89 references still open.
- Probably not a substantial claim. 49
- It may state two separate claims as one. 73
- The quote only partly states this claim. 4
Self-check
Percentages, sums and reported differences re-computed from the paper’s own numbers.
Each contradiction between two passages listed here was confirmed by an independent check.
Rated major: it would touch a result — a value a result rests on, reported and recomputed p-values on opposite sides of the significance level, two passages that conflict with no sign which is right, or a cited work retracted before this paper was published.
In the paper
§ Computed Tomography-Derived Sarcopenia and Two- Versus Three-Dimensional Body Composition for Prognostication in Colorectal Cancer Patients Receiving Chemoradiotherapy: An Automated Deep Learning Segmentation Study with External Reproducibility Assessment > 2. Materials and Methods > 2.5. Statistical Analysis
“The observed multivariable HR of 1.88 (95% CI 1.34–2.65) for the sarcopenia–OS association lies above this threshold, indicating that the cohort was adequately powered to detect the principal reported effect. For the secondary RFS endpoint (174/368 events = 47.3%), the minimum detectable HR was approximately 1.53, which is below the observed HR of 1.57.”
§ Computed Tomography-Derived Sarcopenia and Two- Versus Three-Dimensional Body Composition for Prognostication in Colorectal Cancer Patients Receiving Chemoradiotherapy: An Automated Deep Learning Segmentation Study with External Reproducibility Assessment > 3. Results > 3.4. Uni- and Multivariable Analysis
“After multivariable adjustment, sarcopenia remained an independent predictor of OS (HR = 1.89, 95% CI: 1.57–2.28; raw p < 0.0001; FDR-adjusted p < 0.0001) and RFS (HR = 1.44, 95% CI: 1.22–1.70; raw p < 0.0001; FDR-adjusted p < 0.0001).”
Rated major: it would touch a result — a value a result rests on, reported and recomputed p-values on opposite sides of the significance level, two passages that conflict with no sign which is right, or a cited work retracted before this paper was published.
In the paper
§ Computed Tomography-Derived Sarcopenia and Two- Versus Three-Dimensional Body Composition for Prognostication in Colorectal Cancer Patients Receiving Chemoradiotherapy: An Automated Deep Learning Segmentation Study with External Reproducibility Assessment > 3. Results > 3.5. Two- Versus Three-Dimensional Body Composition
“single-slice L3 measurement yielded discrimination that was statistically indistinguishable from volumetric assessment”
§ Computed Tomography-Derived Sarcopenia and Two- Versus Three-Dimensional Body Composition for Prognostication in Colorectal Cancer Patients Receiving Chemoradiotherapy: An Automated Deep Learning Segmentation Study with External Reproducibility Assessment > 3. Results > 3.5. Two- Versus Three-Dimensional Body Composition
“for OS, the 2D-augmented model yielded a higher C-index that fell within overlapping bootstrap confidence intervals (ΔC = +0.032, 95% CI +0.013 to +0.051; raw p = 0.001, FDR-adjusted p = 0.006)”
Rated major: it would touch a result — a value a result rests on, reported and recomputed p-values on opposite sides of the significance level, two passages that conflict with no sign which is right, or a cited work retracted before this paper was published.
In the paper
§ Computed Tomography-Derived Sarcopenia and Two- Versus Three-Dimensional Body Composition for Prognostication in Colorectal Cancer Patients Receiving Chemoradiotherapy: An Automated Deep Learning Segmentation Study with External Reproducibility Assessment > 2. Materials and Methods > 2.1. Study Design and Patients
“For analytic purposes, we operationally defined “chemoradiotherapy” as the delivery of fractionated external-beam radiotherapy to the abdominal, pelvic, or abdominal–pelvic field (cumulative dose of 45.0–50.4 Gy in 25–28 fractions, 5 fractions per week)”
§ Computed Tomography-Derived Sarcopenia and Two- Versus Three-Dimensional Body Composition for Prognostication in Colorectal Cancer Patients Receiving Chemoradiotherapy: An Automated Deep Learning Segmentation Study with External Reproducibility Assessment > 2. Materials and Methods > 2.1. Study Design and Patients
“69 (18.8%) received palliative chemoradiotherapy (median RT dose: 35.0 Gy; median CT-to-RT interval: 4 days).”
Rated major: it would touch a result — a value a result rests on, reported and recomputed p-values on opposite sides of the significance level, two passages that conflict with no sign which is right, or a cited work retracted before this paper was published.
In the paper
§ Computed Tomography-Derived Sarcopenia and Two- Versus Three-Dimensional Body Composition for Prognostication in Colorectal Cancer Patients Receiving Chemoradiotherapy: An Automated Deep Learning Segmentation Study with External Reproducibility Assessment > 2. Materials and Methods > 2.5. Statistical Analysis
“Third, we treated chemotherapy exposure as a three-level categorical variable (none; fluoropyrimidine monotherapy; fluoropyrimidine + oxaliplatin)”
§ Computed Tomography-Derived Sarcopenia and Two- Versus Three-Dimensional Body Composition for Prognostication in Colorectal Cancer Patients Receiving Chemoradiotherapy: An Automated Deep Learning Segmentation Study with External Reproducibility Assessment > 2. Materials and Methods > 2.5. Statistical Analysis
“Regimen-specific stratification (fluoropyrimidine monotherapy vs. fluoropyrimidine + oxaliplatin combination therapy) could not be performed because the cohort records chemotherapy indication (neoadjuvant, adjuvant, or palliative) rather than the specific regimen administered”
Rated major: it would touch a result — a value a result rests on, reported and recomputed p-values on opposite sides of the significance level, two passages that conflict with no sign which is right, or a cited work retracted before this paper was published.
In the paper
§ Computed Tomography-Derived Sarcopenia and Two- Versus Three-Dimensional Body Composition for Prognostication in Colorectal Cancer Patients Receiving Chemoradiotherapy: An Automated Deep Learning Segmentation Study with External Reproducibility Assessment > 2. Materials and Methods > 2.1. Study Design and Patients
“the vendor-stratified radiodensity–RFS hazard ratio range and the between-stratum heterogeneity p value were deferred to a planned multi-center validation cohort because scanner vendor metadata was not retained in the source archive for the present cohort.”
§ Computed Tomography-Derived Sarcopenia and Two- Versus Three-Dimensional Body Composition for Prognostication in Colorectal Cancer Patients Receiving Chemoradiotherapy: An Automated Deep Learning Segmentation Study with External Reproducibility Assessment > 2. Materials and Methods > 2.1. Study Design and Patients
“For the four multi-detector CT scanners used during the 2015–2022 inclusion window, the actual acquisition and reconstruction parameters recorded in the picture archiving and communication system (PACS) metadata were as follows (per-scanner median values, with 5th–95th percentiles given as the range).”
1 more finding
Create a free account to see every finding of this check.
Citations
Cites
Sung, H., Ferlay, J., Siegel, R. L., Laversanne, M., Soerjomataram, I., Jemal, A., & Bray, F. (2021) · CA: A Cancer Journal for Clinicians · doi:10.3322/caac.21660 · Cited by 108,699
Sarcopenia: revised European consensus on definition and diagnosis
Cruz-Jentoft, A. J., Bahat, G., Bauer, J., Boirie, Y., Bruyère, O., Cederholm, T., Cooper, C., Landi, F., Rolland, Y., Sayer, A. A., et al. (2019) · Age and Ageing · doi:10.1093/ageing/afy169 · Cited by 13,818
nnU-Net: a self-configuring method for deep learning-based biomedical image segmentation
Isensee, F., Jaeger, P. F., Kohl, S. A. A., Petersen, J., & Maier-Hein, K. H. (2021) · Nature Methods · doi:10.1038/s41592-020-01008-z · Cited by 10,477
Sarcopenia: revised European consensus on definition and diagnosis
Cruz-Jentoft, A. J., Bahat, G., Bauer, J., Boirie, Y., Bruyère, O., Cederholm, T., Cooper, C., Landi, F., Rolland, Y., Sayer, A. A., et al. (2019) · Age and Ageing · doi:10.1093/ageing/afz046 · Cited by 3,803
Prado, C. M., Lieffers, J. R., McCargar, L. J., Reiman, T., Sawyer, M. B., Martin, L., & Baracos, V. E. (2008) · The Lancet Oncology · doi:10.1016/s1470-2045(08)70153-0 · Cited by 3,238
Segment anything in medical images
Ma, J., He, Y., Li, F., Han, L., You, C., & Wang, B. (2024) · Nature Communications · doi:10.1038/s41467-024-44824-z · Cited by 2,913 · cited 1×
“Advances in deep learning, particularly self-configuring frameworks such as nnU-Net [16] and foundation segmentation tools such as TotalSegmentator [17] and the Segment Anything Model [18], now permit fully automated, reproducible quantification of multiple tissue compartments [19–21].”
Martin, L., Birdsell, L., MacDonald, N., Reiman, T., Clandinin, M. T., McCargar, L. J., Murphy, R., Ghosh, S., Sawyer, M. B., & Baracos, V. E. (2013) · Journal of Clinical Oncology · doi:10.1200/jco.2012.45.2722 · Cited by 2,680
Mourtzakis, M., Prado, C. M. M., Lieffers, J. R., Reiman, T., McCargar, L. J., & Baracos, V. E. (2008) · Applied Physiology, Nutrition, and Metabolism · doi:10.1139/h08-075 · Cited by 2,224
Baracos, V. E., Martin, L., Korc, M., Guttridge, D. C., & Fearon, K. C. H. (2018) · Nature Reviews Disease Primers · doi:10.1038/nrdp.2017.105 · Cited by 1,738
Shen, W., Punyanitya, M., Wang, Z., Gallagher, D., St.-Onge, M.-P., Albu, J., Heymsfield, S. B., & Heshka, S. (2004) · Journal of Applied Physiology · doi:10.1152/japplphysiol.00744.2004 · Cited by 1,692
Cited by
Still being checked.
Metadata
- Authors
- Wang, D., Sui, J., Chen, J., Chen, L., Yang, Q., Wang, Y., & Lin, S.
- Affiliations
- Second Affiliated Hospital of Zhejiang University (CN)
- University of California San Diego (US)
- Corresponding author
- Wang, Da
- Lin, Shuangxiang
- Venue
- Healthcare
- Publisher
- MDPI AG
- Published
- 2026-09-04
- Volume
- 14
- Issue
- 17
- Pages
- 2846
- ISSN
- 2227-9032 (ISSN-L)
- PMC
- PMC13565101
- OpenAlex
- W7208719856
- Semantic Scholar
- 070dcd0fb452defe127e041d61266e1c4c1fb3e1
- Cited by
- 0
- References
- 53
- FWCI
- 0.00
- Type
- journal article
- Language
- en
- Open access
- gold
- doi.org
- Licence
- Locations
- Healthcare (publishedVersion, cc-by)
- PubMed Central (publishedVersion, cc-by)
- PubMed (publishedVersion)
- Funders
- National Natural Science Foundation of China (82303951)
- Noncommunicable Chronic Diseases-National Science and Technology Major Project (2023ZD0502900, 2025ZD0544500)
- Zhejiang Province Leading Geese Plan (2025C02197)
- Key Research and Development Program of Zhejiang Province (2024C03143)
- Topics
- Health Sciences › Medicine › Physiology (medical) › Nutrition and Health in Aging
- Health Sciences › Medicine › Radiology, Nuclear Medicine and Imaging › Radiomics and Machine Learning in Medical Imaging
- Health Sciences › Medicine › Physiology (medical) › Body Composition Measurement Techniques
- Keywords
- colorectal cancer, chemoradiotherapy, nnU-Net, TotalSegmentator, outcome prediction, overall survival, recurrence-free survival, measurement reproducibility, TCGA-COAD, prognostic factors
About these checks
Registry, retraction, Cites and statistics results are computed, not judged, with one exception: a printed reference that no index lists is read once by a model before it counts as a citation error. Claims are extracted by a model and kept only when their quote appears verbatim in the text; each cited source is then checked, with a model’s help, for whether it says what the claim relies on. Those verdicts can be wrong — read the claim’s quote and the cited source before relying on one.
A language model drew the claims from the paper on 2026-11-21, under version 3 of the claim definition (model deepseek-v4.1-flash, prompt extract-v3).
A second model labelled each claim on 2026-11-21 (model jev-1.13-20260917, definition revision gold-guideline-v0.2).
Statistics and arithmetic are recomputed, not judged.
Confidence bands are shown only for fields calibrated on our annotated test set. None is calibrated yet, so no band is shown.
What counts as a claim ›How we measure confidence ›How we check this ›
Are you an author, or do you see a problem with this page? Request a review
How to cite
Cite CoChat for the checks on this page, and the paper for its own findings.
- This page
- CoChat. (2026). Citation check: Computed Tomography-Derived Sarcopenia and Two- Versus Three-Dimensional Body Composition for Prognostication in Colorectal Cancer Patients Receiving Chemoradiotherapy: An Automated Deep Learning Segmentation Study with External Reproducibility Assessment. https://app.cochat.ai/papers/10.3390/healthcare14172846
- The paper
- Wang, D., Sui, J., Chen, J., Chen, L., Yang, Q., Wang, Y., & Lin, S. (2026). Computed Tomography-Derived Sarcopenia and Two- Versus Three-Dimensional Body Composition for Prognostication in Colorectal Cancer Patients Receiving Chemoradiotherapy: An Automated Deep Learning Segmentation Study with External Reproducibility Assessment. Healthcare. https://doi.org/10.3390/healthcare14172846
Data sources
Bibliographic data: Semantic Scholar, OpenAlex, Crossref.
Contains information from the Semantic Scholar Academic Graph Datasets, made available under the ODC Attribution License (ODC-BY 1.0).
Semantic Scholar’s data is described in: Kinney, R., et al. (2023). The Semantic Scholar Open Data Platform. arXiv:2301.10140.
