

The DOI matches its Crossref record.
Urban Stormwater Temperature Surges: A Central US Watershed Study
Open accessAbstract
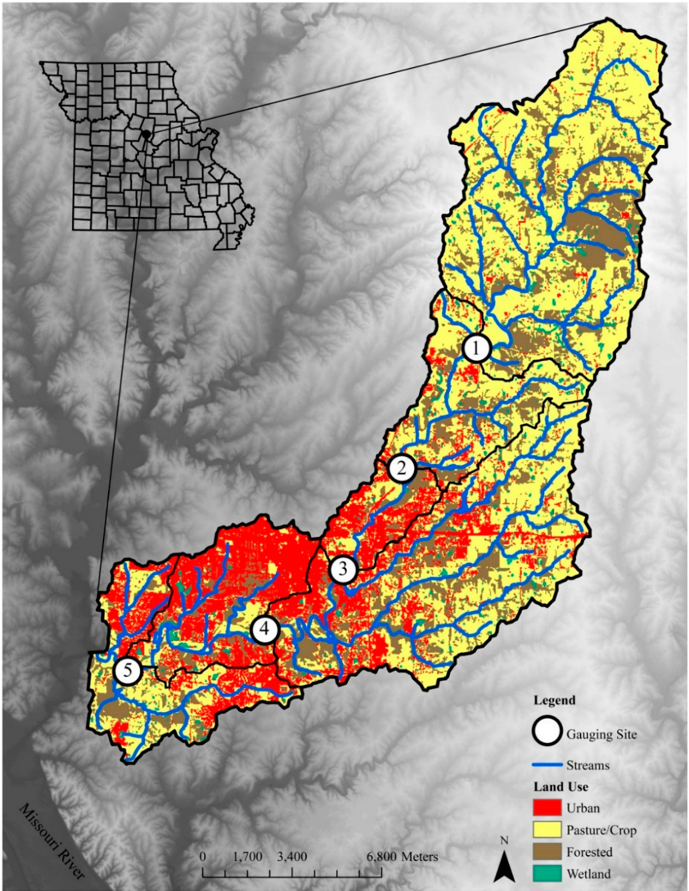
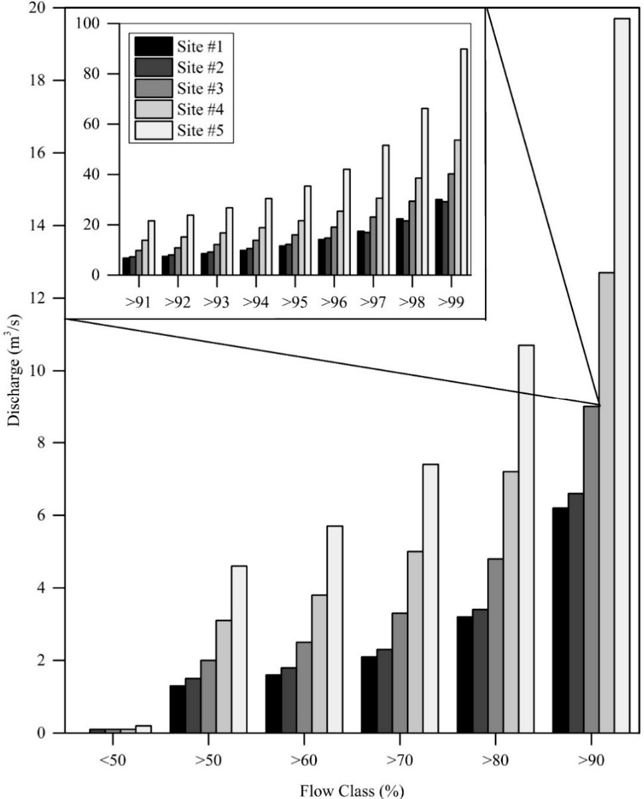
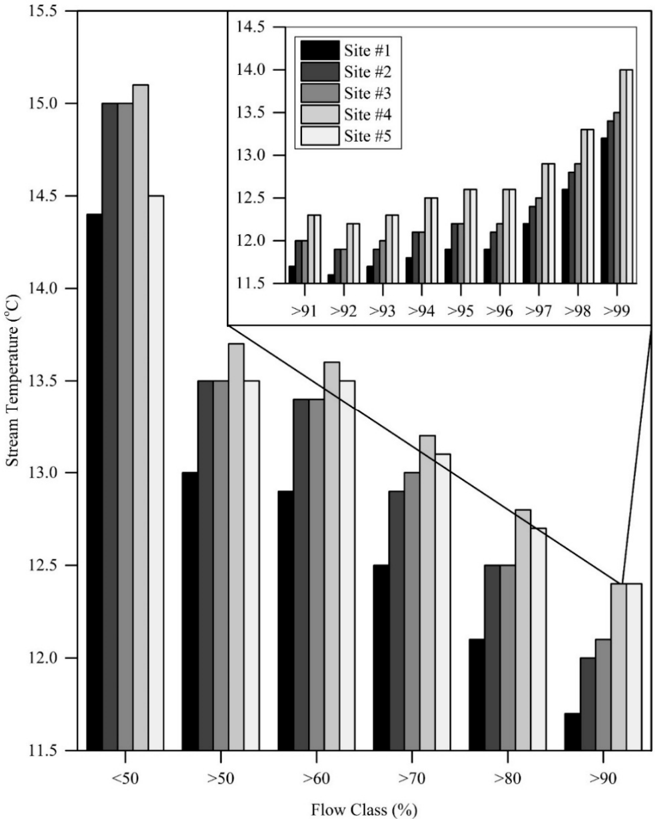
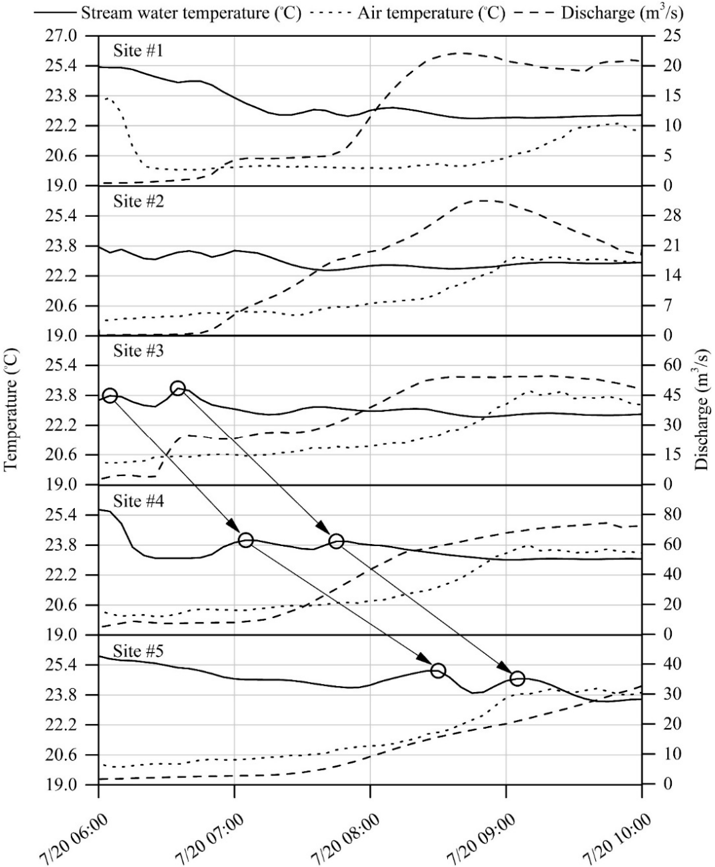
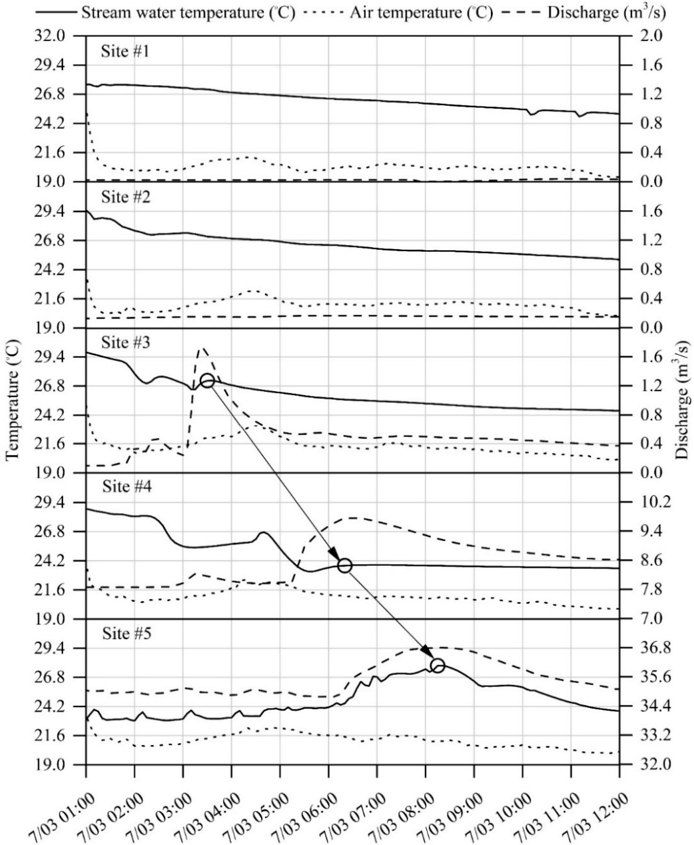
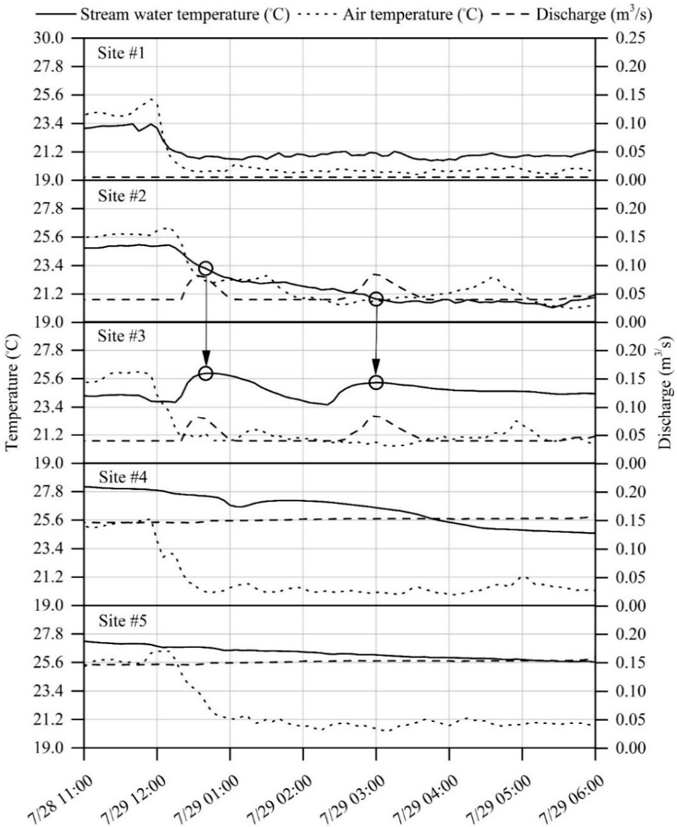
Impacts of urban land use can include increased stormwater runoff temperature (Tw) leading to receiving water quality impairment. There is therefore a need to target and mitigate sources of thermal pollution in urban areas. However, complex relationships between urban development, stormwater runoff and stream water heating processes are poorly understood. A nested-scale experimental watershed study design was used to investigate stormwater runoff temperature impacts to receiving waters in a representative mixed-use urbanizing watershed of the central US. Daily maximum Tw exceeded 35.0 °C (threshold for potential mortality of warm-water biota) at an urban monitoring site for a total of five days during the study period (2011–2013). Sudden increases of more than 1.0 °C within a 15 min time interval of Tw following summer thunderstorms were significantly correlated (CI = 95%; p < 0.01) to cumulative percent urban land use (r2 = 0.98; n = 29). Differences in mean Tw between monitoring sites were significantly correlated (CI = 95%; p = 0.02) to urban land use practices, stream distance and increasing discharge. The effects of the 2012 Midwest USA drought and land use on Tw were also observed with maximum Tw 4.0 °C higher at an urban monitoring site relative to a rural site for 10.5 h. The current work provides quantitative evidence of acute increases in Tw related to urban land use. Results better inform land managers wishing to create management strategies designed to preserve suitable thermal stream habitats in urbanizing watersheds.
Overview
The claims and statistics of this paper haven’t been checked yet.
Run the check — free, no account needed. It reads the open-access text and checks the sources it cites.
Integrity signals
Registry
Cites
Statistics
Figures
Verification
Claims the paper makes
The claims and statistics of this paper haven’t been checked yet.
Run the check — free, no account needed. It reads the open-access text and checks the sources it cites.
Claims other papers make about this one
Each is checked against this paper’s own text: does it say what the citing paper says it does?
The source backs part of the claim, not all of it — or backs it for a different population, condition or comparison.
In the citing paper
“For example, sharp and sustained temperature changes due to urban runoff from upstream impervious surfaces can impede the growth of younger fish populations (Beitinger et al., 2000; Nelson and Palmer, 1998; Zeiger and Hubbart, 2015).”
From Review of emerging contaminants in green stormwater infrastructure: antibiotic resistance genes, microplastics, tire wear particles, PFAS, and temperature (2024) · cites this paper as Zeiger and Hubbart, 2015
Experimental — accuracy not yet measured
Self-check
Percentages, sums and reported differences re-computed from the paper’s own numbers.
The self-check needs the paper’s full text.
Citations
Cites
No references could be resolved yet.
Research works printed but not linked: 33
- Caissie, 2006, The thermal regime of rivers: A review, Freshw. Biol., 51, 1389, 10.1111/j.1365-2427.2006.01597.x · DOI
- Subehi, 2010, Analysis of stream water temperature changes during rainfall events in forested watersheds, Liminology, 11, 115, 10.1007/s10201-009-0296-2 · DOI
- Webb, 2008, Recent advances in stream and river temperature research, Hydrol. Process., 22, 902, 10.1002/hyp.6994 · DOI
- Bishop, 1989, Aquatic wastewater treatment using Elodea Nuttallii, Water Pollut. Control Fed., 65, 641
- Beitinger, 2000, Temperature tolerances of North American freshwater fishes exposed to dynamic changes in temperature, Environ. Biol. Fish., 58, 237, 10.1023/A:1007676325825 · DOI · Paper page
- Cox, 2003, A review of currently available in-stream water-quality models and their applicability for simulating dissolved oxygen in lowland rivers, Sci. Total Environ., 314–316, 335, 10.1016/S0048-9697(03)00063-9 · DOI
- Ward, 1985, Thermal characteristics of running waters, Hydrobiologia, 125, 31, 10.1007/BF00045924 · DOI
- Gu, 1999, Development of weather dependent flow requirements for river temperature control, Environ. Manag., 24, 529, 10.1007/s002679900252 · DOI
- Sinokrot, 2000, In-stream flow impact on river water temperatures, J. Hydrol. Res., 38, 339, 10.1080/00221680009498315 · DOI
- Hubbart, 2014, Localized climate and surface energy flux alterations across an urban gradient in the central US, Energies, 7, 1770, 10.3390/en7031770 · DOI
- Paul, 2001, Streams in the urban landscape, Annu. Rev. Ecol. Syst., 32, 333, 10.1146/annurev.ecolsys.32.081501.114040 · DOI · Paper page
- Menberg, 2013, Long-term evolution of anthropogenic heat fluxes into a subsurface urban heat island, Environ. Sci. Technol., 47, 9747, 10.1021/es401546u · DOI
- Kurylyk, 2015, Shallow groundwater thermal sensitivity to climate change and land cover disturbances: Derivation of analytical expressions and implications for stream temperature modeling, Hydrol. Earth Syst. Sci., 19, 2469, 10.5194/hess-19-2469-2015 · DOI
- Anderson, 2011, Bank thermal storage as a sink of temperature surges in urbanized streams, J. Hydrol., 409, 525, 10.1016/j.jhydrol.2011.08.059 · DOI
- Herb, 2008, Thermal pollution of streams by runoff from paved surfaces, Hydrol. Process., 22, 987, 10.1002/hyp.6986 · DOI
- Hester, 2012, Stream and Retention pond thermal response to heated summer runoff from urban impervious surfaces, J. Am. Water Resour. Assoc., 49, 328, 10.1111/jawr.12019 · DOI
- Nelson, 2007, Stream water temperature surges under urbanization and climate change: Data, models, and responses, J. Am. Water Resour. Assoc., 43, 440, 10.1111/j.1752-1688.2007.00034.x · DOI · Paper page
- Rice, 2011, Urbanization influences on stream temperature behavior within low-discharge headwater streams, Hydrol. Res. Lett., 5, 27, 10.3178/hrl.5.27 · DOI
- Chen, 1998, Stream temperature simulation of forested riparian areas: I, Watershed-scale model development. J. Environ. Eng., 124, 304
- Sun, 2015, A spatially distributed model for the assessment of land use impacts on stream temperature in small urban watersheds, Hydrol. Process., 29, 2331, 10.1002/hyp.10363 · DOI
- Watt, 2000, Thermal enhancement of stormwater runoff by paved surfaces, Water Resour., 34, 1359
- Hubbart, 2010, Integrating science based decision making and TMDL allocations in urbanizing watersheds, Watershed Sci. Bull., 1, 19
- Zhou, 2012, Mapping and analyzing change of impervious surface for two decades using multitemporal Landsat imagery in Missouri, Int. J. Appl. Earth Observ. Geoinf., 18, 195
- Hooper, L.W. (2015). A Stream Physical Habitat Assessment in an Urbanizing Watershed of the Central USA. [Master’s Thesis, University of Missouri].
- Hubbart, 2013, Considering streamflow trend analyses uncertainty in urbanizing watersheds: A baseflow case study in the central United States, Earth Interact., 17, 1, 10.1175/2012EI000481.1 · DOI
- Hubbart, 2011, Improving Quantitative Understanding of Bottomland Hardwood Forest Influence on Soil Water Consumption in an Urban Floodplain, Watershed Sci. Bull., 3, 34
- Hubbart, 2013, A case study considering the comparability of mass and volumetric suspended sediment data, Environ. Earth Sci., 71, 4051, 10.1007/s12665-013-2788-y · DOI
- Dottori, 2009, A dynamic rating curve approach to indirect discharge measurement, Hydrol. Earth Syst. Sci., 13, 847, 10.5194/hess-13-847-2009 · DOI
- Webb, 2003, Water—Air temperature relationships in a Devon River system and the role of flow, Hydrol. Process., 17, 3069, 10.1002/hyp.1280 · DOI
- Bogan, T., Mohseni, O., and Stefan, H.G. (2003). Stream temperature-equilibrium temperature relationship. Water Resour. Res. · DOI
- Zeiger, S.J., Hubbart, J.A., Anderson, S., and Stambaugh, M. (2015). Quantifying and modeling urban stream temperature: A central US watershed study. Hydrol. Process. · DOI
- Anderson, 2010, Changes in stream temperature in response to restoration of groundwater discharge and solar heating in a culverted, urban stream, J. Hydrol., 393, 309, 10.1016/j.jhydrol.2010.08.030 · DOI
- Davis, 2005, Green engineering principles promote low-impact development, Environ. Sci. Technol., 39, 338A, 10.1021/es053327e · DOI
Cited by
Sorted by citations
Bodus, B., O'Malley, K., Dieter, G., Gunawardana, C., & McDonald, W. (2024) · Science of The Total Environment · doi:10.1016/j.scitotenv.2023.167195 · Cited by 76
Metadata
- Authors
- Zeiger, S., & Hubbart, J.
- Affiliations
- University of Missouri (US)
- Corresponding author
- Hubbart, Jason
- Venue
- Hydrology
- Publisher
- MDPI AG
- Published
- 2015-10-28
- Volume
- 2
- Issue
- 4
- Pages
- 193-209
- ISSN
- 2306-5338 (ISSN-L)
- OpenAlex
- W1870876272
- Cited by
- 39
- References
- 0
- Citations by year
- 2026: 1 · 2025: 2 · 2024: 2 · 2023: 5 · 2022: 3 · 2021: 3 · 2020: 8 · 2019: 3 · 2018: 5 · 2017: 4 · 2016: 3
- FWCI
- 2.63
- Type
- journal article
- Language
- en
- Open access
- gold
- dx.doi.org
- Licence
- Locations
- Hydrology (publishedVersion, cc-by)
- DOAJ (DOAJ: Directory of Open Access Journals) (submittedVersion)
- Funders
- U.S. Environmental Protection Agency (G08-NPS-17)
- Missouri Department of Natural Resources (G08-NPS-17)
- Missouri Department of Conservation
- Topics
- Physical Sciences › Environmental Science › Environmental Engineering › Urban Stormwater Management Solutions
- Physical Sciences › Environmental Science › Environmental Engineering › Urban Heat Island Mitigation
- Physical Sciences › Environmental Science › Water Science and Technology › Hydrology and Watershed Management Studies
- Keywords
- urban land use, stream temperature, receiving water quality, thunderstorms, urbanizing watersheds, river discharge
About these checks
Registry, retraction, Cites and statistics results are computed, not judged, with one exception: a printed reference that no index lists is read once by a model before it counts as a citation error. Claims are extracted by a model and kept only when their quote appears verbatim in the text; each cited source is then checked, with a model’s help, for whether it says what the claim relies on. Those verdicts can be wrong — read the claim’s quote and the cited source before relying on one.
Statistics and arithmetic are recomputed, not judged.
Confidence bands are shown only for fields calibrated on our annotated test set. None is calibrated yet, so no band is shown.
What counts as a claim ›How we measure confidence ›How we check this ›
Are you an author, or do you see a problem with this page? Request a review
How to cite
Cite CoChat for the checks on this page, and the paper for its own findings.
- This page
- CoChat. (2026). Citation check: Urban Stormwater Temperature Surges: A Central US Watershed Study. https://app.cochat.ai/papers/10.3390/hydrology2040193
- The paper
- Zeiger, S., & Hubbart, J. (2015). Urban Stormwater Temperature Surges: A Central US Watershed Study. Hydrology. https://doi.org/10.3390/hydrology2040193
