

The DOI matches its Crossref record; 20 of the 22 references it cites were found in a registry or an index; none of the 7 sources its claims cite is checked for support yet.
Hydrostats: A Python Package for Characterizing Errors between Observed and Predicted Time Series
Open accessAbstract
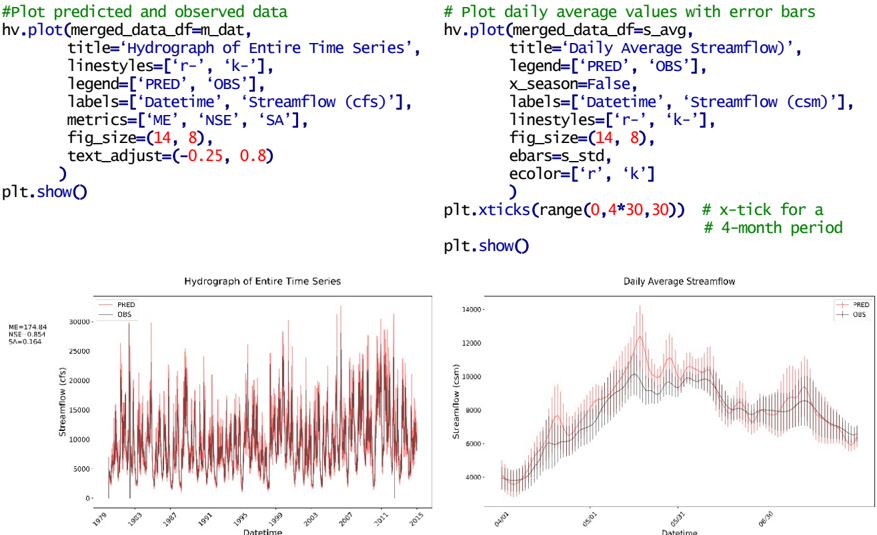
Hydrologists use a number of tools to compare model results to observed flows. These include tools to pre-process the data, data frames to store and access data, visualization and plotting routines, error metrics for single realizations, and ensemble metrics for stochastic realizations to calibrate and evaluate hydrologic models. We present an open-source Python package to help characterize predicted and observed hydrologic time series data called hydrostats which has three main capabilities: Data storage and retrieval based on the Python Data Analysis Library (pandas), visualization and plotting routines using Matplotlib, and a metrics library that currently contains routines to compute over 70 different error metrics and routines for ensemble forecast skill scores. Hydrostats data storage and retrieval functions allow hydrologists to easily compare all, or portions of, a time series. For example, it makes it easy to compare observed and modeled data only during April over a 30-year period. The package includes literature references, explanations, examples, and source code. In this note, we introduce the hydrostats package, provide short examples of the various capabilities, and provide some background on programming issues and practices. The hydrostats package provides a range of tools to make characterizing and analyzing model data easy and efficient. The electronic supplement provides working hydrostats examples.
Overview
CoChat Summary
TL;DR
Hydrostats is an open-source Python package that helps hydrologists store, subset, visualize, and quantify errors between observed and predicted time series, bundling a metrics library (HydroErr) with over 70 error metrics plus ensemble forecast skill scores. The paper is a software note introducing the package's modules and demonstrating its capabilities and code-optimization choices.
Key findings
- Hydrostats provides three main capabilities: data storage/retrieval built on pandas, visualization/plotting routines using Matplotlib, and a metrics library containing routines for over 70 error metrics plus ensemble forecast skill scores.
- The package comprises five modules: analyze, data, ens_metrics, metrics, and visual; the metrics module wraps the separately available HydroErr library.
- In a worked example, a single KGE(2012) call returned 0.8767535070958952, and a table of six metrics (MAE, r², ACC, NSE, KGE(2012), SA) over the full record and four seasons showed similar but seasonally varying values (e.g., full-record MAE 1157.67, r² 0.91, ACC 0.95, NSE 0.87, KGE 0.87, SA 0.15).
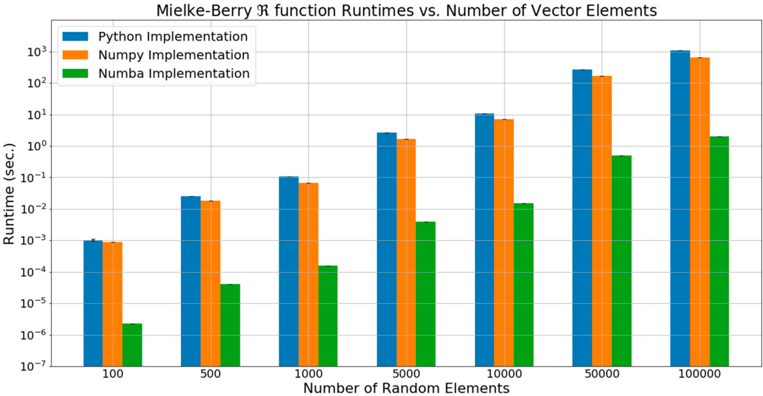
- Benchmarking the Mielke-Berry R metric (which requires a double summation) on a vector of length 1000 gave average times of 181 × 10⁻³ ± 9.13 × 10⁻³ s (Python), 120 × 10⁻³ ± 8.86 × 10⁻³ s (numpy), and 254 × 10⁻⁶ ± 7.03 × 10⁻⁶ s (numba) — speedups of ~1.5× and ~700× respectively; at length 10,000, times were 16.6, 11.3, and 24.7 × 10⁻³ s (~1.5× and ~675×).
Methods
- Design: a software package description with example code and figures, not an empirical model-evaluation study; the authors state it is "not a discussion of model calibration, error metrics, or analysis methods."
- Data/sample: illustrative examples use two .csv files of predicted and observed flow merged into a pandas DataFrame, with a seasonal subset (1 April–31 July, 1 January 1986–31 December 1992) and daily averages/standard deviations; ensemble examples use a synthetic forecast of 52 realizations over 15 time steps.
- Main analysis: demonstration of module functions (merge_data, seasonal_period, daily_average, daily_std_error, make_table, ens_crps) and a runtime benchmark of three implementations (Python double loop, numpy vectorization, numba compilation) of the Mielke-Berry R metric using timeit, benchmarked on 7.7 GB RAM and an Intel Core i5-4590 CPU @ 3.30 GHz × 4.
Limitations
- Stated: the authors chose not to implement numba versions in the library because the large speedup only occurs for double loops (only a few metrics require them), and requiring numba would add a dependency; documentation instead gives directions for users to modify code to use numba.
- Stated: for shorter vectors (less than 1000) the time difference between implementations may not be significant.
- Evident from the text: the paper is a software note with illustrative examples rather than a validation study — the reported metric values (e.g., KGE 0.8767, the seasonal metric table) come from example data and are not presented as substantive hydrologic findings; the ensemble CRPS example uses synthetic random data.
Model-written summary. Check it against the paper before relying on it.
Integrity signals
Registry
Cites
Statistics
Figures
Verification
Claims the paper makes
0 Valid · 4 Not valid · 4 Not checked · 34 Own results and interpretations
A result the paper states — it cites no source for it, so there is none to check. The quote shows it is in the paper.
In the paper
“We present an open-source Python package to help characterize predicted and observed hydrologic time series data called hydrostats which has three main capabilities”
- Also stated in: § 1. Introduction · plain
“Hydrostats is an open-source software package designed to support hydrologic model evaluation.”
§ Hydrostats: A Python Package for Characterizing Errors between Observed and Predicted Time Series > Abstract
plain- Asserted: passes — The authors put it forward as true.
- Checkable: passes — It can be checked against evidence.
- Load-bearing: passes — The paper’s conclusions depend on it.
- Based: passes — The paper gives a reason why it holds.
- Rests on an assumption not shown here.
- Also stated in: § 1. Introduction · plain
A result the paper reports from its own data — it cites no other source for it, so there is none to check. The quote shows it is in the paper.
In the paper
“As the vector length increases, the numpy version performs faster than the Python version, about 2× to 5× as the vector length increases.”
plainstates a cause- Asserted: passes — The authors put it forward as true.
- Checkable: passes — It can be checked against evidence.
- Load-bearing: unclear — It is unclear whether the paper’s conclusions depend on it.
- Based: passes — The paper gives a reason why it holds.
A result the paper states — it cites no source for it, so there is none to check. The quote shows it is in the paper.
In the paper
“This level of speed up only occurs for double loops and only a few of the error metrics require double loops for implementation.”
plain- Asserted: passes — The authors put it forward as true.
- Checkable: passes — It can be checked against evidence.
- Load-bearing: passes — The paper’s conclusions depend on it.
- Based: passes — The paper gives a reason why it holds.
A result the paper states — it cites no source for it, so there is none to check. The quote shows it is in the paper.
In the paper
“Single loops optimize well with numpy implementations.”
boostedstates a cause- Asserted: passes — The authors put it forward as true.
- Checkable: passes — It can be checked against evidence.
- Load-bearing: passes — The paper’s conclusions depend on it.
- Based: passes — The paper gives a reason why it holds.
A result the paper reports from its own data — it cites no other source for it, so there is none to check. The quote shows it is in the paper.
In the paper
“This level of speed up only occurs for double loops and only a few of the error metrics require double loops for implementation.”
plainstates a cause- Asserted: passes — The authors put it forward as true.
- Checkable: passes — It can be checked against evidence.
- Load-bearing: passes — The paper’s conclusions depend on it.
- Based: passes — The paper gives a reason why it holds.
2 more claims
Create a free account to see all 42 claims and to verify the 7 references still open.
- Probably not a substantial claim. 24
- It may state two separate claims as one. 20
- The quote only partly states this claim. 2
Self-check
Percentages, sums and reported differences re-computed from the paper’s own numbers.
Each contradiction between two passages listed here was confirmed by an independent check.
Rated minor: it would not touch a result — a value no result rests on, a p-value that stays on the same side of the significance level, or a conflict that is clerical, resolved elsewhere in the paper, or outside its own findings.
In the paper
§ Calculating the Kling-Gupta efficiency (KGE2012) metric hs.kge_2012(Pred,Obs) # separate vectors from data frame This returns 0.8767535070958952 # Calculating a table of different metrics for different periods hs.make_table(merged_dataframe=m.dat,metrics=['MAE', 'r2′, 'ACC', 'NSE', 'KGE (2012)', 'SA'], seasonal_periods=[['01-01′,'03-31′],['04-01′,'06-30′],['07-01′,'09-30′],['10-01′,'12-31′]], remove_neg=True, remove_zero=True, location='Magdalena') This returns Location MAE r2 ACC NSE KGE(2012) SA Full Time Series Magdalena 1157.67 0.91 0.95 0.87 0.87 0.15 Jan-01:Mar-31 Magdalena 631.98 0.89 0.94 0.86 0.86 0.16 April-01:June-30 Magdalena 1394.64 0.88 0.94 0.81 0.88 0.15 July-01:Sept-30 Magdalena 1188.54 0.88 0.94 0.83 0.83 0.15 Oct-01:Dec-31 Magdalena 1410.85 0.86 0.93 0.79 0.79 0.14 Figure 4. Presents a code example and results of calling a single error metric (top portion) and creating a table with six different error metrics over four different seasons or time periods.This shows that while the metric values are similar, the different seasons behave differently. > 2.8. Code Optimization
“then extracts the data from April 1 to July 31 from the period January 1, 1986 through December 31, 1994.”
§ Hydrostat dependencies import pandas as pd import numpy as np import matplotlib.pyplotas plt # Hydrostat modules import hydrostats as hs import hydrostats.dataas hd import hydrostats.visualas hv > 2.4. Pre-Processing (hydrostats.data)
“time_range=['1986-01-01′,'1992-12-31′]”
Rated minor: it would not touch a result — a value no result rests on, a p-value that stays on the same side of the significance level, or a conflict that is clerical, resolved elsewhere in the paper, or outside its own findings.
In the paper
§ Hydrostat dependencies import pandas as pd import numpy as np import matplotlib.pyplotas plt # Hydrostat modules import hydrostats as hs import hydrostats.dataas hd import hydrostats.visualas hv > 2.5. Visualization (hydrostats.visualization)
“Figure 3 shows a code snippet that plots the predicted and observed seasonal values from 1980 to 2015 that were loaded in Figure 2”
§ Hydrostat dependencies import pandas as pd import numpy as np import matplotlib.pyplotas plt # Hydrostat modules import hydrostats as hs import hydrostats.dataas hd import hydrostats.visualas hv > 2.4. Pre-Processing (hydrostats.data)
“that only includes data for 1 April through 31 July for the period 1 January 1986 to 31 December 1992.”
Rated minor: it would not touch a result — a value no result rests on, a p-value that stays on the same side of the significance level, or a conflict that is clerical, resolved elsewhere in the paper, or outside its own findings.
In the paper
§ Hydrostat dependencies import pandas as pd import numpy as np import matplotlib.pyplotas plt # Hydrostat modules import hydrostats as hs import hydrostats.dataas hd import hydrostats.visualas hv > 2.6. Error Metrics (hydrostats.metrics)
“The Python error functions have four flags: replace_nan, replace_inf, remove_neg, and remove_zero.”
§ Hydrostat dependencies import pandas as pd import numpy as np import matplotlib.pyplotas plt # Hydrostat modules import hydrostats as hs import hydrostats.dataas hd import hydrostats.visualas hv > 2.6. Error Metrics (hydrostats.metrics)
“The replace_neg and replace_inf flags provide values used to replace any instances of these entries”
Rated minor: it would not touch a result — a value no result rests on, a p-value that stays on the same side of the significance level, or a conflict that is clerical, resolved elsewhere in the paper, or outside its own findings.
In the paper
§ Hydrostat dependencies import pandas as pd import numpy as np import matplotlib.pyplotas plt # Hydrostat modules import hydrostats as hs import hydrostats.dataas hd import hydrostats.visualas hv > 2.4. Pre-Processing (hydrostats.data)
“any of the 60 error metrics included in the hydrostats package”
§ Hydrostat dependencies import pandas as pd import numpy as np import matplotlib.pyplotas plt # Hydrostat modules import hydrostats as hs import hydrostats.dataas hd import hydrostats.visualas hv > 2.6. Error Metrics (hydrostats.metrics)
“The hydrostats.metrics module is a wrapper module for the Python HydroErr package, which is available separately.This module gives users access to over 70 error metrics from the hydrologic literature.”
Citations
Cites
Matplotlib: a 2D graphics environment
Hunter, J. D. (2007) · Computing in Science & Engineering · doi:10.1109/mcse.2007.55 · Cited by 39,249
DeLong, E. R., DeLong, D. M., & Clarke-Pearson, D. L. (1988) · Biometrics · doi:10.2307/2531595 · Cited by 22,649
Data Structures for Statistical Computing in Python
McKinney, W. (2010) · Proceedings of the Python in Science Conference · doi:10.25080/majora-92bf1922-00a · Cited by 11,032
The NumPy Array: A Structure for Efficient Numerical Computation
van der Walt, S., Colbert, S. C., & Varoquaux, G. (2011) · Computing in Science & Engineering · doi:10.1109/mcse.2011.37 · Cited by 9,381
Willmott, C., & Matsuura, K. (2005) · Climate Research · doi:10.3354/cr030079 · Cited by 7,958 · cited 1×
“…these speed ups we will use the Mielke–Berry R error metric [28] as this error metric requires a double summation as shown in Equation (1). where MAE (mean absolute error) [29] is: In Equations (1) and (2), n is the number of data points, x is the observed flow, and y is the predicted flow.”
MethodStrictly Proper Scoring Rules, Prediction, and Estimation
Gneiting, T., & Raftery, A. E. (2007) · Journal of the American Statistical Association · doi:10.1198/016214506000001437 · Cited by 5,793
Jupyter Notebooks – a publishing format for reproducible computational workflows
Thomas, K., Benjamin, R.-K., Fernando, P., Brian, G., Matthias, B., Jonathan, F., Kyle, K., Jessica, H., Jason, G., Sylvain, C., et al. (2016) · Positioning and Power in Academic Publishing: Players, Agents and Agendas · doi:10.3233/978-1-61499-649-1-87 · Cited by 3,063
Comparison of different efficiency criteria for hydrological model assessment
Krause, P., Boyle, D. P., & Bäse, F. (2005) · Advances in Geosciences · doi:10.5194/adgeo-5-89-2005 · Cited by 2,809
Runoff conditions in the upper Danube basin under an ensemble of climate change scenarios
Kling, H., Fuchs, M., & Paulin, M. (2012) · Journal of Hydrology · doi:10.1016/j.jhydrol.2012.01.011 · Cited by 1,676
Numba: a LLVM-based Python JIT compiler
Lam, S. K., Pitrou, A., & Seibert, S. (2015) · Proceedings of the Second Workshop on the LLVM Compiler Infrastructure in HPC · doi:10.1145/2833157.2833162 · Cited by 1,514
Cited by
Jackson, E. K., Roberts, W., Nelsen, B., Williams, G. P., Nelson, E. J., & Ames, D. P. (2019) · Environmental Modelling & Software · doi:10.1016/j.envsoft.2019.05.001 · Cited by 213
Self-citationDesigning Deep-Based Learning Flood Forecast Model With ConvLSTM Hybrid Algorithm
Moishin, M., Deo, R. C., Prasad, R., Raj, N., & Abdulla, S. (2021) · IEEE Access · doi:10.1109/access.2021.3065939 · Cited by 199
Apaydın, H., Sattari, M. T., Falsafian, K., & Prasad, R. (2021) · Journal of Hydrology · doi:10.1016/j.jhydrol.2021.126506 · Cited by 165
When best is the enemy of good – critical evaluation of performance criteria in hydrological models
Cinkus, G., Mazzilli, N., Jourde, H., Wünsch, A., Liesch, T., Ravbar, N., Chen, Z., & Goldscheider, N. (2023) · Hydrology and earth system sciences · doi:10.5194/hess-27-2397-2023 · Cited by 116
Long-Term Groundwater Level Prediction Model Based on Hybrid KNN-RF Technique
Kombo, O. H., Kumaran, S., Sheikh, Y. H., Bovim, A., & Jayavel, K. (2020) · Hydrology · doi:10.3390/hydrology7030059 · Cited by 112
Metadata
- Authors
- Roberts, W., Williams, G. P., Jackson, E., Nelson, E. J., & Ames, D. P.
- Affiliations
- Brigham Young University (US)
- Corresponding author
- Williams, Gustavious P.
- Venue
- Hydrology
- Publisher
- MDPI AG
- Published
- 2018-12-02
- Volume
- 5
- Issue
- 4
- Pages
- 66
- ISSN
- 2306-5338 (ISSN-L)
- OpenAlex
- W2902790723
- Cited by
- 85
- References
- 22
- Citations by year
- 2026: 8 · 2025: 11 · 2024: 13 · 2023: 18 · 2022: 13 · 2021: 10 · 2020: 8 · 2019: 4
- Type
- software paper
- Language
- en
- Open access
- gold
- doi.org
- Licence
- Locations
- Hydrology (publishedVersion, cc-by)
- DOAJ (DOAJ: Directory of Open Access Journals) (submittedVersion)
- Funders
- SERVIR, NASA Applied Sciences Program (NNX16AN45G)
- Topics
- Physical Sciences › Environmental Science › Water Science and Technology › Hydrology and Watershed Management Studies
- Physical Sciences › Environmental Science › Management, Monitoring, Policy and Law › Environmental Monitoring and Data Management
- Physical Sciences › Computer Science › Software › Computational Physics and Python Applications
- Keywords
- Python library, hydrologic model evaluation, error metrics, hydrological model calibration, open source software, river discharge
About these checks
Registry, retraction, Cites and statistics results are computed, not judged, with one exception: a printed reference that no index lists is read once by a model before it counts as a citation error. Claims are extracted by a model and kept only when their quote appears verbatim in the text; each cited source is then checked, with a model’s help, for whether it says what the claim relies on. Those verdicts can be wrong — read the claim’s quote and the cited source before relying on one.
A language model drew the claims from the paper on 2026-11-18, under version 3 of the claim definition (model deepseek-v4.1-flash, prompt extract-v3).
A second model labelled each claim on 2026-11-18 (model jev-1.13-20260917, definition revision gold-guideline-v0.2).
Statistics and arithmetic are recomputed, not judged.
Confidence bands are shown only for fields calibrated on our annotated test set. None is calibrated yet, so no band is shown.
What counts as a claim ›How we measure confidence ›How we check this ›
Are you an author, or do you see a problem with this page? Request a review
How to cite
Cite CoChat for the checks on this page, and the paper for its own findings.
- This page
- CoChat. (2026). Citation check: Hydrostats: A Python Package for Characterizing Errors between Observed and Predicted Time Series. https://app.cochat.ai/papers/10.3390/hydrology5040066
- The paper
- Roberts, W., Williams, G. P., Jackson, E., Nelson, E. J., & Ames, D. P. (2018). Hydrostats: A Python Package for Characterizing Errors between Observed and Predicted Time Series. Hydrology. https://doi.org/10.3390/hydrology5040066
Data sources
Bibliographic data: Semantic Scholar, OpenAlex, Crossref.
Contains information from the Semantic Scholar Academic Graph Datasets, made available under the ODC Attribution License (ODC-BY 1.0).
Semantic Scholar’s data is described in: Kinney, R., et al. (2023). The Semantic Scholar Open Data Platform. arXiv:2301.10140.
