

The DOI matches its Crossref record; 70 of the 71 references it cites were found in a registry or an index; none of the 16 sources its claims cite is checked for support yet.
SABER: A Model-Agnostic Postprocessor for Bias Correcting Discharge from Large Hydrologic Models
Open accessAbstract
Hydrologic modeling is trending toward larger spatial and temporal domains, higher resolutions, and less extensive local calibration and validation. Thorough calibration and validation are difficult because the quantity of observations needed for such scales do not exist or is inaccessible to modelers. We present the Stream Analysis for Bias Estimation and Reduction (SABER) method for bias correction targeting large models. SABER is intended for model consumers to apply to a subset of a larger domain at gauged and ungauged locations and address issues with data size and availability. SABER extends frequency-matching postprocessing techniques using flow duration curves (FDC) at gauged subbasins to be applied at ungauged subbasins using clustering and spatial analysis. SABER uses a “scalar” FDC (SFDC), a ratio of simulated to observed FDC, to characterize biases spatially, temporally, and for varying exceedance probabilities to make corrections at ungauged subbasins. Biased flows at ungauged locations are corrected with the scalar values from the SFDC. Corrected flows are refined to fit a Gumbel Type 1 distribution. We present the theory, procedure, and validation study in Colombia. SABER reduces biases and improves composite metrics, including Nash Sutcliffe and Kling Gupta Efficiency. Recommendations for future work and a discussion of limitations are provided.
Overview
CoChat Summary
TL;DR
SABER is a model-agnostic postprocessor that extends frequency-matching bias correction to ungauged subbasins using scalar flow duration curves, clustering, and spatial/network analysis. In a Magdalena River case study with GEOGloWS ECMWF Streamflow hindcasts, it reduced median bias and improved KGE/NSE, though some locations worsened and several limitations remain.
Key findings
- In the Magdalena River validation set (n = 109 reserved gauge locations), median mean error fell from 23.61 m³/s for raw GES results to 2.36 m³/s with SFDC corrections and 1.16 m³/s with direct frequency matching; median MAPE fell from 258.62% to 92.40% and 88.40%, respectively.
- Median KGE improved from −0.66 (raw) to 0.04 (SFDC corrected) and 0.16 (frequency matched); median NSE improved from −8.22 to −0.92 and −0.82.
- The raw-vs-SFDC mean-error t-test had p ≈ 0.12, not statistically significant at the 0.05 threshold, but the paper reports reduced variance and narrower interquartile range after correction, with about 20 outliers skewing statistics.
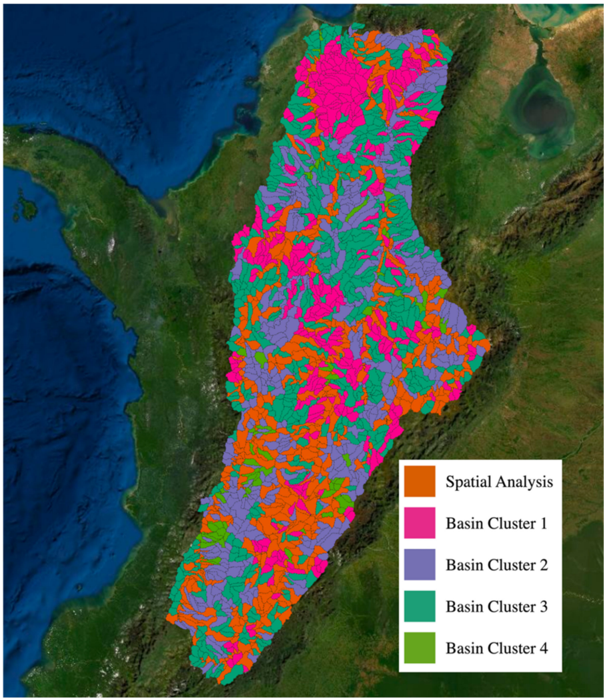
- The optimal number of clusters for the Magdalena watershed was four; 1164 of 2326 subbasins were stream order 1 with average drainage area 153 km², which the paper links to large percent errors. Some validation points decreased in KGE, especially near the outlet and in the south-central area.
Methods
- SABER uses frequency matching with flow duration curves at gauged subbasins and a scalar flow duration curve (SFDC), the ratio of simulated to observed FDC, applied monthly to ungauged subbasins. Ungauged subbasins are paired to gauges using hydraulic connectivity, FDC clusters from k-means with dynamic time warping and the knee method, stream order, drainage area, and proximity; corrected flows are compared to a Gumbel Type 1 distribution, with flows of 100-year return period or larger replaced by the 100-year Gumbel estimate.
- Case study: GEOGloWS ECMWF Streamflow (GES) hindcast for the Magdalena River Basin, Colombia, using 233 IDEAM gauges, 2326 subbasins, and daily discharge from 1 January 1980 through 31 December 2021. Approximately half of gauge locations were randomly reserved for validation; metrics included ME, MAPE, MAE, NRMSE, NSE, and KGE for raw, SFDC-corrected, and frequency-matched conditions.
Limitations
- The paper states: monthly temporal grouping may be too fine or coarse; clustering may not scale to very large models such as the National Water Model retrospective dataset (~17 TB); minimum data requirements and sensitivity to data amount are not quantified; SABER does not enforce conservation of mass between subbasins; clustering and pairing depend heavily on spatial relationships and only indirectly account for land use, soil, or slope; and SABER does not specially treat subbasins with dams, diversions, reservoirs, or other flow controls.
- Evident from the text: the raw-vs-SFDC mean-error difference was not statistically significant (p ≈ 0.12) due to outliers; MAPE remained about 90% after correction and NSE remained negative; and some validation locations decreased in KGE, including near the watershed outlet and in the south-central area.
Model-written summary. Check it against the paper before relying on it.
Integrity signals
Registry
Cites
Statistics
Figures




Verification
Claims the paper makes
0 Valid · 3 Not valid · 9 Not checked · 92 Own results and interpretations
A result the paper reports from its own data — it cites no other source for it, so there is none to check. The quote shows it is in the paper.
In the paper
“This is not statistically significant using the traditional 0.05 threshold (95% confidence).”
§ SABER: A Model-Agnostic Postprocessor for Bias Correcting Discharge from Large Hydrologic Models > 3.2. Bias Reduction Statistics
plain- Asserted: passes — The authors put it forward as true.
- Checkable: passes — It can be checked against evidence.
- Load-bearing: unclear — It is unclear whether the paper’s conclusions depend on it.
- Based: passes — The paper gives a reason why it holds.
A result the paper states — it cites no source for it, so there is none to check. The quote shows it is in the paper.
In the paper
“Occasionally, applying these scalar factors can result in corrected discharge values that are impractically large.”
§ SABER: A Model-Agnostic Postprocessor for Bias Correcting Discharge from Large Hydrologic Models > 2.6. Applying Corrections and Statistical Refinements
plainstates a possible cause- Asserted: passes — The authors put it forward as true.
- Checkable: passes — It can be checked against evidence.
- Load-bearing: passes — The paper’s conclusions depend on it.
- Based: passes — The paper gives a reason why it holds.
A result the paper reports from its own data — it cites no other source for it, so there is none to check. The quote shows it is in the paper.
In the paper
“When we compared the mean error results of the raw GES model data and the SFDC-corrected results, the p-value was approximately 0.12.”
§ SABER: A Model-Agnostic Postprocessor for Bias Correcting Discharge from Large Hydrologic Models > 3.2. Bias Reduction Statistics
plain- Asserted: passes — The authors put it forward as true.
- Checkable: passes — It can be checked against evidence.
- Load-bearing: unclear — It is unclear whether the paper’s conclusions depend on it.
- Based: passes — The paper gives a reason why it holds.
A result the paper reports from its own data — it cites no other source for it, so there is none to check. The quote shows it is in the paper.
In the paper
“The IQR and other statistics trend toward zero for each test from left to right on the plot.”
§ SABER: A Model-Agnostic Postprocessor for Bias Correcting Discharge from Large Hydrologic Models > 3.2. Bias Reduction Statistics
plainstates an association- Asserted: passes — The authors put it forward as true.
- Checkable: passes — It can be checked against evidence.
- Load-bearing: passes — The paper’s conclusions depend on it.
- Based: passes — The paper gives a reason why it holds.
A result the paper reports from its own data — it cites no other source for it, so there is none to check. The quote shows it is in the paper.
In the paper
“In the case study, some of the locations where the performance of the bias correction degrades were downstream of flow control structures.”
§ SABER: A Model-Agnostic Postprocessor for Bias Correcting Discharge from Large Hydrologic Models > 4. Discussion and Limitations
plainstates an associationSingle case- Asserted: passes — The authors put it forward as true.
- Checkable: passes — It can be checked against evidence.
- Load-bearing: passes — The paper’s conclusions depend on it.
- Based: passes — The paper gives a reason why it holds.
49 more claims
Create a free account to see all 104 claims and to verify the 15 references still open.
- It may state two separate claims as one. 26
- Probably not a substantial claim. 31
Self-check
Percentages, sums and reported differences re-computed from the paper’s own numbers.
Each contradiction between two passages listed here was confirmed by an independent check.
Rated minor: it would not touch a result — a value no result rests on, a p-value that stays on the same side of the significance level, or a conflict that is clerical, resolved elsewhere in the paper, or outside its own findings.
In the paper
§ SABER: A Model-Agnostic Postprocessor for Bias Correcting Discharge from Large Hydrologic Models > 1. Introduction
“the Global Runoff Data Centre (GRDC) discharge dataset, which has records for approximately 8000 locations”
§ SABER: A Model-Agnostic Postprocessor for Bias Correcting Discharge from Large Hydrologic Models > 1. Introduction
“The most comprehensive and publicly-available global-scale discharge database is maintained by the Global Runoff Data Centre (GRDC), with approximately 10,000 locations worldwide”
Citations
Cites
(1967) · Cited by 23,719
River flow forecasting through conceptual models part I — A discussion of principles
Nash, J. E., & Sutcliffe, J. V. (1970) · Journal of Hydrology · doi:10.1016/0022-1694(70)90255-6 · Cited by 23,674
Google Earth Engine: Planetary-scale geospatial analysis for everyone
Gorelick, N., Hancher, M., Dixon, M., Ilyushchenko, S., Thau, D., & Moore, R. (2017) · Remote Sensing of Environment · doi:10.1016/j.rse.2017.06.031 · Cited by 14,719
Gupta, H. V., Kling, H., Yilmaz, K. K., & Martinez, G. F. (2009) · Journal of Hydrology · doi:10.1016/j.jhydrol.2009.08.003 · Cited by 6,758
Quantitative analysis of watershed geomorphology
(1957) · Eos, Transactions American Geophysical Union · doi:10.1029/tr038i006p00913 · Cited by 5,959
The Global Land Data Assimilation System
Rodell, M., Houser, P. R., Jambor, U., Gottschalck, J., Mitchell, K., Meng, C.-J., Arsenault, K., Cosgrove, B., Radakovich, J., Bosilovich, M., et al. (2004) · Bulletin of the American Meteorological Society · doi:10.1175/bams-85-3-381 · Cited by 5,614
(1994) · Knowledge Discovery and Data Mining · Cited by 3,137
Teutschbein, C., & Seibert, J. (2012) · Journal of Hydrology · doi:10.1016/j.jhydrol.2012.05.052 · Cited by 2,214
Runoff conditions in the upper Danube basin under an ensemble of climate change scenarios
Kling, H., Fuchs, M., & Paulin, M. (2012) · Journal of Hydrology · doi:10.1016/j.jhydrol.2012.01.011 · Cited by 1,676
Knoben, W. J. M., Freer, J. E., & Woods, R. A. (2019) · Hydrology and Earth System Sciences · doi:10.5194/hess-23-4323-2019 · Cited by 1,432
Research works printed but not linked: 2
- Sanchez, J.L., Nelson, J., Williams, G.P., Hales, R., Ames, D.P., and Jones, N. (2020, January 1–17). A Streamflow Bias Correction and Validation Method for GEOGloWS ECMWF Streamflow Services. Proceedings of the AGU Fall Meeting Abstracts, Virtual.
- Hales, R., Sanchez, J.L., Nelson, J., Williams, G.P., Ames, D.P., and Jones, N. (2020, January 1–17). A Post-Processing Method to Calibrate Large-Scale Hydrologic Models with Limited Historical Observation Data Leveraging Machine Learning and Spatial Analysis. Proceedings of the AGU Fall Meeting Abstracts, Virtual.
Cited by
Application of Machine Learning in Water Resources Management: A Systematic Literature Review
Ghobadi, F., & Kang, D. (2023) · Water · doi:10.3390/w15040620 · Cited by 171
Advancing global hydrologic modeling with the GEOGloWS ECMWF streamflow service
Hales, R. C., Nelson, E. J., Souffront, M., Gutierrez, A. L., Prudhomme, C., Kopp, S., Ames, D. P., Williams, G. P., & Jones, N. L. (2022) · Journal of Flood Risk Management · doi:10.1111/jfr3.12859 · Cited by 68
Self-citationWillard, J., Varadharajan, C., Jia, X., & Kumar, V. (2025) · Environmental Data Science · doi:10.1017/eds.2024.14 · Cited by 58
Bias correcting discharge simulations from the GEOGloWS global hydrologic model
Hales, R. C., Williams, G. P., James Nelson, E., Sowby, R. B., Ames, D. P., & Lozano, J. L. S. (2023) · Journal of Hydrology · doi:10.1016/j.jhydrol.2023.130279 · Cited by 26
Self-citationLozano, J. L. S., Lesmes, D. J. R., Bustamante, E. G. R., Hales, R. C., Nelson, E. J., Williams, G. P., Ames, D. P., Jones, N. L., Gutierrez, A. L., & Almeida, C. C. (2024) · Environmental Modelling & Software · doi:10.1016/j.envsoft.2024.106235 · Cited by 25
Self-citation
Metadata
- Authors
- Hales, R. C., Sowby, R. B., Williams, G. P., Nelson, E. J., Ames, D. P., Dundas, J. B., & Ogden, J.
- Affiliations
- Brigham Young University (US)
- Corresponding author
- Hales, Riley C.
- Venue
- Hydrology
- Publisher
- MDPI AG
- Published
- 2022-06-22
- Volume
- 9
- Issue
- 7
- Pages
- 113
- ISSN
- 2306-5338 (ISSN-L)
- OpenAlex
- W4283317086
- Cited by
- 19
- References
- 71
- Citations by year
- 2026: 6 · 2025: 5 · 2024: 3 · 2023: 4 · 2022: 1
- FWCI
- 0.81
- Type
- journal article
- Language
- en
- Open access
- gold
- doi.org
- Licence
- Locations
- Hydrology (publishedVersion, cc-by)
- DOAJ (DOAJ: Directory of Open Access Journals) (submittedVersion, cc-by-sa)
- Funders
- NASA (80NSSC20K0157, 80NSCC18K0440)
- MDPI (80NSSC20K0157, 80NSCC18K0440)
- Topics
- Physical Sciences › Environmental Science › Water Science and Technology › Hydrology and Watershed Management Studies
- Physical Sciences › Environmental Science › Management, Monitoring, Policy and Law › Environmental Monitoring and Data Management
- Physical Sciences › Environmental Science › Environmental Engineering › Soil Moisture and Remote Sensing
- Keywords
- bias correction, frequency matching, flow duration curve, spatial bias, clustering, SABER, model calibration and validation
About these checks
Registry, retraction, Cites and statistics results are computed, not judged, with one exception: a printed reference that no index lists is read once by a model before it counts as a citation error. Claims are extracted by a model and kept only when their quote appears verbatim in the text; each cited source is then checked, with a model’s help, for whether it says what the claim relies on. Those verdicts can be wrong — read the claim’s quote and the cited source before relying on one.
A language model drew the claims from the paper on 2026-11-19, under version 3 of the claim definition (model deepseek-v4.1-flash, prompt extract-v3).
A second model labelled each claim on 2026-11-19 (model jev-1.13-20260917, definition revision gold-guideline-v0.2).
Statistics and arithmetic are recomputed, not judged.
Confidence bands are shown only for fields calibrated on our annotated test set. None is calibrated yet, so no band is shown.
What counts as a claim ›How we measure confidence ›How we check this ›
Are you an author, or do you see a problem with this page? Request a review
How to cite
Cite CoChat for the checks on this page, and the paper for its own findings.
- This page
- CoChat. (2026). Citation check: SABER: A Model-Agnostic Postprocessor for Bias Correcting Discharge from Large Hydrologic Models. https://app.cochat.ai/papers/10.3390/hydrology9070113
- The paper
- Hales, R. C., Sowby, R. B., Williams, G. P., Nelson, E. J., Ames, D. P., Dundas, J. B., & Ogden, J. (2022). SABER: A Model-Agnostic Postprocessor for Bias Correcting Discharge from Large Hydrologic Models. Hydrology. https://doi.org/10.3390/hydrology9070113
Data sources
Bibliographic data: Semantic Scholar, OpenAlex, Crossref.
Contains information from the Semantic Scholar Academic Graph Datasets, made available under the ODC Attribution License (ODC-BY 1.0).
Semantic Scholar’s data is described in: Kinney, R., et al. (2023). The Semantic Scholar Open Data Platform. arXiv:2301.10140.
