

Flood Susceptibility Mapping through the GIS-AHP Technique Using the Cloud
Open accessThe DOI matches its Crossref record; 55 of the 55 references it cites were found in a registry or an index.
Abstract
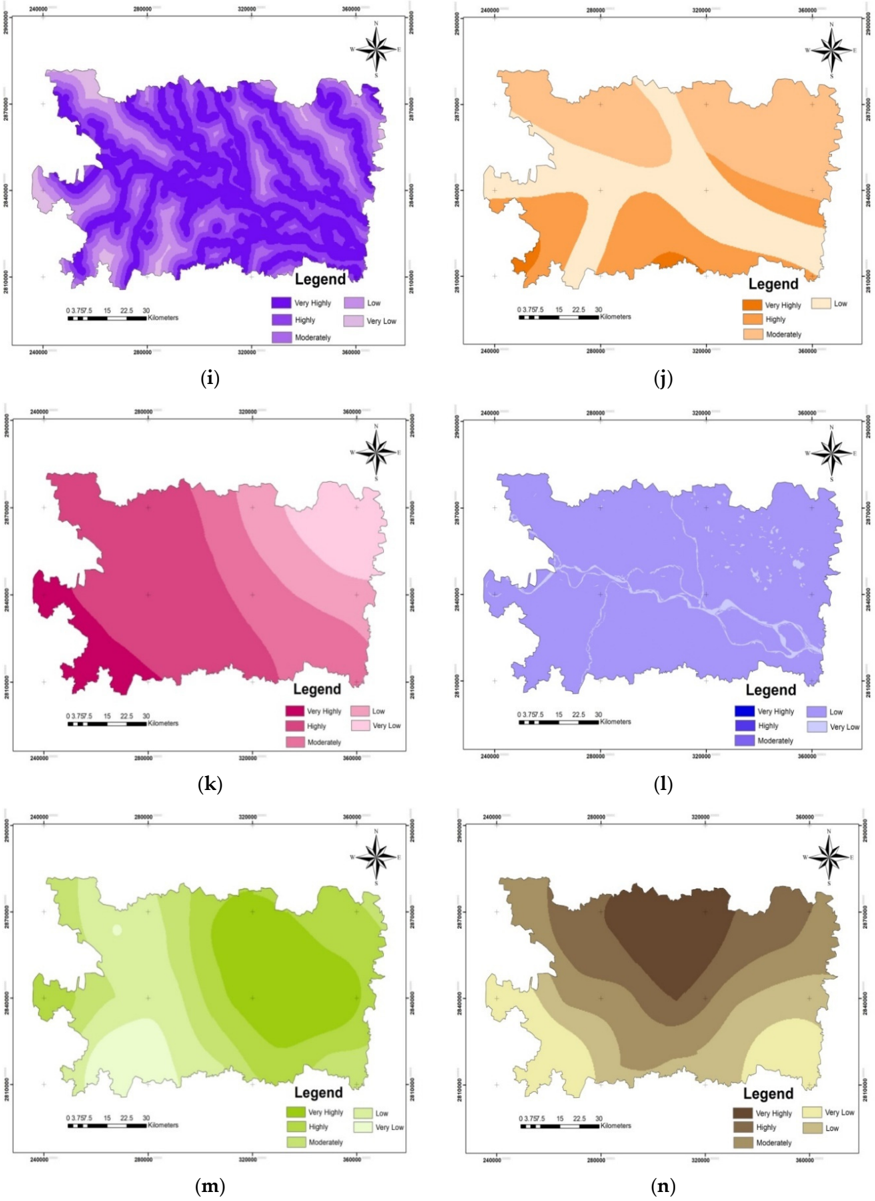
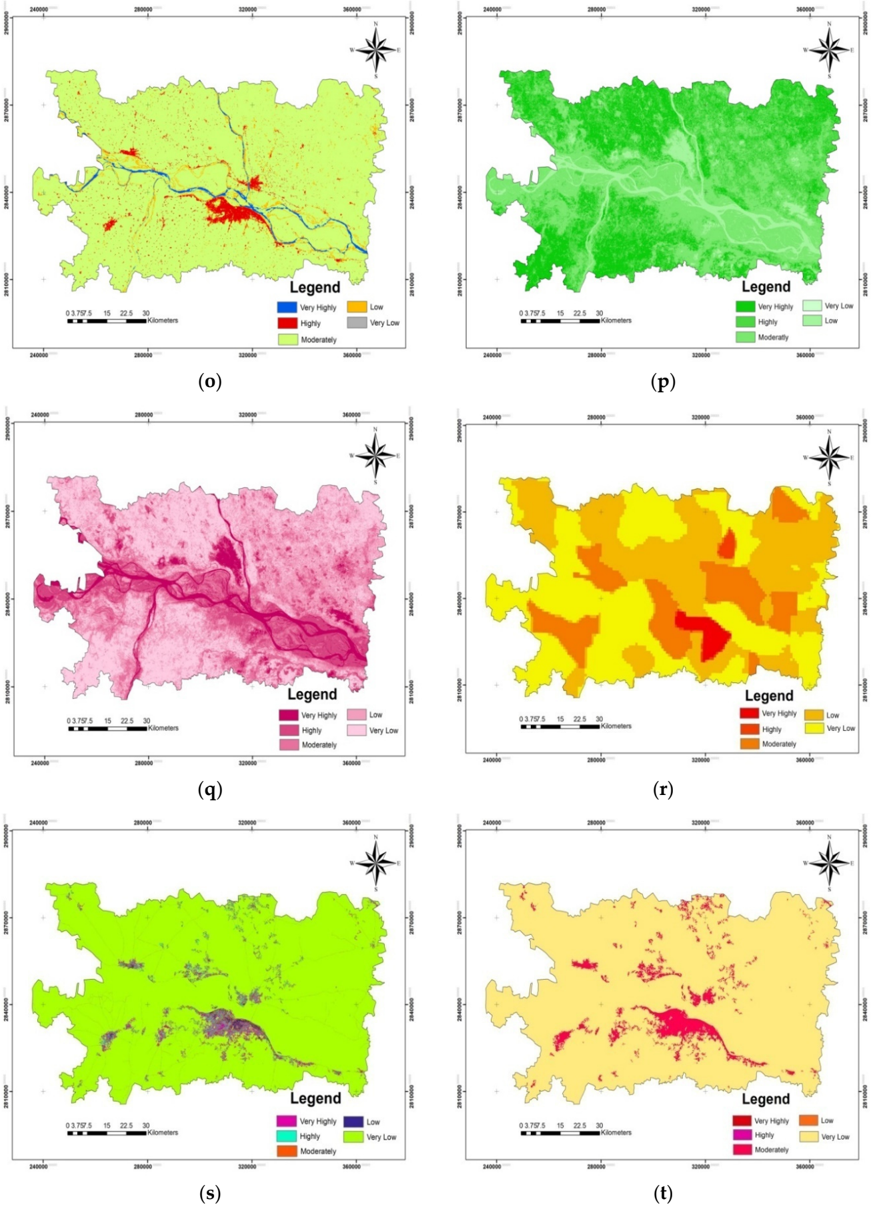
Flood susceptibility mapping is essential for characterizing flood risk zones and for planning mitigation approaches. Using a multi-criteria decision support system, this study investigated a flood susceptible region in Bihar, India. It used a combination of the analytical hierarchy process (AHP) and geographic information system (GIS)/remote sensing (RS) with a cloud computing API on the Google Earth Engine (GEE) platform. Five main flood-causing criteria were broadly selected, namely hydrologic, morphometric, permeability, land cover dynamics, and anthropogenic interference, which further had 21 sub-criteria. The relative importance of each criterion prioritized as per their contribution toward flood susceptibility and weightage was given by an AHP pair-wise comparison matrix (PCM). The most and least prominent flood-causing criteria were hydrologic (0.497) and anthropogenic interference (0.037), respectively. An area of ~3000 sq km (40.36%) was concentrated in high to very high flood susceptibility zones that were in the vicinity of rivers, whereas an area of ~1000 sq km (12%) had very low flood susceptibility. The GIS-AHP technique provided useful insights for flood zone mapping when a higher number of parameters were used in GEE. The majorities of detected flood susceptible areas were flooded during the 2019 floods and were mostly located within 500 m of the rivers’ paths.
Overview
The claims and statistics of this paper haven’t been checked yet.
Free: it reads the open-access text and checks the first 5 claims that cite a source we can check. Create a free account to check every claim.
Integrity signals
Registry
Cites
Statistics
Figures




Verification
Claims the paper makes
The claims and statistics of this paper haven’t been checked yet.
Free: it reads the open-access text and checks the first 5 claims that cite a source we can check. Create a free account to check every claim.
Claims other papers make about this one
Each is checked against this paper’s own text: does it say what the citing paper says it does?
The source backs part of the claim, not all of it — or backs it for a different population, condition or comparison.
In the citing paper
“Elevation significantly impacts flood vulnerability, with lower-lying areas typically facing a higher risk of flooding, especially in coastal regions [59,60].”
From Urban Flood Vulnerability Assessment in Freetown, Sierra Leone: AHP Approach (2024) · cites this paper as [59]
Experimental — accuracy not yet measured
Self-check
Percentages, sums and reported differences re-computed from the paper’s own numbers.
The self-check needs the paper’s full text.
Citations
Cites
Red and photographic infrared linear combinations for monitoring vegetation
Tucker, C. J. (1979) · Remote Sensing of Environment · doi:10.1016/0034-4257(79)90013-0 · Cited by 11,754 · cited 1×
“In our study, the GEE platform utilized the resampling cubic convolution of Landsat 8 (Collection-1 Tier-1) calibrated reflectance values for Path: 141 and Row: 42 (covering the study area) images with supporting metadata between 20 August 2019 and 20 October 2019 with cloud-free images (<5% cloud cover) for SAVI and…”
MethodA soil-adjusted vegetation index (SAVI)
Huete, A. R. (1988) · Remote Sensing of Environment · doi:10.1016/0034-4257(88)90106-x · Cited by 7,948 · cited 1×
“A wide range of such data sets are available, such as GHSL and gridded population of the world (GPW) [48,49].”
BackgroundBEVEN, K. J., & KIRKBY, M. J. (1979) · Hydrological Sciences Bulletin · doi:10.1080/02626667909491834 · Cited by 6,670
Renard, K. G., Foster, G. R., Weesies, G. A., McCool, D. K., & Yoder, D. C. (1996) · Cited by 4,785
Optimization by the Analytic Hierarchy Process
Saaty, T. L. (1979) · doi:10.21236/ada214804 · Cited by 4,466
Effective and efficient global optimization for conceptual rainfall‐runoff models
Duan, Q., Sorooshian, S., & Gupta, V. (1992) · Water Resources Research · doi:10.1029/91wr02985 · Cited by 3,310 · cited 1×
“ANN has been extensively used for flood susceptibility mapping [18,19]; however, it has drawbacks, such as over-fitting and under-fitting, slow learning, the curse of dimensionality, and slow convergence to a local optimum; in addition, its performance for processing complex hydrological phenomena has been inadequate…”
BackgroundAyalew, L., & Yamagishi, H. (2005) · Geomorphology · doi:10.1016/j.geomorph.2004.06.010 · Cited by 1,913 · cited 1×
“AHP is a multi-perspective multi-objective decision-making model that enables users and planners to quantitatively derive a scale of preference drawn from a set of alternatives [51].”
BackgroundTehrany, M. S., Pradhan, B., & Jebur, M. N. (2014) · Journal of Hydrology · doi:10.1016/j.jhydrol.2014.03.008 · Cited by 1,005 · cited 3×
“In our study, the GEE platform utilized the resampling cubic convolution of Landsat 8 (Collection-1 Tier-1) calibrated reflectance values for Path: 141 and Row: 42 (covering the study area) images with supporting metadata between 20 August 2019 and 20 October 2019 with cloud-free images (<5% cloud cover) for SAVI and…”
BackgroundInfluentialKhosravi, K., Pham, B. T., Chapi, K., Shirzadi, A., Shahabi, H., Revhaug, I., Prakash, I., & Tien Bui, D. (2018) · Science of The Total Environment · doi:10.1016/j.scitotenv.2018.01.266 · Cited by 792
Choubin, B., Moradi, E., Golshan, M., Adamowski, J., Sajedi-Hosseini, F., & Mosavi, A. (2019) · Science of The Total Environment · doi:10.1016/j.scitotenv.2018.10.064 · Cited by 787
Fernández, D. S., & Lutz, M. A. (2010) · Engineering Geology · doi:10.1016/j.enggeo.2009.12.006 · Cited by 591 · cited 1×
“High TWI values signify low drainage, representing more saturated land, which may cause flash flooding [29].”
BackgroundChen, W., Li, Y., Xue, W., Shahabi, H., Li, S., Hong, H., Wang, X., Bian, H., Zhang, S., Pradhan, B., et al. (2020) · Science of The Total Environment · doi:10.1016/j.scitotenv.2019.134979 · Cited by 505 · cited 1×
“Flood susceptibility mapping can be improved using modern techniques, such as the naïve Bayes method of alternating decision tree (AD Tree) and random forest (RF) [60,61] and frequency ratio and support vector machine models [62,63].”
MethodFlood hazard zoning in Yasooj region, Iran, using GIS and multi-criteria decision analysis
Rahmati, O., Zeinivand, H., & Besharat, M. (2016) · Geomatics, Natural Hazards and Risk · doi:10.1080/19475705.2015.1045043 · Cited by 482 · cited 1×
“The adaptive neuro fuzzy interface system used for landslide susceptibility in Qazvin Province, Iran [12], hydraulic modeling used for estimating unsaturated soil hydraulic conductivity [13], and soil water assessment tool (SWAT) in the ArcGIS software environment [14] are some models utilized for flood susceptibility…”
MethodRazavi Termeh, S. V., Kornejady, A., Pourghasemi, H. R., & Keesstra, S. (2018) · Science of The Total Environment · doi:10.1016/j.scitotenv.2017.09.262 · Cited by 472
Flood management and a GIS modelling method to assess flood-hazard areas—a case study
Kourgialas, N. N., & Karatzas, G. P. (2011) · Hydrological Sciences Journal · doi:10.1080/02626667.2011.555836 · Cited by 430 · cited 2×
“However, barren land, rivers and river banks, impervious roads, and buildings lead to a higher runoff rate [32], as they are hard and impervious surfaces with minimal infiltration.”
BackgroundHong, H., Tsangaratos, P., Ilia, I., Liu, J., Zhu, A.-X., & Chen, W. (2018) · Science of The Total Environment · doi:10.1016/j.scitotenv.2017.12.256 · Cited by 427
Darabi, H., Choubin, B., Rahmati, O., Torabi Haghighi, A., Pradhan, B., & Kløve, B. (2019) · Journal of Hydrology · doi:10.1016/j.jhydrol.2018.12.002 · Cited by 409 · cited 1×
“Flood susceptibility mapping uses analysis techniques, such as multi-criteria decision analysis [4], logistic regression [5], frequency ratio approach [6], weight of evidences equations [7], k-nearest neighbor logic [8], analytic network process framework [9], Bayesian network fusion technique [10], and genetic algori…”
MethodShahabi, H., Shirzadi, A., Ghaderi, K., Omidvar, E., Al-Ansari, N., Clague, J. J., Geertsema, M., Khosravi, K., Amini, A., Bahrami, S., et al. (2020) · Remote Sensing · doi:10.3390/rs12020266 · Cited by 377 · cited 1×
“Flood intensity and frequency are very high around a drainage basin area [28], particularly closer to rivers.”
BackgroundMulti-attribute Decision Analysis in GIS: Weighted Linear Combination and Ordered Weighted Averaging
Drobne, S., & Lisec, A. (2009) · Informatica · Cited by 368
Flood susceptibility mapping using convolutional neural network frameworks
Wang, Y., Fang, Z., Hong, H., & Peng, L. (2020) · Journal of Hydrology · doi:10.1016/j.jhydrol.2019.124482 · Cited by 339 · cited 1×
“ANN has been extensively used for flood susceptibility mapping [18,19]; however, it has drawbacks, such as over-fitting and under-fitting, slow learning, the curse of dimensionality, and slow convergence to a local optimum; in addition, its performance for processing complex hydrological phenomena has been inadequate…”
BackgroundPradhan, B. (2010) · ScholarsArchive (Brigham Young University) · Cited by 335
Jebur, M. N., Pradhan, B., & Tehrany, M. S. (2014) · Remote Sensing of Environment · doi:10.1016/j.rse.2014.05.013 · Cited by 332 · cited 1×
“In Bihar, 76% of the total population faces frequent flood threats that cause great devastation [36,37].”
BackgroundFlood Susceptibility Mapping on a National Scale in Slovakia Using the Analytical Hierarchy Process
Vojtek, M., & Vojteková, J. (2019) · Water · doi:10.3390/w11020364 · Cited by 318
GIS-based MCDM – AHP modeling for flood susceptibility mapping of arid areas, southeastern Tunisia
Souissi, D., Zouhri, L., Hammami, S., Msaddek, M. H., Zghibi, A., & Dlala, M. (2020) · Geocarto International · doi:10.1080/10106049.2019.1566405 · Cited by 317 · cited 1×
“Flood susceptibility mapping uses analysis techniques, such as multi-criteria decision analysis [4], logistic regression [5], frequency ratio approach [6], weight of evidences equations [7], k-nearest neighbor logic [8], analytic network process framework [9], Bayesian network fusion technique [10], and genetic algori…”
MethodShafapour Tehrany, M., Shabani, F., Neamah Jebur, M., Hong, H., Chen, W., & Xie, X. (2017) · Geomatics, Natural Hazards and Risk · doi:10.1080/19475705.2017.1362038 · Cited by 295
New estimates of flood exposure in developing countries using high-resolution population data
Smith, A., Bates, P. D., Wing, O., Sampson, C., Quinn, N., & Neal, J. (2019) · Nature Communications · doi:10.1038/s41467-019-09282-y · Cited by 264 · cited 1×
“Currently, flood exposure and vulnerability are mapped using hydrodynamic inundation models along with high-resolution population distribution data in developed countries with high population density [3].”
BackgroundEffects of climate, land cover and topography on soil erosion risk in a semiarid basin of the Andes
Ochoa, P. A., Fries, A., Mejía, D., Burneo, J. I., Ruíz-Sinoga, J. D., & Cerdà, A. (2016) · CATENA · doi:10.1016/j.catena.2016.01.011 · Cited by 229 · cited 1×
“1) approach was used to estimate the soil erodibility (K), intensity of soil erosion problem (factor measured in terms of t h MJ−1 mm−1), rainfall erosivity (R), and soil loss due to rainfall (measured in MJ mm ha−1 h−1 year−1) [44].”
MethodOeurng, C., Sauvage, S., & Sánchez-Pérez, J.-M. (2011) · Journal of Hydrology · doi:10.1016/j.jhydrol.2011.02.017 · Cited by 223 · cited 2×
“The adaptive neuro fuzzy interface system used for landslide susceptibility in Qazvin Province, Iran [12], hydraulic modeling used for estimating unsaturated soil hydraulic conductivity [13], and soil water assessment tool (SWAT) in the ArcGIS software environment [14] are some models utilized for flood susceptibility…”
MethodDano, U., Balogun, A.-L., Matori, A.-N., Wan Yusouf, K., Abubakar, I., Said Mohamed, M., Aina, Y., & Pradhan, B. (2019) · Water · doi:10.3390/w11030615 · Cited by 213
Dynamics of sea level rise and coastal flooding on a changing landscape
Bilskie, M. V., Hagen, S. C., Medeiros, S. C., & Passeri, D. L. (2014) · Geophysical Research Letters · doi:10.1002/2013gl058759 · Cited by 209 · cited 1×
“In another study, LU/LC dynamics along with elevation and slope were considered factors that had the most significant effect on flooding in a region [31].”
BackgroundSpatial prediction of flood-susceptible areas using frequency ratio and maximum entropy models
Siahkamari, S., Haghizadeh, A., Zeinivand, H., Tahmasebipour, N., & Rahmati, O. (2018) · Geocarto International · doi:10.1080/10106049.2017.1316780 · Cited by 195 · cited 1×
“Flood susceptibility mapping uses analysis techniques, such as multi-criteria decision analysis [4], logistic regression [5], frequency ratio approach [6], weight of evidences equations [7], k-nearest neighbor logic [8], analytic network process framework [9], Bayesian network fusion technique [10], and genetic algori…”
MethodDelineation of groundwater potential zones using remote sensing and GIS-based data-driven models
Ghorbani Nejad, S., Falah, F., Daneshfar, M., Haghizadeh, A., & Rahmati, O. (2016) · Geocarto International · doi:10.1080/10106049.2015.1132481 · Cited by 186 · cited 2×
“Various studies were referred for selecting the primary criteria for flood evaluation [10,27].”
BackgroundSahana, M., Rehman, S., Sajjad, H., & Hong, H. (2020) · CATENA · doi:10.1016/j.catena.2019.104450 · Cited by 161 · cited 1×
“Flood susceptibility mapping can be improved using modern techniques, such as the naïve Bayes method of alternating decision tree (AD Tree) and random forest (RF) [60,61] and frequency ratio and support vector machine models [62,63].”
MethodLuu, C., von Meding, J. K., & Kanjanabootra, S. (2017) · Natural Hazards · doi:10.1007/s11069-017-3083-0 · Cited by 160 · cited 1×
“The consistency ratio (CR) was defined for validation (Equation (6)), which was defined as the ratio of the consistency index (CI) and the RI (Equations (6) and (7) [54]).”
MethodSeejata, K., Yodying, A., Wongthadam, T., Mahavik, N., & Tantanee, S. (2018) · Procedia Engineering · doi:10.1016/j.proeng.2018.01.044 · Cited by 160 · cited 1×
“Flood susceptibility mapping can be improved using modern techniques, such as the naïve Bayes method of alternating decision tree (AD Tree) and random forest (RF) [60,61] and frequency ratio and support vector machine models [62,63].”
MethodUrban Flood Mapping Using SAR Intensity and Interferometric Coherence via Bayesian Network Fusion
Li, Y., Martinis, S., Wieland, M., Schlaffer, S., & Natsuaki, R. (2019) · Remote Sensing · doi:10.3390/rs11192231 · Cited by 149 · cited 3×
“Segmentation methods, with cut off values, can automatically extract urban land or impervious surface layers [10].”
BackgroundMethodTang, X., Li, J., Liu, M., Liu, W., & Hong, H. (2020) · CATENA · doi:10.1016/j.catena.2020.104536 · Cited by 147
Flood dynamics in urbanised landscapes: 100 years of climate and humans’ interaction
Sofia, G., Roder, G., Fontana, G. D., & Tarolli, P. (2017) · Scientific Reports · doi:10.1038/srep40527 · Cited by 144
Jahangir, M. H., Reineh, S. M. M., & Abolghasemi, M. (2019) · Weather and Climate Extremes · doi:10.1016/j.wace.2019.100215 · Cited by 141 · cited 1×
“ANN has been extensively used for flood susceptibility mapping [18,19]; however, it has drawbacks, such as over-fitting and under-fitting, slow learning, the curse of dimensionality, and slow convergence to a local optimum; in addition, its performance for processing complex hydrological phenomena has been inadequate…”
BackgroundMULTICRITERIA ANALYSIS FOR FLOOD VULNERABLE AREAS IN HADEJIA-JAMA'ARE RIVER BASIN, NIGERIA
Yahaya, S. (2008) · Cited by 130
Land suitability evaluation criteria for agricultural crop selection: A review
Singha, C., & Swain, K. C. (2016) · Agricultural Reviews · doi:10.18805/ar.v37i2.10737 · Cited by 121 · cited 1×
“Saaty [52] introduced a PCM method to construct weighting factors for individual criterion by applying a ranking scale [53], which was estimated and assessed by a random consistency index [52].”
MethodSelf-citationGoffi, A., Stroppiana, D., Brivio, P. A., Bordogna, G., & Boschetti, M. (2019) · International Journal of Applied Earth Observation and Geoinformation · doi:10.1016/j.jag.2019.101951 · Cited by 105 · cited 1×
“In our study, the GEE platform utilized the resampling cubic convolution of Landsat 8 (Collection-1 Tier-1) calibrated reflectance values for Path: 141 and Row: 42 (covering the study area) images with supporting metadata between 20 August 2019 and 20 October 2019 with cloud-free images (<5% cloud cover) for SAVI and…”
MethodAl-Saady, Y. I., Al-Suhail, Q. A., Al-Tawash, B. S., & Othman, A. A. (2016) · Environmental Earth Sciences · doi:10.1007/s12665-016-6038-y · Cited by 101 · cited 1×
“Permeability influences the volume of peak flood wave and timing of occurrence and the groundwater flow from aquifers to support lower river flows [42].”
BackgroundDetection and Delineation of Localized Flooding from WorldView-2 Multispectral Data
Malinowski, R., Groom, G. B., Schwanghart, W., & Heckrath, G. J. (2015) · Remote Sensing · doi:10.3390/rs71114853 · Cited by 91 · cited 1×
“This brings new challenges to manage flood water in urban areas [34].”
BackgroundSantangelo, N., Santo, A., Crescenzo, G. D., Foscari, G., Liuzza, V., Sciarrotta, S., & Scorpio, V. (2011) · Natural hazards and earth system sciences · doi:10.5194/nhess-11-2765-2011 · Cited by 90 · cited 1×
“Researchers have determined that rainfall, topography, and soil significantly influence the occurrence of floods [59], which is inline with our results.”
ResultLiu, K., Li, Z., Yao, C., Chen, J., Zhang, K., & Saifullah, M. (2016) · International Journal of Sediment Research · doi:10.1016/j.ijsrc.2016.02.002 · Cited by 88 · cited 1×
“Flood susceptibility mapping uses analysis techniques, such as multi-criteria decision analysis [4], logistic regression [5], frequency ratio approach [6], weight of evidences equations [7], k-nearest neighbor logic [8], analytic network process framework [9], Bayesian network fusion technique [10], and genetic algori…”
MethodAl-Abadi, A. M., Shahid, S., & Al‐Ali, A. K. (2016) · Environmental Earth Sciences · doi:10.1007/s12665-016-5523-7 · Cited by 80
Flood Prevention and Emergency Response System Powered by Google Earth Engine
Liu, C., Shieh, M.-C., Ke, M.-S., & Wang, K.-H. (2018) · Remote Sensing · doi:10.3390/rs10081283 · Cited by 73 · cited 2×
“AHP is suitable for local and regional susceptibility studies [23] and mostly influenced by local hydrological, hydrogeological, and morphological characteristics.”
BackgroundMethodLow cost, multiscale and multi-sensor application for flooded area mapping
Giordan, D., Notti, D., Villa, A., Zucca, F., Calò, F., Pepe, A., Dutto, F., Pari, P., Baldo, M., & Allasia, P. (2018) · Natural hazards and earth system sciences · doi:10.5194/nhess-18-1493-2018 · Cited by 62 · cited 1×
“Near real-time flood monitoring is essential to mitigate floods and thus control their impact [1].”
Background(2010) · CRC Press eBooks · doi:10.1201/b10426 · Cited by 36 · cited 1×
“It degrades land and hydrologic systems in watersheds and accelerates sediment accumulation, causing frequent floods [43].”
BackgroundFlood Prevention and Emergency Response System Powered by Google Earth EnginePreprint
Liu, C., Shieh, M.-C., Ko, M.-H., et al. (2018) · Preprints.org · doi:10.20944/preprints201807.0076.v1 · Cited by 19
Singha, C., Swain, K. C., & Saren, B. K. (2019) · Journal of Agricultural Engineering (India) · doi:10.52151/jae2019563.1691 · Cited by 6
Self-citationBahrami, S. (2019) · Cited by 3
Dynamic Flood Vulnerability Mapping with Google Earth Engine
Tellman, B., Kuhn, C., Max, S. A., & Sullivan, J. A. (2015) · AGU Fall Meeting Abstracts · Cited by 2
Performance of WRF (ARW) over River Basins under Flood Met Office, Patna during Flood Season 2014
Diwakar, S. K., Kaur, S., Das, A. K., & Nagarkoti, J. (2016) · doi:10.13140/rg.2.1.1155.9286 · Cited by 1
Research works printed but not linked: 4
- Amin, K. Application of Remote Sensing and GIS in Flash Flood Hazard Mapping and Hydraulic Design (Case Study of Wadi Dahdah, Saudi Arabia). 2019. Available online: https://www.academia.edu/20126182/ Application_of_Remote_Sensing_and_GIS_for_Floodplain_mapping_and_Hydraulic_design (accessed on 1 January 2020).
- Center for International Earth Science Information Network-CIESIN-Columbia University (CIESIN). Gridded Population of the World, Version 4 (GPWv4): Basic Demographic Characteristics, Revision 11; NASA Socioeconomic Data and Applications Center (SEDAC): Palisades, NY, USA, 2018. Available online: https: //sedac.ciesin.columbia.edu/data/collection/gpw-v4 (accessed on 10 May 2019). [CrossRef]
- Pesaresi, M.; Ehrilch, D.; Florczyk, A.J.; Freire, S.; Julea, A. GHS Built-Upgrid, Derived from Landsat, Multitemporal (1975, 1990, 2000, 2014) (versionR2015); European Commission, Joint Research Centre (JRC): Ispra, Italy, 2019. Available online: http://data.europa.eu/89h/jrc-ghsl-hs_built_ldsmt_globe_r2015b (accessed on 21 April 2019).
- Saaty, T.L.; Vargas, G.L. Models, Methods, Concepts, and Applications of the Analytic Hierarchy Process. Int. Ser. Oper. Res. Manag. Sci. 2001, 32, 93. [CrossRef]
Cited by
Aydin, H. E., & Iban, M. C. (2023) · Natural Hazards · doi:10.1007/s11069-022-05793-y · Cited by 186
“Since SPI explains the rate of water discharge, this finding is not surprising (Swain et al. 2020).”
ResultIntegration of HEC-RAS and HEC-HMS with GIS in Flood Modeling and Flood Hazard Mapping
Peker, İ. B., Gülbaz, S., Demir, V., Orhan, O., & Beden, N. (2024) · Sustainability · doi:10.3390/su16031226 · Cited by 164
“Therefore, studies that determine potential flood impact areas and disaster damage using techniques such as geographic information systems [10], remote sensing [11], and hydrological modeling [12] are crucial for managers and decision makers.”
BackgroundIslam, T., Zeleke, E. B., Afroz, M., & Melesse, A. M. (2025) · Remote Sensing · doi:10.3390/rs17030524 · Cited by 174
Mehravar, S., Razavi-Termeh, S. V., Moghimi, A., Ranjgar, B., Foroughnia, F., & Amani, M. (2023) · Journal of Hydrology · doi:10.1016/j.jhydrol.2023.129100 · Cited by 148
Rahman, M., Chen, N., Elbeltagi, A., Islam, M. M., Alam, M., Pourghasemi, H. R., Wang, T., Zhang, J., Shufeng, T., Faiz, H., et al. (2021) · Journal of Environmental Management · doi:10.1016/j.jenvman.2021.113086 · Cited by 124
Metadata
- Authors
- Swain, K. C., Singha, C., & Nayak, L.
- Affiliations
- Visva-Bharati University (IN)
- ICAR-NINFET, 12 Regent Park, Kolkata 700040, India
- Corresponding author
- Swain, Kishore Chandra
- Venue
- ISPRS International Journal of Geo-Information
- Publisher
- MDPI AG
- Published
- 2020-12-02
- Volume
- 9
- Issue
- 12
- Pages
- 720
- ISSN
- 2220-9964 (ISSN-L)
- OpenAlex
- W3109806479
- Cited by
- 273
- References
- 55
- Citations by year
- 2026: 61 · 2025: 64 · 2024: 52 · 2023: 46 · 2022: 36 · 2021: 13 · 2020: 1
- FWCI
- 8.65
- Type
- journal article
- Language
- en
- Open access
- gold
- doi.org
- Licence
- Locations
- ISPRS International Journal of Geo-Information (publishedVersion, cc-by)
- DOAJ (DOAJ: Directory of Open Access Journals) (submittedVersion, cc-by-sa)
- Topics
- Physical Sciences › Environmental Science › Global and Planetary Change › Flood Risk Assessment and Management
- Physical Sciences › Environmental Science › Environmental Engineering › Groundwater and Watershed Analysis
- Physical Sciences › Environmental Science › Management, Monitoring, Policy and Law › Landslides and related hazards
- Keywords
- flood susceptibility mapping, flood risk areas, multi-criteria decision support system, analytic hierarchy process, Google Earth Engine, cloud computing, human disturbance, land cover dynamics, river proximity
About these checks
Registry, retraction, Cites and statistics results are computed, not judged, with one exception: a printed reference that no index lists is read once by a model before it counts as a citation error. Claims are extracted by a model and kept only when their quote appears verbatim in the text; each cited source is then checked, with a model’s help, for whether it says what the claim relies on. Those verdicts can be wrong — read the claim’s quote and the cited source before relying on one.
Statistics and arithmetic are recomputed, not judged.
Confidence bands are shown only for fields calibrated on our annotated test set. None is calibrated yet, so no band is shown.
What counts as a claim ›How we measure confidence ›How we check this ›
Are you an author, or do you see a problem with this page? Request a review
Data sources
Bibliographic data: Semantic Scholar, OpenAlex, Crossref.
Contains information from the Semantic Scholar Academic Graph Datasets, made available under the ODC Attribution License (ODC-BY 1.0).
Semantic Scholar’s data is described in: Kinney, R., et al. (2023). The Semantic Scholar Open Data Platform. arXiv:2301.10140.
