

The DOI matches its Crossref record; 109 of the 109 references it cites were found in a registry or an index.
Canonical and Alternative Auxin Signaling Systems in Mono-, Di-, and Tetraploid Potatoes
Open accessPublished version of a preprint
Abstract
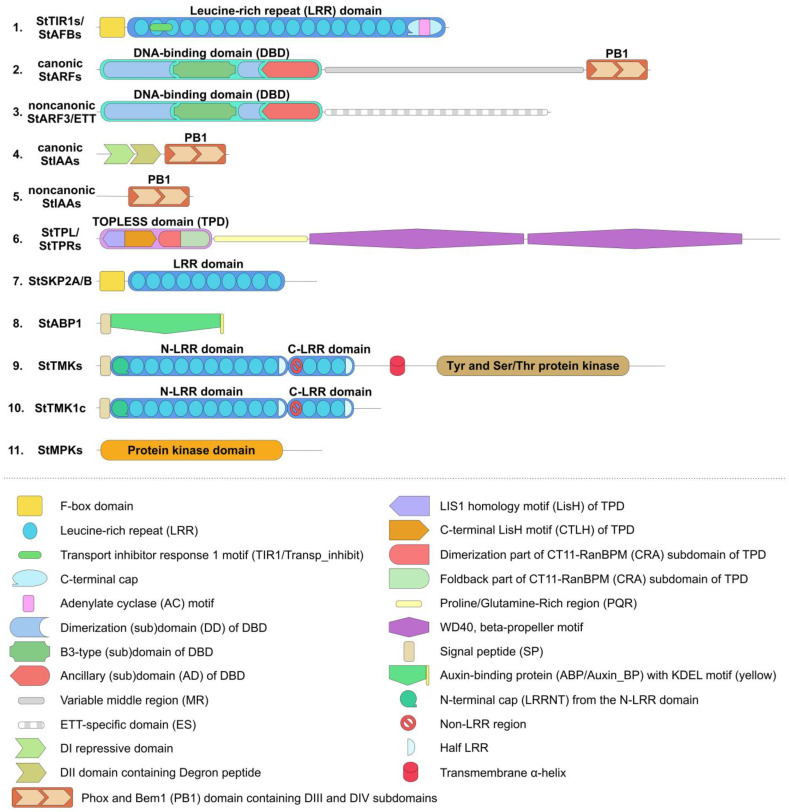
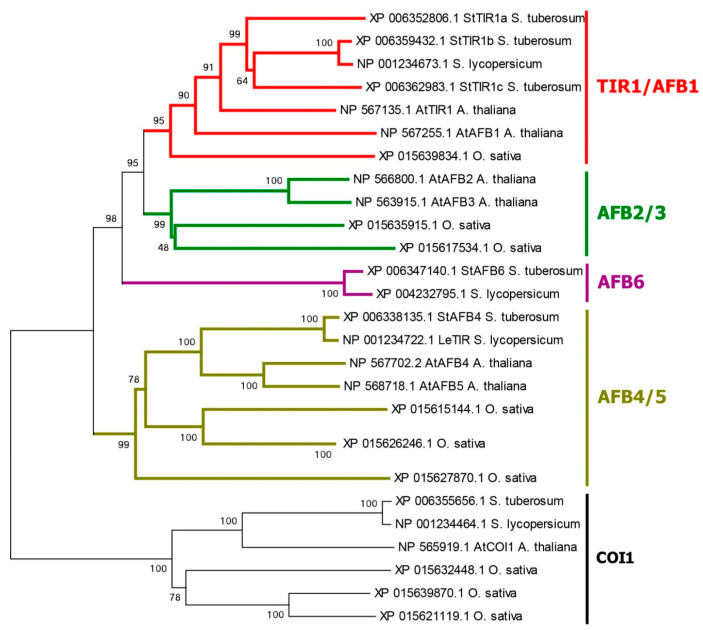
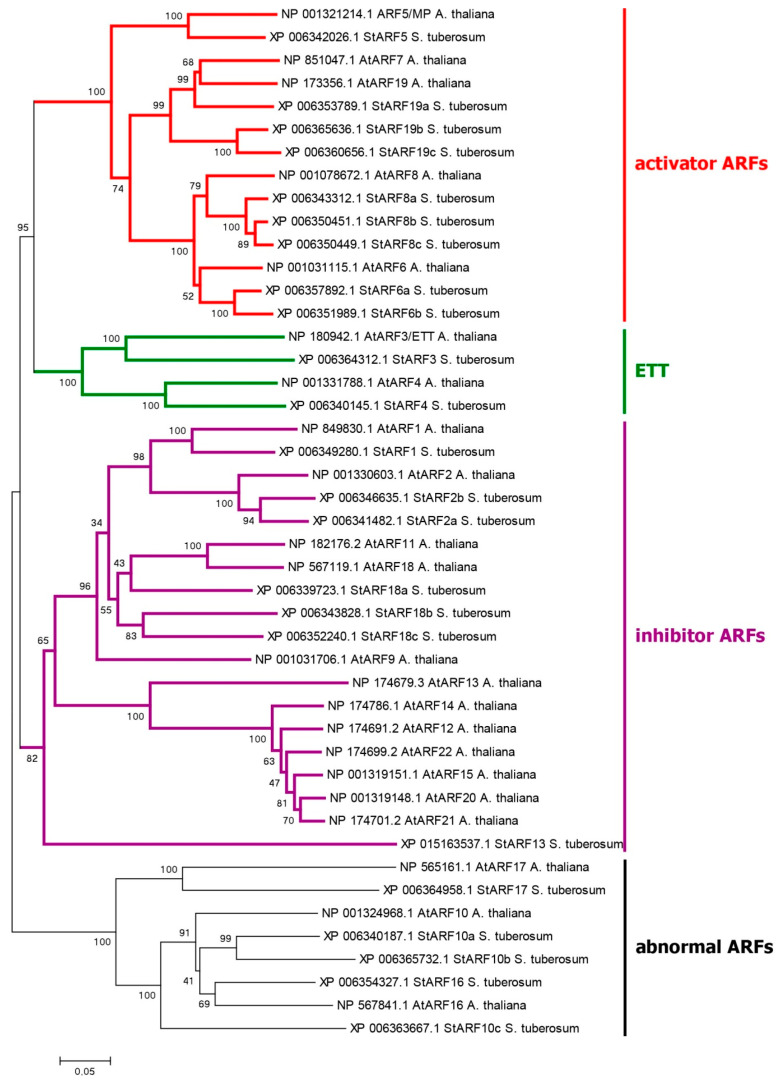
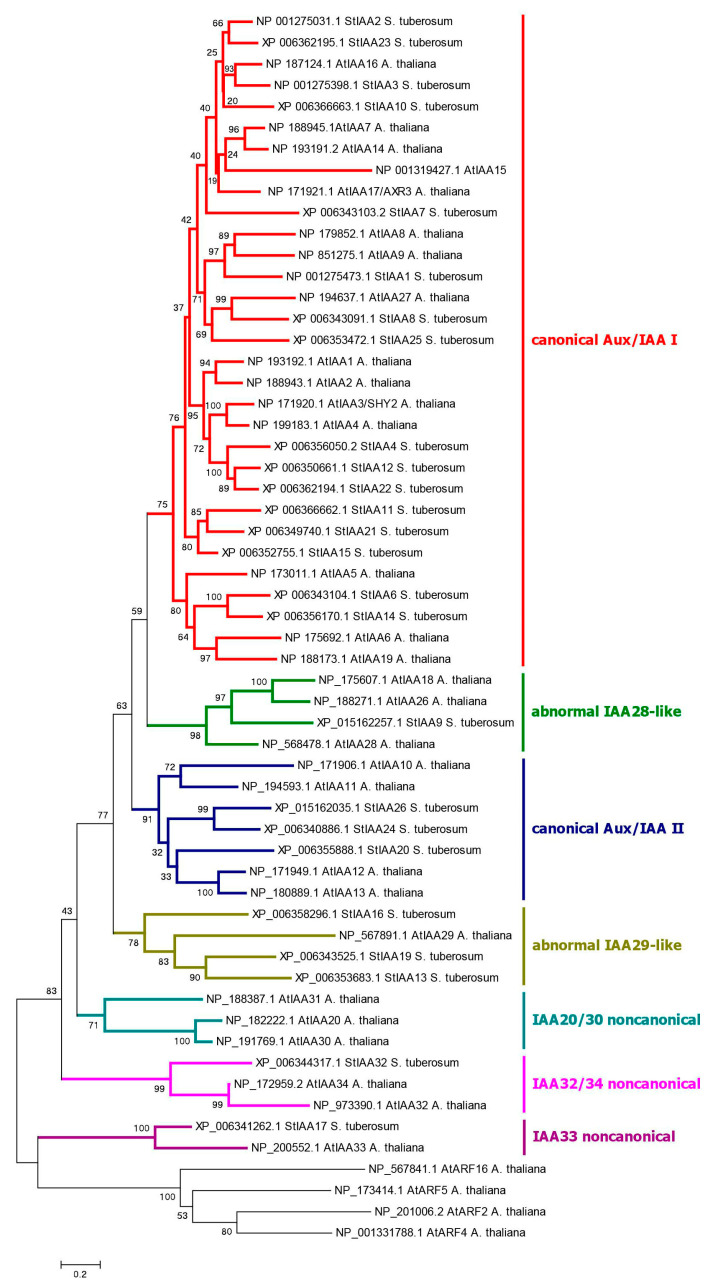
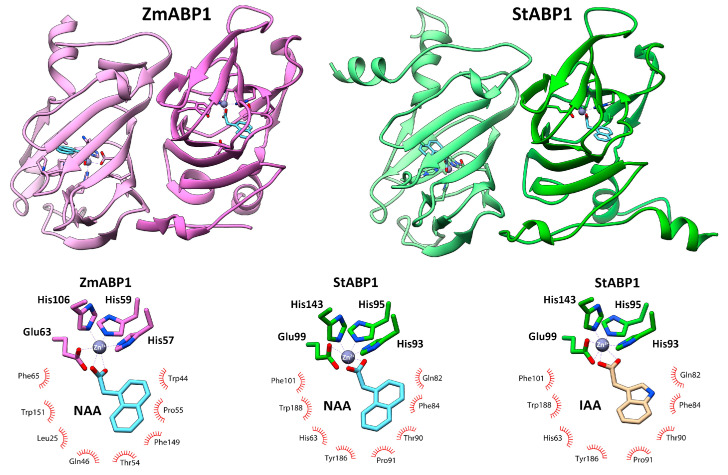
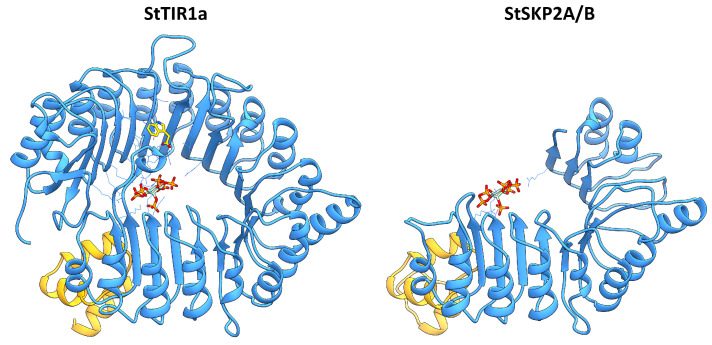
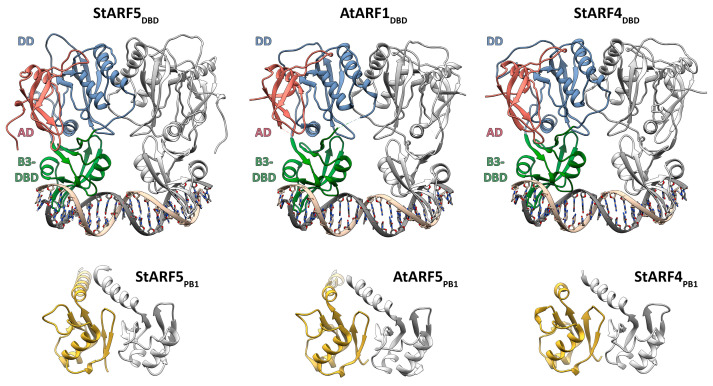
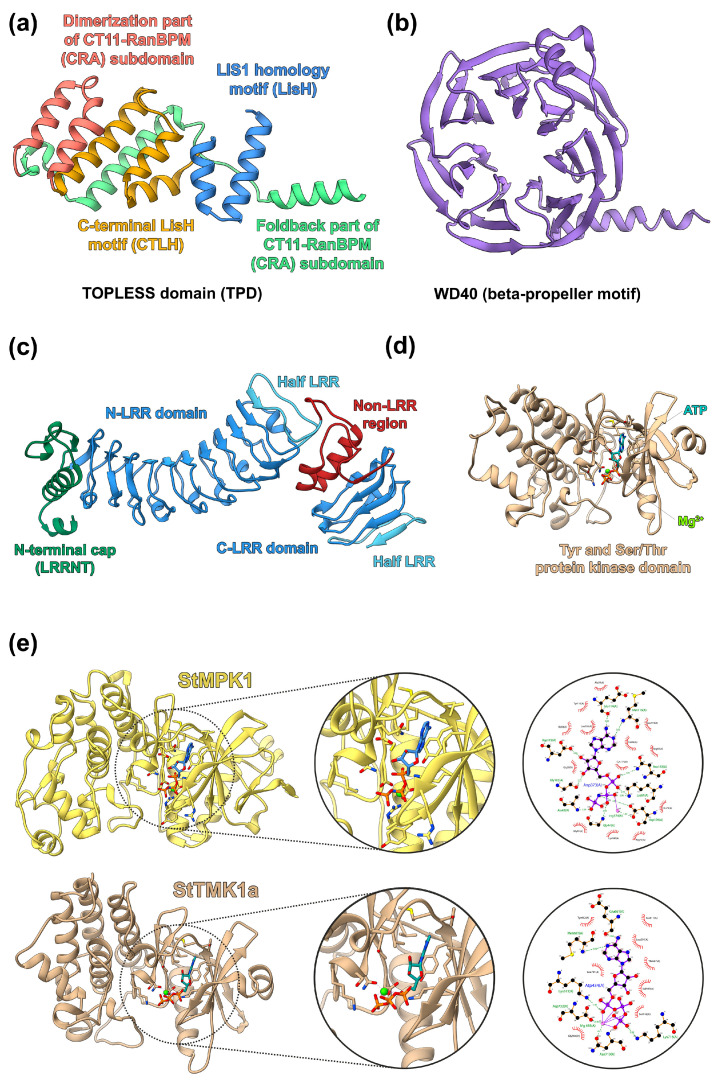
It has long been known that the phytohormone auxin plays a promoting role in tuber formation and stress tolerance in potatoes. Our study aimed to identify and characterize the complete sets of auxin-related genes that presumably constitute the entire auxin signaling system in potato (Solanum tuberosum L.). The corresponding genes were retrieved from sequenced genomes of the doubled monoploid S. tuberosum DM1-3-516-R44 (DM) of the Phureja group, the heterozygous diploid line RH89-039-16 (RH), and the autotetraploid cultivar Otava. Both canonical and noncanonical auxin signaling pathways were considered. Phylogenetic and domain analyses of deduced proteins were supplemented by expression profiling and 3D molecular modeling. The canonical and ABP1-mediated pathways of auxin signaling appeared to be well conserved. The total number of potato genes/proteins presumably involved in canonical auxin signaling is 46 and 108 in monoploid DM and tetraploid Otava, respectively. Among the studied potatoes, spectra of expressed genes obviously associated with auxin signaling were partly cultivar-specific and quite different from analogous spectrum in Arabidopsis. Most of the noncanonical pathways found in Arabidopsis appeared to have low probability in potato. This was equally true for all cultivars used irrespective of their ploidy. Thus, some important features of the (noncanonical) auxin signaling pathways may be variable and species-specific.
Overview
The claims and statistics of this paper haven’t been checked yet.
Run the check — free, no account needed. It reads the open-access text and checks the sources it cites.
Integrity signals
Registry
Cites
Statistics
Figures
Verification
Claims the paper makes
The claims and statistics of this paper haven’t been checked yet.
Run the check — free, no account needed. It reads the open-access text and checks the sources it cites.
Self-check
Percentages, sums and reported differences re-computed from the paper’s own numbers.
The self-check needs the paper’s full text.
Citations
Cites
The neighbor-joining method: a new method for reconstructing phylogenetic trees.
(1987) · Molecular Biology and Evolution · doi:10.1093/oxfordjournals.molbev.a040454 · Cited by 59,715
MEGA6: Molecular Evolutionary Genetics Analysis Version 6.0
Tamura, K., Stecher, G., Peterson, D., Filipski, A., & Kumar, S. (2013) · Molecular Biology and Evolution · doi:10.1093/molbev/mst197 · Cited by 47,205
UCSF Chimera—A visualization system for exploratory research and analysis
Pettersen, E. F., Goddard, T. D., Huang, C. C., Couch, G. S., Greenblatt, D. M., Meng, E. C., & Ferrin, T. E. (2004) · Journal of Computational Chemistry · doi:10.1002/jcc.20084 · Cited by 45,828
CONFIDENCE LIMITS ON PHYLOGENIES: AN APPROACH USING THE BOOTSTRAP
Felsenstein, J. (1985) · Evolution · doi:10.1111/j.1558-5646.1985.tb00420.x · Cited by 44,647
Highly accurate protein structure prediction with AlphaFold
Jumper, J., Evans, R., Pritzel, A., Green, T., Figurnov, M., Ronneberger, O., Tunyasuvunakool, K., Bates, R., Žídek, A., Potapenko, A., et al. (2021) · Nature · doi:10.1038/s41586-021-03819-2 · Cited by 43,764
Trott, O., & Olson, A. J. (2010) · Journal of Computational Chemistry · doi:10.1002/jcc.21334 · Cited by 38,412
Comparative Protein Modelling by Satisfaction of Spatial Restraints
Šali, A., & Blundell, T. L. (1993) · Journal of Molecular Biology · doi:10.1006/jmbi.1993.1626 · Cited by 12,977
Molecular Evolution and Phylogenetics
Nei, M., & Kumar, S. (2000) · doi:10.1093/oso/9780195135848.001.0001 · Cited by 8,012
LigPlot+: Multiple Ligand-Protein Interaction Diagrams for Drug Discovery
Laskowski, R., & Swindells, M. (2011) · Journal of Chemical Information and Modeling · doi:10.1021/ci200227u · Cited by 6,159
Algebraic decay in hierarchical graphs
Garcia, A., Sonnino, G., Malek-Mansour, M.-A., & Baras, F. (1998) · Dépôt institutionnel de l'Université libre de Bruxelles (Université Libre de Bruxelles) · doi:10.1023/a · Cited by 5,186
Protein complex prediction with AlphaFold-Multimer
Evans, R., O’Neill, M., Pritzel, A., Antropova, N., Senior, A., Green, T., Žídek, A., Bates, R., Blackwell, S., Yim, J., et al. (2021) · doi:10.1101/2021.10.04.463034 · Cited by 3,808
Statistical potential for assessment and prediction of protein structures
Shen, M., & Šali, A. (2006) · Protein Science · doi:10.1110/ps.062416606 · Cited by 2,349
Genome sequence and analysis of the tuber crop potato
Xu, X., Pan, S., Cheng, S., Zhang, B., Mu, D., Ni, P., Zhang, G., Guzman, F., Torres, M., Lozano, R., et al. (2011) · Nature · doi:10.1038/nature10158 · Cited by 2,110
Mechanism of auxin perception by the TIR1 ubiquitin ligase
Tan, X., Calderon-Villalobos, L. I. A., Sharon, M., Zheng, C., Robinson, C. V., Estelle, M., & Zheng, N. (2007) · Nature · doi:10.1038/nature05731 · Cited by 1,688
YASARA View—molecular graphics for all devices—from smartphones to workstations
Krieger, E., & Vriend, G. (2014) · Bioinformatics · doi:10.1093/bioinformatics/btu426 · Cited by 1,630
Krieger, E., Joo, K., Lee, J., Lee, J., Raman, S., Thompson, J., Tyka, M., Baker, D. A., & Karplus, K. J. (2009) · Proteins Structure Function and Bioinformatics · doi:10.1002/prot.22570 · Cited by 1,396
Nicot, N., Hausman, J.-F., Hoffmann, L., & Evers, D. (2005) · Journal of Experimental Botany · doi:10.1093/jxb/eri285 · Cited by 1,331
Guilfoyle, T. J., & Hagen, G. (2007) · Current Opinion in Plant Biology · doi:10.1016/j.pbi.2007.08.014 · Cited by 1,257
PIN-Dependent Auxin Transport: Action, Regulation, and Evolution
Adamowski, M., & Friml, J. (2015) · The Plant Cell · doi:10.1105/tpc.114.134874 · Cited by 839
A combinatorial TIR1/AFB–Aux/IAA co-receptor system for differential sensing of auxin
Villalobos, L. I. A. C., Lee, S., de Oliveira, C. A. F., Ivetac, A., Brandt, W., Armitage, L., Sheard, L. B., Tan, X., Parry, G., Mao, H., et al. (2012) · Nature Chemical Biology · doi:10.1038/nchembio.926 · Cited by 620
PrankWeb: a web server for ligand binding site prediction and visualization
Jendele, L., Krivák, R., Škoda, P., Novotný, M., & Hoksza, D. (2019) · Nucleic Acids Research · doi:10.1093/nar/gkz424 · Cited by 583
Aux/IAA Gene Family in Plants: Molecular Structure, Regulation, and Function
Luo, J., Zhou, J., & Zhang, J. (2018) · International Journal of Molecular Sciences · doi:10.3390/ijms19010259 · Cited by 581
The auxin signalling network translates dynamic input into robust patterning at the shoot apex
Vernoux, T., Brunoud, G., Farcot, E., Morin, V., Van den Daele, H., Legrand, J., Oliva, M., Das, P., Larrieu, A., Wells, D., et al. (2011) · Molecular Systems Biology · doi:10.1038/msb.2011.39 · Cited by 576
Complex regulation of the TIR1/AFB family of auxin receptors
Parry, G., Villalobos, L. I. A. C., Prigge, M. J., Péret, B., Dharmasiri, S., Itoh, H., Lechner, E., Gray, W. M., Bennett, M. J., & Estelle, M. A. (2009) · Proceedings of the National Academy of Sciences · doi:10.1073/pnas.0911967106 · Cited by 495
Structural Basis for DNA Binding Specificity by the Auxin-Dependent ARF Transcription Factors
Boer, R., Rios, A. F., van den Berg, W., Saaki, T. N. V., Manfield, I. W., Kepinski, S., López‐Vidriero, I., Franco‐Zorrilla, J. M., de Vries, S. C., Solano, R., et al. (2014) · Cell · doi:10.1016/j.cell.2013.12.027 · Cited by 456
ABP1 Mediates Auxin Inhibition of Clathrin-Dependent Endocytosis in Arabidopsis
Robert, S., Kleine-Vehn, J., Barbez, E., Sauer, M., Paciorek, T., Baster, P., Vanneste, S., Zhang, J., Simon, S., Čovanová, M., et al. (2010) · Cell · doi:10.1016/j.cell.2010.09.027 · Cited by 420
High-resolution de novo structure prediction from primary sequence
Wu, R., Ding, F., Wang, R., Shen, R., Zhang, X., Luo, S., Su, C., Wu, Z., Xie, Q., Berger, B., et al. (2022) · doi:10.1101/2022.07.21.500999 · Cited by 392
Chandler, J. (2015) · Plant Cell & Environment · doi:10.1111/pce.12662 · Cited by 357
Cell Surface ABP1-TMK Auxin-Sensing Complex Activates ROP GTPase Signaling
Xu, T., Dai, N., Chen, J., Nagawa, S., Cao, M., Li, H., Zhou, Z., Chen, X., Rycke, R. M. D., Bertrand-Rakusova, H., et al. (2014) · Science · doi:10.1126/science.1245125 · Cited by 354
In-vitro auxin binding to particulate cell fractions from corn coleoptiles
Hertel, R., Thomson, K.-S., & Russo, V. E. A. (1972) · Planta · doi:10.1007/bf00386394 · Cited by 333
Korasick, D. A., Westfall, C. S., Lee, S. G., Nanao, M., Dumas, R., Hagen, G., Guilfoyle, T. J., Jez, J. M., & Strader, L. C. (2014) · Proceedings of the National Academy of Sciences · doi:10.1073/pnas.1400074111 · Cited by 316
Auxin signaling: Research advances over the past 30 years
Yu, Z., Zhang, F., Friml, J., & Ding, Z. (2022) · Journal of Integrative Plant Biology · doi:10.1111/jipb.13225 · Cited by 289
Haplotype-resolved genome analyses of a heterozygous diploid potato
Zhou, Q., Tang, D., Huang, W., Yang, Z., Zhang, Y., Hamilton, J. P., Visser, R. G. F., Bachem, C., Buell, C. R., Zhang, Z., et al. (2020) · Nature Genetics · doi:10.1038/s41588-020-0699-x · Cited by 255
TMK1-mediated auxin signalling regulates differential growth of the apical hook
Cao, M., Chen, R., Li, P., Yu, Y., Zheng, R., Ge, D., Zheng, W., Wang, X., Gu, Y., Gelová, Z., et al. (2019) · Nature · doi:10.1038/s41586-019-1069-7 · Cited by 253
Chromosome-scale and haplotype-resolved genome assembly of a tetraploid potato cultivar
Sun, H., Jiao, W., Krause, K., Campoy, J. A., Goel, M., Folz‐Donahue, K., Kukat, C., Hüettel, B., & Schneeberger, K. (2022) · Nature Genetics · doi:10.1038/s41588-022-01015-0 · Cited by 226
Auxin response factors are keys to the many auxin doors
Cancé, C., Martín-Arevalillo, R., Boubekeur, K., & Dumas, R. (2022) · New Phytologist · doi:10.1111/nph.18159 · Cited by 200
Bauer, M. R., & Mackey, M. D. (2019) · Journal of Medicinal Chemistry · doi:10.1021/acs.jmedchem.8b01925 · Cited by 198
Structural basis for oligomerization of auxin transcriptional regulators
Nanao, M., Vinos-Poyo, T., Brunoud, G., Thévenon, E., Mazzoleni, M., Mast, D., Lainé, S., Wang, S., Hagen, G., Li, H., et al. (2014) · Nature Communications · doi:10.1038/ncomms4617 · Cited by 191
ABP1–TMK auxin perception for global phosphorylation and auxin canalization
Friml, J., Gallei, M., Gelová, Z., Johnson, A., Mazur, E., Monzer, A., Rodríguez, L., Roosjen, M., Verstraeten, I., Živanović, B. D., et al. (2022) · Nature · doi:10.1038/s41586-022-05187-x · Cited by 184
Hoopes, G. M., Meng, X., Hamilton, J. P., Achakkagari, S. R., Guedes, F. A. D. F., Bolger, M., Coombs, J. J., Esselink, D. G., Kaiser, N. R., Kodde, L. P., et al. (2022) · Molecular Plant · doi:10.1016/j.molp.2022.01.003 · Cited by 182
Prigge, M. J., Platre, M. P., Kadakia, N., Zhang, Y., Greenham, K., Szutu, W., Pandey, B. K., Bhosale, R., Bennett, M. J., Busch, W., et al. (2020) · eLife · doi:10.7554/elife.54740 · Cited by 175
The Arabidopsis Cell Cycle F-Box Protein SKP2A Binds to Auxin
Jurado, S., Abraham, Z., Manzano, C., López‐Torrejón, G., Pacios, L. F., & del Pozo, J. C. (2010) · The Plant Cell · doi:10.1105/tpc.110.078972 · Cited by 173
Crystal structure of auxin‐binding protein 1 in complex with auxin
Woo, E., Marshall, J., Bauly, J., Chen, J., Venis, M., Napier, R. M., & Pickersgill, R. W. (2002) · The EMBO Journal · doi:10.1093/emboj/cdf291 · Cited by 173
Adenylate cyclase activity of TIR1/AFB auxin receptors in plants
Qi, L., Kwiatkowski, M., Chen, H., Hoermayer, L., Sinclair, S. A., Zou, M., del Genio, C. I., Kubeš, M., Napier, R., Jaworski, K., et al. (2022) · Nature · doi:10.1038/s41586-022-05369-7 · Cited by 164
A noncanonical auxin-sensing mechanism is required for organ morphogenesis in ArabidopsisPreprint
Simonini, S., Deb, J., Moubayidin, L., Stephenson, P., Valluru, M. K., Rios, A. F., Sorefan, K., Weijers, D., Friml, J., & Østergaard, L. (2016) · Genes & Development · doi:10.1101/gad.285361.116 · Cited by 159
Auxin response factors in plant adaptation to drought and salinity stress
Verma, S., Negi, N. P., Pareek, S., Mudgal, G., & Kumar, D. (2022) · Physiologia Plantarum · doi:10.1111/ppl.13714 · Cited by 150
IntFOLD: an integrated web resource for high performance protein structure and function prediction
McGuffin, L. J., Adiyaman, R., Maghrabi, A. H. A., Shuid, A. N., Brackenridge, D. A., Nealon, J. O., & Philomina, L. S. (2019) · Nucleic Acids Research · doi:10.1093/nar/gkz322 · Cited by 144
Noncanonical auxin signaling regulates cell division pattern during lateral root development
Huang, R., Zheng, R., He, J., Zhou, Z., Wang, J., Xiong, Y., & Xu, T. (2019) · Proceedings of the National Academy of Sciences · doi:10.1073/pnas.1910916116 · Cited by 144
Hormonal regulation of tuber formation in potato plants
Aksenova, N. P., Konstantinova, T. N., Golyanovskaya, S. A., Sergeeva, L. I., & Romanov, G. A. (2012) · Russian Journal of Plant Physiology · doi:10.1134/s1021443712040024 · Cited by 133
Self-citationCianfrocco, M. A., Wong-Barnum, M., Youn, C., Wagner, R., & Leschziner, A. E. (2017) · Practice and Experience in Advanced Research Computing · doi:10.1145/3093338.3093390 · Cited by 129
Design principles of a minimal auxin response system
Kato, H., Mutte, S. K., Suzuki, H., Crespo, I., Das, S., Radoeva, T., Fontana, M., Yoshitake, Y., Hainiwa, E., van den Berg, W., et al. (2020) · Nature Plants · doi:10.1038/s41477-020-0662-y · Cited by 126
Rios, A. F., Tanaka, K., Crespo, I., van der Wijk, E., Sizentsova, Y., Levitsky, V. G., Lindhoud, S., Fontana, M., Hohlbein, J., Boer, R., et al. (2020) · Proceedings of the National Academy of Sciences · doi:10.1073/pnas.2009554117 · Cited by 125
Lv, B., Wei, K., Hu, K., Tian, T., Zhang, F., Yu, Z., Zhang, D., Su, Y., Sang, Y. L., Zhang, X., et al. (2020) · Molecular Plant · doi:10.1016/j.molp.2020.11.011 · Cited by 122
Dai, N., Wang, W., Patterson, S. E., & Bleecker, A. B. (2013) · PLoS ONE · doi:10.1371/journal.pone.0060990 · Cited by 118
Auxin signalling in growth: Schrödinger’s cat out of the bag
Gallei, M., Luschnig, C., & Friml, J. (2019) · Current Opinion in Plant Biology · doi:10.1016/j.pbi.2019.10.003 · Cited by 118
Lv, B., Yu, Q., Liu, J., Wen, X., Yan, Z., Hu, K., Li, H., Kong, X., Li, C., Tian, H., et al. (2019) · The EMBO Journal · doi:10.15252/embj.2019101515 · Cited by 116
Fourteen Stations of AuxinPreprint
Friml, J. (2021) · Cold Spring Harbor Perspectives in Biology · doi:10.1101/cshperspect.a039859 · Cited by 116
Key players associated with tuberization in potato: potential candidates for genetic engineering
Dutt, S., Manjul, A. S., Raigond, P., Singh, B., Siddappa, S., Bhardwaj, V., Kawar, P. G., Patil, V. U., & Kardile, H. B. (2017) · Critical Reviews in Biotechnology · doi:10.1080/07388551.2016.1274876 · Cited by 112
GGTase3 is a newly identified geranylgeranyltransferase targeting a ubiquitin ligase
Kuchay, S., Wang, H., Marzio, A., Jain, K., Homer, H., Fehrenbacher, N., Philips, M. R., Zheng, N., & Pagano, M. (2019) · Nature Structural & Molecular Biology · doi:10.1038/s41594-019-0249-3 · Cited by 109
The Multiple Signals That Control Tuber Formation
Hannapel, D. J., Sharma, P., Lin, T., & Banerjee, A. K. (2017) · PLANT PHYSIOLOGY · doi:10.1104/pp.17.00272 · Cited by 107
PHABULOSA Mediates an Auxin Signaling Loop to Regulate Vascular Patterning in Arabidopsis
Müller, C. J., Valdés, A. E., Wang, G., Ramachandran, P., Beste, L., Uddenberg, D., & Carlsbecker, A. (2015) · PLANT PHYSIOLOGY · doi:10.1104/pp.15.01204 · Cited by 106
Faivre‐Rampant, O., Cardle, L., Marshall, D., Viola, R., & Taylor, M. A. (2004) · Journal of Experimental Botany · doi:10.1093/jxb/erh075 · Cited by 103
Martín-Arevalillo, R., Nanao, M., Larrieu, A., Vinos-Poyo, T., Mast, D., Galván-Ampudia, C. S., Brunoud, G., Vernoux, T., Dumas, R., & Parcy, F. (2017) · Proceedings of the National Academy of Sciences · doi:10.1073/pnas.1703054114 · Cited by 101
Auxins in potato: molecular aspects and emerging roles in tuber formation and stress resistance
Kolachevskaya, O. O., Lomin, S. N., Arkhipov, D. V., & Romanov, G. A. (2019) · Plant Cell Reports · doi:10.1007/s00299-019-02395-0 · Cited by 96
Self-citationAuxin dynamics: the dazzling complexity of a small molecule’s message
Delker, C., Raschke, A., & Quint, M. (2008) · Planta · doi:10.1007/s00425-008-0710-8 · Cited by 94
A network of transcriptional repressors modulates auxin responses
Truskina, J., Han, J., Chrysanthou, E., Galván-Ampudia, C. S., Lainé, S., Brunoud, G., Macé, J., Bellows, S., Legrand, J., Bågman, A.-M., et al. (2020) · Nature · doi:10.1038/s41586-020-2940-2 · Cited by 94
STUDIES ON TUBERIZATION OF SOLANUM ANDIGENA
Kumar, D., & Wareing, P. F. (1974) · New Phytologist · doi:10.1111/j.1469-8137.1974.tb01311.x · Cited by 93
Auxin: An emerging regulator of tuber and storage root development
Kondhare, K. R., Patil, A. B., & Giri, A. P. (2021) · Plant Science · doi:10.1016/j.plantsci.2021.110854 · Cited by 91
SKP2A, an F‐box protein that regulates cell division, is degraded via the ubiquitin pathway
Jurado, S., Trivino, S. D., Abraham, Z., Manzano, C., Gutiérrez, C., & del Pozo, J. C. (2007) · The Plant Journal · doi:10.1111/j.1365-313x.2007.03378.x · Cited by 86
Direct ETTIN-auxin interaction controls chromatin states in gynoecium development
Kuhn, A., Harborough, S. R., McLaughlin, H. M., Natarajan, B., Verstraeten, I., Friml, J., Kepinski, S., & Østergaard, L. (2020) · eLife · doi:10.7554/elife.51787 · Cited by 82
Song, S., Hao, L., Zhao, P., Xu, Y. F., Zhong, N., Zhang, H., & Liu, N. (2019) · Scientific Reports · doi:10.1038/s41598-018-37923-7 · Cited by 80
Kou, X., Zhao, X., Wu, B., Wang, C., Wu, C., Yang, S., Zhou, J., & Xue, Z. (2022) · Applied Sciences · doi:10.3390/app12031360 · Cited by 73
Kolachevskaya, O. O., Alekseeva, V. V., Sergeeva, L. I., Борисовна, Р. Е., Getman, I. A., Vreugdenhil, D., Buryanov, Y. I., & Romanov, G. A. (2014) · Journal of Integrative Plant Biology · doi:10.1111/jipb.12314 · Cited by 69
Self-citationLeydon, A. R., Wang, W., Gala, H., Gilmour, S., Juarez-Solis, S., Zahler, M. L., Zemke, J. E., Zheng, N., & Nemhauser, J. L. (2021) · eLife · doi:10.7554/elife.66739 · Cited by 69
Gao, J., Cao, X., Shi, S., Ma, Y., Wang, K., Liu, S., Chen, D., Chen, Q., & Ma, H. (2016) · Biochemical and Biophysical Research Communications · doi:10.1016/j.bbrc.2016.02.013 · Cited by 68
Distinct subclades of Aux/IAA genes are direct targets of ARF 5/ MP transcriptional regulation
Krogan, N. T., Yin, X., Ckurshumova, W., & Berleth, T. (2014) · New Phytologist · doi:10.1111/nph.12994 · Cited by 62
Structural Biology of Nuclear Auxin Action
Dinesh, D. C., Villalobos, L. I. A. C., & Abel, S. (2015) · Trends in Plant Science · doi:10.1016/j.tplants.2015.10.019 · Cited by 61
The PIN family of proteins in potato and their putative role in tuberization
Roumeliotis, E., Kloosterman, B., Oortwijn, M. E. P., Visser, R. G. F., & Bachem, C. (2013) · Frontiers in Plant Science · doi:10.3389/fpls.2013.00524 · Cited by 60
Kolachevskaya, O. O., Sergeeva, L. I., Floková, K., Getman, I. A., Lomin, S. N., Alekseeva, V. V., Борисовна, Р. Е., Buryanov, Y. I., & Romanov, G. A. (2016) · Plant Cell Reports · doi:10.1007/s00299-016-2091-y · Cited by 59
Self-citationThe induction of transport channels by auxin
Sachs, T. (1975) · Planta · doi:10.1007/bf00380716 · Cited by 57
Systematic analysis of specific and nonspecific auxin effects on endocytosis and trafficking
Narasimhan, M., Gallei, M., Tan, S., Johnson, A., Verstraeten, I., Li, L., Rodríguez, L., Han, H., Himschoot, E., Wang, R., et al. (2021) · PLANT PHYSIOLOGY · doi:10.1093/plphys/kiab134 · Cited by 56
No Time for Transcription—Rapid Auxin Responses in PlantsPreprint
Dubey, S. M., Serre, N. B., Oulehlová, D., Vittal, P., & Fendrych, M. (2021) · Cold Spring Harbor Perspectives in Biology · doi:10.1101/cshperspect.a039891 · Cited by 53
Auxin canalization: From speculative models toward molecular players
Hajný, J., Tan, S., & Friml, J. (2022) · Current Opinion in Plant Biology · doi:10.1016/j.pbi.2022.102174 · Cited by 51
Molecular Mechanisms of Diverse Auxin Responses during Plant Growth and Development
Zhang, Y., Yu, J., Xu, X., Wang, R., Liu, Y., Huang, S., Wei, H., & Wei, Z. (2022) · International Journal of Molecular Sciences · doi:10.3390/ijms232012495 · Cited by 51
Auxin perception: in the IAA of the beholder
Bargmann, B. O. R., & Estelle, M. A. (2013) · Physiologia Plantarum · doi:10.1111/ppl.12135 · Cited by 43
Developmental roles of Auxin Binding Protein 1 in Arabidopsis thaliana
Gelová, Z., Gallei, M., Pernisová, M., Brunoud, G., Zhang, X., Glanc, M., Li, L., Michalko, J., Pavlovičová, Z., Verstraeten, I., et al. (2020) · Plant Science · doi:10.1016/j.plantsci.2020.110750 · Cited by 43
Collins, J., O’Grady, K. E., Chen, S., & Gurley, W. B. (2019) · Plant Molecular Biology · doi:10.1007/s11103-019-00842-w · Cited by 40
Distinct functions of TIR1 and AFB1 receptors in auxin signaling
Chen, H., Li, L., Zou, M., Qi, L., & Friml, J. (2023) · Molecular Plant · doi:10.1016/j.molp.2023.06.007 · Cited by 40
The Story of Auxin-Binding Protein 1 (ABP1)Preprint
Napier, R. (2021) · Cold Spring Harbor Perspectives in Biology · doi:10.1101/cshperspect.a039909 · Cited by 38
Kumar, R., Agarwal, P., Pareek, A., Tyagi, A. K., & Sharma, A. K. (2015) · Plant Molecular Biology Reporter · doi:10.1007/s11105-015-0856-z · Cited by 36
Kolachevskaya, O. O., Myakushina, Y. A., Getman, I. A., Lomin, S. N., Deyneko, I. V., Deigraf, S. V., & Romanov, G. A. (2021) · International Journal of Molecular Sciences · doi:10.3390/ijms22158207 · Cited by 34
Self-citationMari, R. S., Schrinner, S., Finkers, R., Ziegler, F. M. R., Arens, P., Schmidt, M., Usadel, B., Klau, G. W., & Marschall, T. (2024) · Genome biology · doi:10.1186/s13059-023-03160-z · Cited by 32
Aksenova, N. P., Konstantinova, T., Golyanovskaya, S. A., Koßmann, J., Willmitzer, L., & Romanov, G. A. (2000) · MPG.PuRe (Max Planck Society) · Cited by 31
Self-citationÇalışkan, M. E., Yavuz, C., Yağız, A. K., Demirel, U., & Çalışkan, S. (2020) · Potato Research · doi:10.1007/s11540-020-09463-z · Cited by 31
Simonini, S., Mas, P. J., Mas, C., Østergaard, L., & Hart, D. J. (2018) · Scientific Reports · doi:10.1038/s41598-018-31634-9 · Cited by 29
Protoplast Swelling and Hypocotyl Growth Depend on Different Auxin Signaling Pathways
Dahlke, R. I., Fraas, S., Ullrich, K. K., Heinemann, K., Romeiks, M., Rickmeyer, T., Klebe, G., Palme, K. J., Lüthen, H., & Steffens, B. (2017) · PLANT PHYSIOLOGY · doi:10.1104/pp.17.00733 · Cited by 28
Kong, Y., Chen, J., Jiang, L., Chen, H., Shen, Y., Wang, L., Yan, Y., Zhou, H., Zheng, H., Yu, F., et al. (2023) · Plant Communications · doi:10.1016/j.xplc.2023.100559 · Cited by 28
Determinants of PB1 Domain Interactions in Auxin Response Factor ARF5 and Repressor IAA17
Kim, Y., Park, C., Cha, S., Han, M., Ryu, K., & Suh, J. (2020) · Journal of Molecular Biology · doi:10.1016/j.jmb.2020.04.007 · Cited by 25
Natural Auxin Does Not Inhibit Brefeldin A Induced PIN1 and PIN2 Internalization in Root Cells
Paponov, I. A., Friz, T., Budnyk, V., Teale, W., Wüst, F., Paponov, M., Al‐Babili, S., & Palme, K. J. (2019) · Frontiers in Plant Science · doi:10.3389/fpls.2019.00574 · Cited by 23
Iwakawa, H., Takahashi, H., Machida, Y., & Machida, C. (2020) · International Journal of Molecular Sciences · doi:10.3390/ijms21197314 · Cited by 22
Noncanonical Auxin SignalingPreprint
McLaughlin, H. M., Ang, A. C. H., & Østergaard, L. (2021) · Cold Spring Harbor Perspectives in Biology · doi:10.1101/cshperspect.a039917 · Cited by 22
Core features of the hormonal status in in vitro grown potato plants
Kolachevskaya, O. O., Sergeeva, L. I., Getman, I. A., Lomin, S. N., Savelieva, E. M., & Romanov, G. A. (2018) · Plant Signaling & Behavior · doi:10.1080/15592324.2018.1467697 · Cited by 20
Self-citationCrystal structure of an LRR protein with two solenoids
Liu, P., Hu, Z., Zhou, B., Liu, S., & Chai, J. (2012) · Cell Research · doi:10.1038/cr.2012.159 · Cited by 19
Romanov, G. A. (2002) · Russian Journal of Plant Physiology · doi:10.1023/a:1016380529991 · Cited by 15
Self-citationFactors Affect to Stolon Formation and Tuberization in Potato: A Review
Abeytilakarathna, P. D. (2021) · Agricultural Reviews · doi:10.18805/ag.r-187 · Cited by 15
Essential role of the CD docking motif of MPK4 in plant immunity, growth, and development
Siodmak, A., Hameed, U. F. S., Rayapuram, N., Völz, R., Boudsocq, M., Alharbi, S., Alhoraibi, H., Lee, Y., Blilou, I., Arold, S. T., et al. (2023) · New Phytologist · doi:10.1111/nph.18989 · Cited by 14
Hormonal Regulation of Tuber Formation in Potato
Aksenova, N. P., Sergeeva, L. I., Kolachevskaya, O. O., & Romanov, G. A. (2013) · CRC Press eBooks · doi:10.1201/b16136-3 · Cited by 9
Self-citationKolachevskaya, O. O., Lomin, S. N., Kojima, M., Getman, I. A., Sergeeva, L. I., Sakakibara, H., & Romanov, G. A. (2019) · Russian Journal of Plant Physiology · doi:10.1134/s1021443720010094 · Cited by 8
Self-citationPhenotypic variation and correlations between monoploids and doubled monoploids of Solanum phureja
M’Ribu, H. K., & Veilleux, R. E. (1991) · Euphytica · doi:10.1007/bf00023004 · Cited by 4
Research works printed but not linked: 3
- Ramavat, K., and Mérillon, J. (2014). Bulbous Plants: Biotechnology, Taylor & Francis Group.
- Veilleux, R.E. (1990). Haploids in Crop Improvement I, Springer.
- Romanov, 1989, Hormone-binding proteins of plants and the problem of perception of phytohormones, Russ. J. Plant Physiol., 36, 136
Metadata
- Authors
- Lomin, S. N., Kolachevskaya, O. O., Arkhipov, D. V., & Romanov, G. A.
- Affiliations
- Russian Academy of Sciences (RU)
- Corresponding author
- Romanov, Georgy A.
- Venue
- International Journal of Molecular Sciences
- Publisher
- MDPI AG
- Published
- 2023-07-13
- Volume
- 24
- Issue
- 14
- Pages
- 11408
- ISSN
- 1422-0067 (ISSN-L)
- PMC
- PMC10380454
- OpenAlex
- W4384341506
- Cited by
- 3
- References
- 109
- Citations by year
- 2026: 1 · 2024: 1 · 2023: 1
- FWCI
- 0.47
- Type
- journal article
- Language
- en
- Open access
- gold
- doi.org
- Licence
- Locations
- International Journal of Molecular Sciences (publishedVersion, cc-by)
- Preprints.org (acceptedVersion, cc-by)
- PubMed Central (publishedVersion, cc-by)
- PubMed (publishedVersion)
- Funders
- Russian Science Foundation (17-74-20181)
- Topics
- Life Sciences › Agricultural and Biological Sciences › Plant Science › Plant Molecular Biology Research
- Life Sciences › Agricultural and Biological Sciences › Plant Science › Plant Parasitism and Resistance
- Life Sciences › Agricultural and Biological Sciences › Plant Science › Light effects on plants
- Keywords
- auxin signaling, potato, ploidy, autotetraploids, diploids, ABP1, tuberization, gene expression profiling, species specificity, Arabidopsis comparison
- MeSH terms
- Indoleacetic Acids, Phylogeny, Solanum tuberosum, Arabidopsis, Gene Expression Regulation, Plant, Tetraploidy
About these checks
Registry, retraction, Cites and statistics results are computed, not judged, with one exception: a printed reference that no index lists is read once by a model before it counts as a citation error. Claims are extracted by a model and kept only when their quote appears verbatim in the text; each cited source is then checked, with a model’s help, for whether it says what the claim relies on. Those verdicts can be wrong — read the claim’s quote and the cited source before relying on one.
Statistics and arithmetic are recomputed, not judged.
Confidence bands are shown only for fields calibrated on our annotated test set. None is calibrated yet, so no band is shown.
What counts as a claim ›How we measure confidence ›How we check this ›
Are you an author, or do you see a problem with this page? Request a review
Data sources
Bibliographic data: Semantic Scholar, OpenAlex, Crossref.
Contains information from the Semantic Scholar Academic Graph Datasets, made available under the ODC Attribution License (ODC-BY 1.0).
Semantic Scholar’s data is described in: Kinney, R., et al. (2023). The Semantic Scholar Open Data Platform. arXiv:2301.10140.
