

The DOI matches its Crossref record; 30 of the 30 references it cites were found in a registry or an index.
Metabolomic Profiling Reveals the Anti-Herbivore Mechanisms of Rice (Oryza sativa)
Open accessAbstract
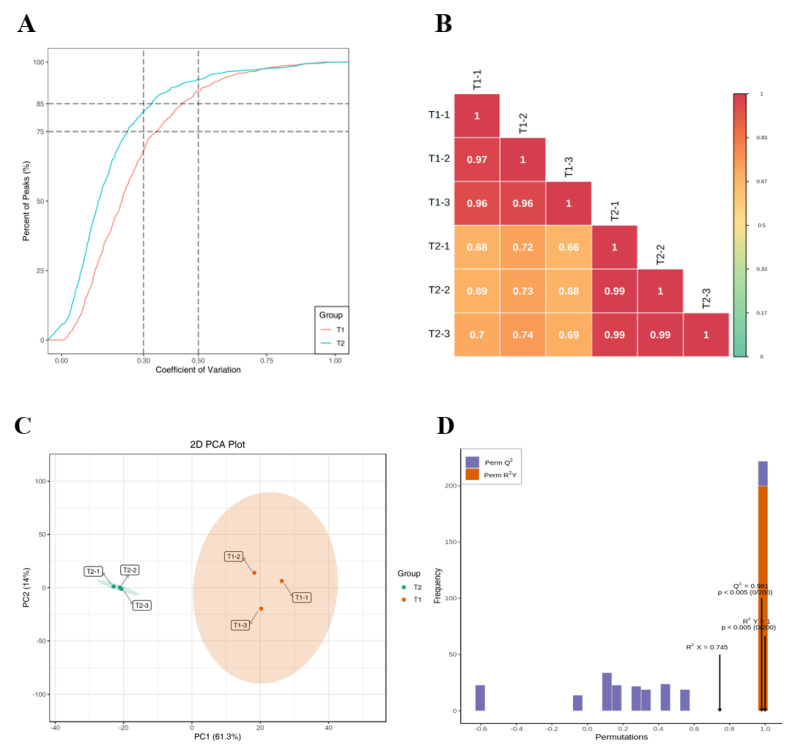
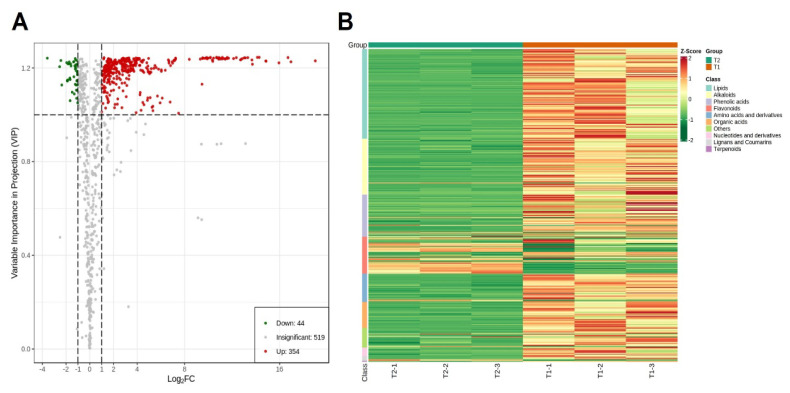
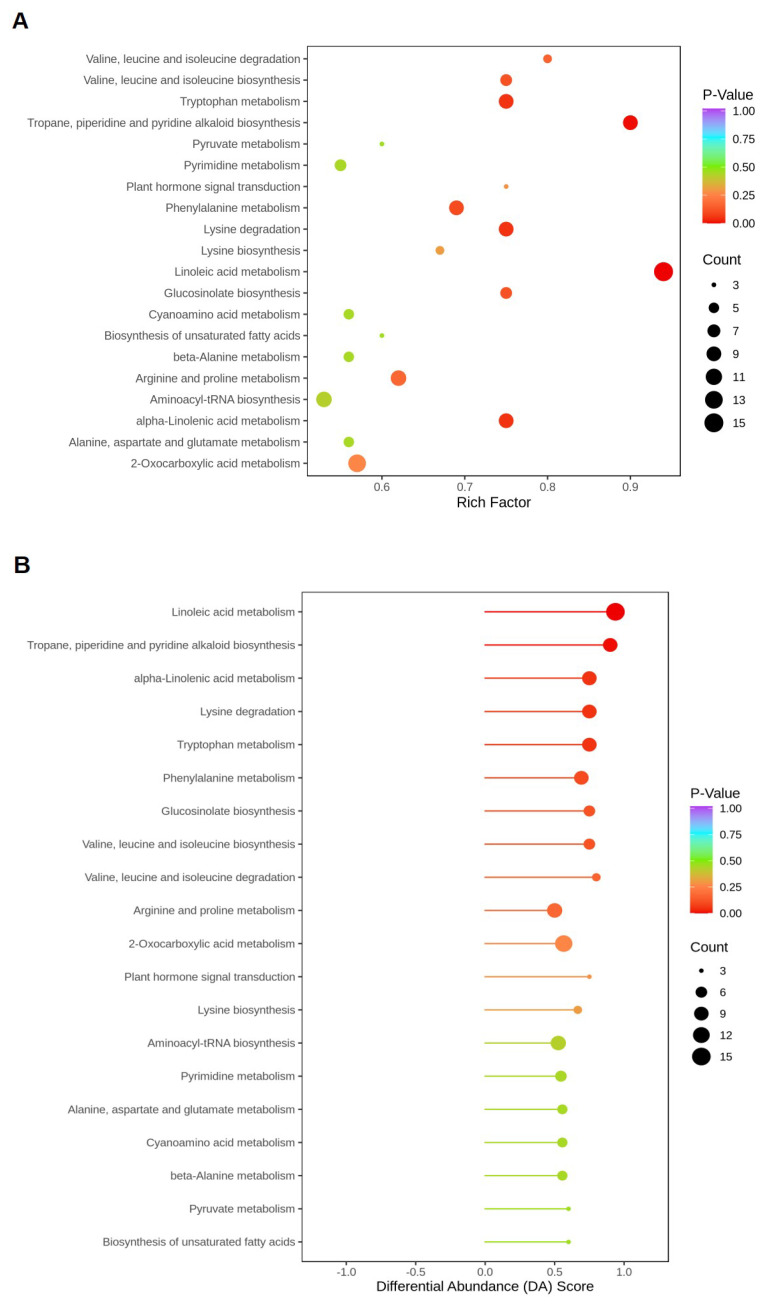
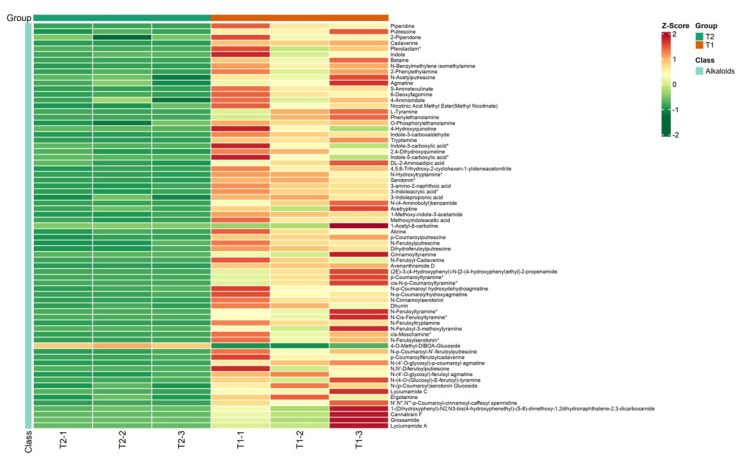
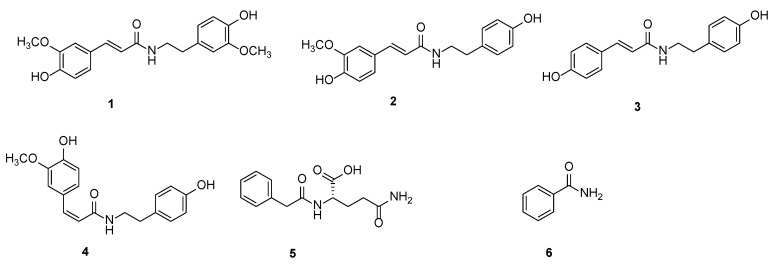
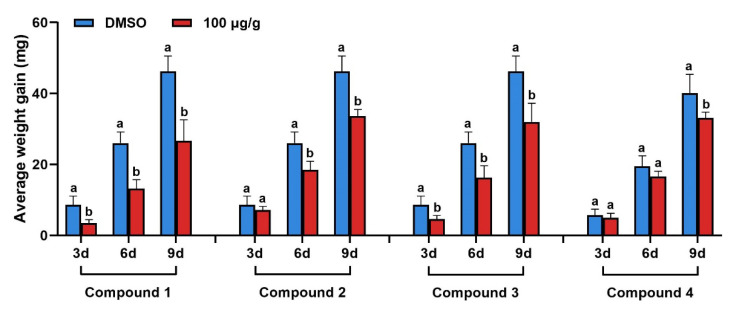
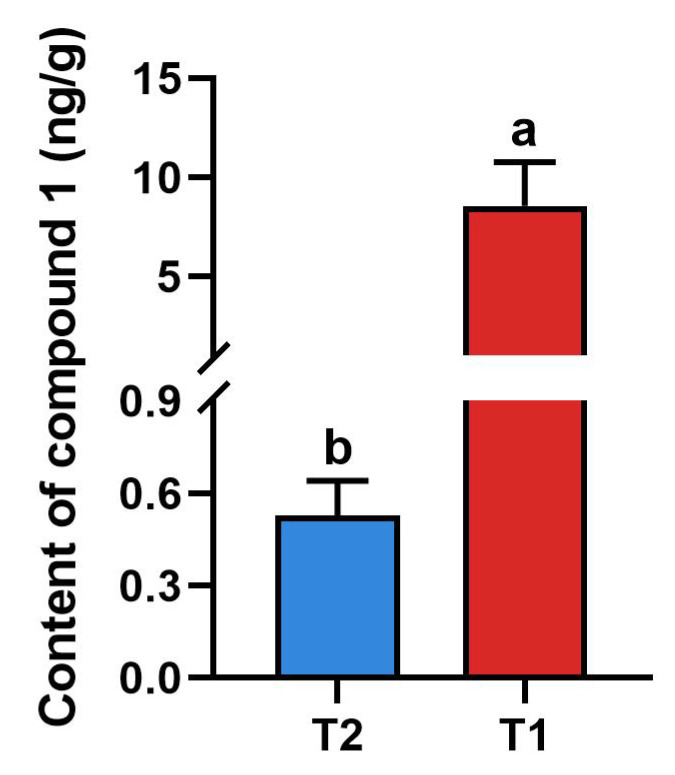
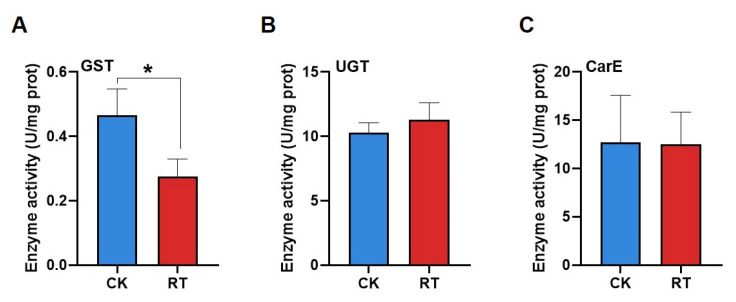
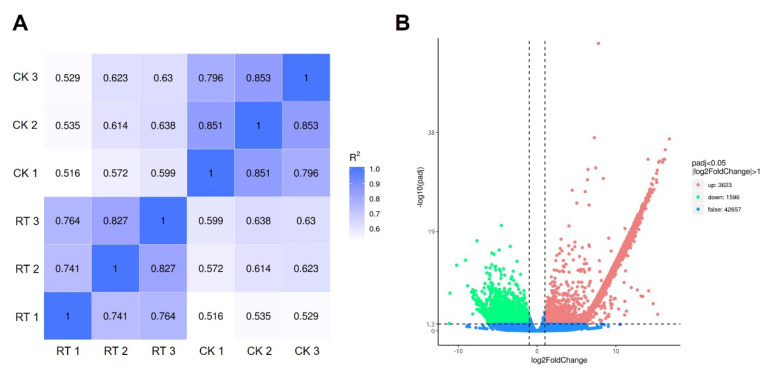
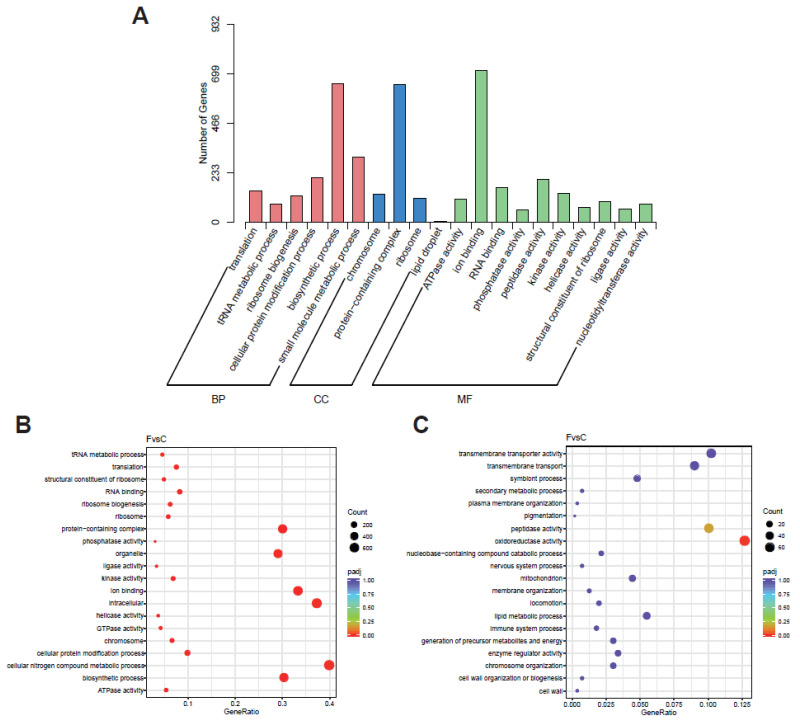
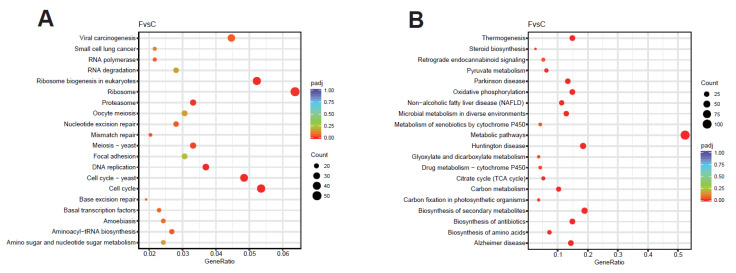
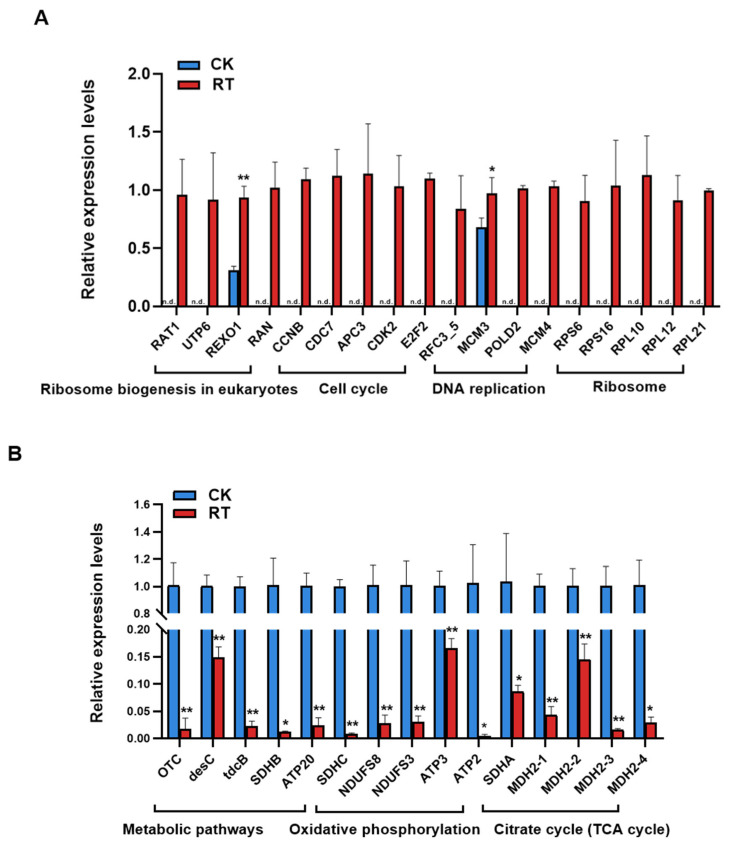
The use of secondary metabolites of rice to control pests has become a research hotspot, but little is known about the mechanism of rice self-resistance. In this study, metabolomics analysis was performed on two groups of rice (T1, with insect pests; T2, without pests), indicating that fatty acids, alkaloids, and phenolic acids were significantly up-regulated in T1. The up-regulated metabolites (p-value < 0.1) were enriched in linoleic acid metabolism, terpene, piperidine, and pyridine alkaloid biosynthesis, α-linolenic acid metabolism, and tryptophan metabolism. Six significantly up-regulated differential metabolites in T1 were screened out: N-trans-feruloyl-3-methoxytyramine (1), N-trans-feruloyltyramine (2), N-trans-p-coumaroyltyramine (3), N-cis-feruloyltyramine (4), N-phenylacetyl-L-glutamine (5), and benzamide (6). The insect growth inhibitory activities of these six different metabolites were determined, and the results show that compound 1 had the highest activity, which significantly inhibited the growth of Chilo suppressalis by 59.63%. Compounds 2–4 also showed a good inhibitory effect on the growth of Chilo suppressalis, while the other compounds had no significant effect. RNA-seq analyses showed that larval exposure to compound 1 up-regulated the genes that were significantly enriched in ribosome biogenesis in eukaryotes, the cell cycle, ribosomes, and other pathways. The down-regulated genes were significantly enriched in metabolic pathways, oxidative phosphorylation, the citrate cycle (TCA cycle), and other pathways. Eighteen up-regulated genes and fifteen down-regulated genes from the above significantly enriched pathways were screened out and verified by real-time quantitative PCR. The activities of detoxification enzymes (glutathione S-transferase (GST); UDP-glucuronosyltransferase (UGT); and carboxylesterase (CarE)) under larval exposure to compound 1 were measured, which indicated that the activity of GST was significantly inhibited by compound 1, while the activities of the UGT and CarE enzymes did not significantly change. As determined by UPLC-MS, the contents of compound 1 in the T1 and T2 groups were 8.55 ng/g and 0.53 ng/g, respectively, which indicated that pest insects significantly induced the synthesis of compound 1. Compound 1 may enhance rice insect resistance by inhibiting the detoxification enzyme activity and metabolism of Chilo suppressalis, as well as promoting cell proliferation to affect its normal growth and development process. The chemical–ecological mechanism of the insect resistance of rice is preliminarily clarified in this paper.
Overview
The claims and statistics of this paper haven’t been checked yet.
Run the check — free, no account needed. It reads the open-access text and checks the sources it cites.
Integrity signals
Registry
Cites
Statistics
Figures
Verification
Claims the paper makes
The claims and statistics of this paper haven’t been checked yet.
Run the check — free, no account needed. It reads the open-access text and checks the sources it cites.
Claims other papers make about this one
Each is checked against this paper’s own text: does it say what the citing paper says it does?
The source backs part of the claim, not all of it — or backs it for a different population, condition or comparison.
In the citing paper
“The presence of these compounds in the feed given to C. suppressalis resulted in a weight loss at concentrations of 100 μg/g, suggesting anti-insect and antifeedant activity.”
From Exploring the Lesser-Known Bioactive Natural Products of Plant Species of the Genus Cannabis L.: Alkaloids, Phenolic Compounds, and Their Therapeutic Potential (2025) · cites this paper as [84]
Experimental — accuracy not yet measuredThe cited source says what the claim attributes to it.
In the citing paper
“N-p-trans-coumaroyltyramine and N-trans-feruloyltyramine were reportedly produced in response to Chilo suppressalis exposure in rice (Orza sativa, cv. Oochikara), suggesting a role in herbivore insect management [84].”
Self-check
Percentages, sums and reported differences re-computed from the paper’s own numbers.
The self-check needs the paper’s full text.
Citations
Cites
Induced Responses to Herbivory
Karban, R., & Baldwin, I. T. (1997) · University of Chicago Press eBooks · doi:10.7208/chicago/9780226424972.001.0001 · Cited by 2,703
Stress and defense responses in plant secondary metabolites production
Isah, T. (2019) · Biological Research · doi:10.1186/s40659-019-0246-3 · Cited by 1,492
Insect glutathione transferases and insecticide resistance
Enayati, A. A., Ranson, H., & Hemingway, J. (2005) · Insect Molecular Biology · doi:10.1111/j.1365-2583.2004.00529.x · Cited by 1,084
Diversity in Chemical Structures and Biological Properties of Plant Alkaloids
Bhambhani, S., Kondhare, K. R., & Giri, A. P. (2021) · Molecules · doi:10.3390/molecules26113374 · Cited by 526
Applications of Multi-Omics Technologies for Crop Improvement
Yang, Y., Saand, M. A., Huang, L., Abdelaal, W. B., Zhang, J., Wu, Y., Li, J., Sirohi, M. H., & Wang, F. (2021) · Frontiers in Plant Science · doi:10.3389/fpls.2021.563953 · Cited by 440
Role of jasmonic acid in plants: the molecular point of view
Ghorbel, M., Brini, F., Sharma, A., & Landi, M. (2021) · Plant Cell Reports · doi:10.1007/s00299-021-02687-4 · Cited by 391
Molecular mechanisms of insect adaptation to plant secondary compounds
Heidel‐Fischer, H. M., & Vogel, H. (2015) · Current Opinion in Insect Science · doi:10.1016/j.cois.2015.02.004 · Cited by 341
Application of Remote Sensors in Mapping Rice Area and Forecasting Its Production: A Review
Mosleh, M. K., Hassan, Q. K., & Chowdhury, E. H. (2015) · Sensors · doi:10.3390/s150100769 · Cited by 303
Secondary Metabolites of Plants and their Role: Overview
Pagare, S., Bhatia, M., Tripathi, N., Pagare, S., & Bansal, Y. K. (2015) · Current Trends in Biotechnology and Pharmacy · Cited by 299
Gamma-aminobutyrate: defense against invertebrate pests?
Bown, A. W., MacGregor, K. B., & Shelp, B. J. (2006) · Trends in Plant Science · doi:10.1016/j.tplants.2006.07.002 · Cited by 185
Research works printed but not linked: 5
- Yang, 2021, The insect-resistance physiology of plants: A review, Chin. Agr. Sci. Bull., 37, 130
- Li, 2018, Research progress of chemical interactions between rice and brown planthopper, Plant Physiol. J., 54, 528
- Lv, Y.H. (2007). Comparision of Defense Chemicals of Rice Plants Infested by Different Herbivores and Setup of Rice Lines with Antisense Inhibition of Defense-Related Gene OPR1 or PLD3. [Master’s Thesis, Zhejiang University].
- Luo, T., Lu, H.P., and Shu, Q.Y. (2015, January 27–30). The pathway of tryptophan metabolism influences the defense response of rice to brown planthopper. Proceedings of the 7th Symposium on Plant Allelopathy in China, Kunming, China.
- Cheng, Y.B. (2021). Mechanisms of ROS-CncC Pathway Regulating Insecticide Tolerance in Response to Phytochemicals in Spodoptera litura. [Master’s Thesis, Fujian Agriculture and Forestry University].
Cited by
Sorted by citations
Boucher, R., Germain, H., & Desgagné-Penix, I. (2025) · Plants · doi:10.3390/plants14091372 · Cited by 23
Metabolome study of rice population and resistance to brown planthopper
Li, T., Zhang, Q., Ye, M., Cheng, Y., Yang, J., Wang, J., Xing, B., Guan, W., Jia-mei, L., Liu, C., et al. (2025) · Journal of Integrative Plant Biology · doi:10.1111/jipb.70035 · Cited by 7
Unveiling the root–rhizosphere environment of perennial wheat: a metabolomic perspective
Giannelli, G., Luche, S., Righetti, L., Galaverna, G., Bonini, P., Gazza, L., & Visioli, G. (2025) · BMC Plant Biology · doi:10.1186/s12870-025-07008-5 · Cited by 6
Regulatory mechanisms underlying stress-induced accumulation of plant secondary metabolites
He, S., Wang, J., Yang, N., Li, H., Li, K., Li, L., Wen, W., Luo, T., Zhao, J., & Xu, D. (2025) · Journal of Applied Research on Medicinal and Aromatic Plants · doi:10.1016/j.jarmap.2025.100689 · Cited by 5
Higher accumulation of mitragynine in Mitragyna speciosa (kratom) leaves affected by insect attack
Leksungnoen, N., Andriyas, T., Tansawat, R., Pongchaidacha, P., Khaoiam, P., Thanusuwannasak, T., Ngernsaengsaruay, C., Thanoosing, C., & Uthairatsamee, S. (2025) · PLoS ONE · doi:10.1371/journal.pone.0320941 · Cited by 4
Metadata
- Authors
- Gu, C., Zhang, Y., Wang, M., Lin, Y., Zeng, B., Zheng, X., Song, Y., & Zeng, R.
- Affiliations
- Fujian Agriculture and Forestry University (CN)
- Corresponding author
- Song, Yuanyuan
- Zeng, Rensen
- Venue
- International Journal of Molecular Sciences
- Publisher
- MDPI AG
- Published
- 2024-05-29
- Volume
- 25
- Issue
- 11
- Pages
- 5946
- ISSN
- 1422-0067 (ISSN-L)
- PMC
- PMC11172427
- OpenAlex
- W4399174257
- Cited by
- 11
- References
- 30
- Citations by year
- 2026: 3 · 2025: 8
- FWCI
- 3.56
- Type
- journal article
- Language
- en
- Open access
- gold
- doi.org
- Licence
- Locations
- International Journal of Molecular Sciences (publishedVersion, cc-by)
- PubMed Central (publishedVersion, cc-by)
- PubMed (publishedVersion)
- Funders
- National Natural Science Foundation of China (31800332, 32371588, XJQ201922, 2021J01095, 2021J01075, 2022J01591, GBMUC-2019-007)
- Distinguished Youth Talent Program of the Fujian Agriculture and Forestry University (31800332, 32371588, XJQ201922, 2021J01095, 2021J01075, 2022J01591, GBMUC-2019-007)
- Natural Science Foundation of Fujian Province (31800332, 32371588, XJQ201922, 2021J01095, 2021J01075, 2022J01591, GBMUC-2019-007)
- Fujian Agriculture and Forestry University (31800332, 32371588, XJQ201922, 2021J01095, 2021J01075, 2022J01591, GBMUC-2019-007)
- Topics
- Life Sciences › Agricultural and Biological Sciences › Insect Science › Insect-Plant Interactions and Control
- Life Sciences › Agricultural and Biological Sciences › Plant Science › Insect Pest Control Strategies
- Life Sciences › Biochemistry, Genetics and Molecular Biology › Molecular Biology › Plant biochemistry and biosynthesis
- Keywords
- plant defense against herbivores, Chilo suppressalis, secondary metabolites, N-trans-feruloyltyramine, benzamide, insect growth inhibition, phenolic acids, fatty acids, glutathione S-transferase, detoxification enzymes
- MeSH terms
- Alkaloids, Animals, Coumaric Acids, Oryza, Tyramine, Gene Expression Regulation, Plant, Metabolomics, Metabolome, Herbivory
About these checks
Registry, retraction, Cites and statistics results are computed, not judged, with one exception: a printed reference that no index lists is read once by a model before it counts as a citation error. Claims are extracted by a model and kept only when their quote appears verbatim in the text; each cited source is then checked, with a model’s help, for whether it says what the claim relies on. Those verdicts can be wrong — read the claim’s quote and the cited source before relying on one.
Statistics and arithmetic are recomputed, not judged.
Confidence bands are shown only for fields calibrated on our annotated test set. None is calibrated yet, so no band is shown.
What counts as a claim ›How we measure confidence ›How we check this ›
Are you an author, or do you see a problem with this page? Request a review
How to cite
Cite CoChat for the checks on this page, and the paper for its own findings.
- This page
- CoChat. (2026). Citation check: Metabolomic Profiling Reveals the Anti-Herbivore Mechanisms of Rice (Oryza sativa). https://app.cochat.ai/papers/10.3390/ijms25115946
- The paper
- Gu, C., Zhang, Y., Wang, M., Lin, Y., Zeng, B., Zheng, X., Song, Y., & Zeng, R. (2024). Metabolomic Profiling Reveals the Anti-Herbivore Mechanisms of Rice (Oryza sativa). International Journal of Molecular Sciences. https://doi.org/10.3390/ijms25115946
