

The DOI matches its Crossref record; 27 of the 27 references it cites were found in a registry or an index; none of the 4 sources its claims cite is checked for support yet.
Temporal Graph Attention Network for Spatio-Temporal Feature Extraction in Research Topic Trend Prediction
Open accessAbstract
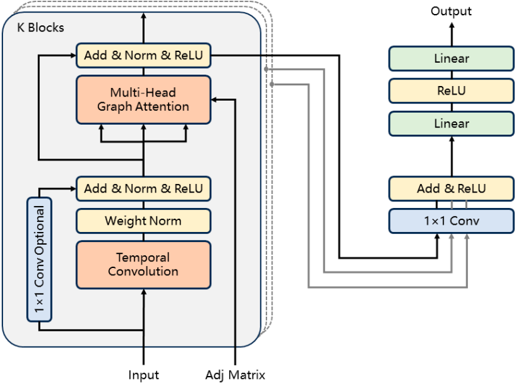
Comprehensively extracting spatio-temporal features is essential to research topic trend prediction. This necessity arises from the fact that research topics exhibit both temporal trend features and spatial correlation features. This study proposes a Temporal Graph Attention Network (T-GAT) to extract the spatio-temporal features of research topics and predict their trends. In this model, a temporal convolutional layer is employed to extract temporal trend features from multivariate topic time series. Additionally, a multi-head graph attention layer is introduced to capture spatial correlation features among research topics. This layer learns attention scores from the data by using scaled dot product operations and updates edge weights between topics accordingly, thereby mitigating the issue of over-smoothing. Furthermore, we introduce WFtopic-econ and WFtopic-polit, two domain-specific datasets for Chinese research topics constructed from the Wanfang Academic Database. Extensive experiments demonstrate that T-GAT outperforms baseline models in prediction accuracy, with RMSE and MAE being reduced by 4.8% to 7.1% and 14.5% to 18.4%, respectively, while R2 improved by 4.8% to 7.9% across varying observation time steps on the WFtopic-econ dataset. Moreover, on the WFtopic-polit dataset, RMSE and MAE were reduced by 4.0% to 5.3% and 10.0% to 10.7%, respectively, and R2 improved by 7.6% to 14.4%. These results validate the effectiveness of integrating graph attention with temporal convolution to model the spatio-temporal evolution of research topics, providing a robust tool for scholarly trend analysis and decision making.
Overview
CoChat Summary
TL;DR
The paper proposes a Temporal Graph Attention Network (T-GAT) that combines dilated temporal convolution with multi-head scaled dot-product graph attention to jointly extract temporal trend and spatial correlation features of research topics, and uses it to predict topic popularity trends. Experiments on two new Chinese-language datasets (WFtopic-econ, WFtopic-polit) show T-GAT outperforming LSTM, GRU, T-GCN, and Graph WaveNet baselines on RMSE, MAE, and R².
Key findings
- On WFtopic-econ, T-GAT reduced RMSE by 4.8%–7.1% and MAE by 14.5%–18.4%, and improved R² by 4.8%–7.9% relative to baselines across varying observation time steps; on WFtopic-polit, RMSE fell 4.0%–5.3%, MAE 10.0%–10.7%, and R² rose 7.6%–14.4%.
- Absolute T-GAT results: WFtopic-econ RMSE 105.32–113.63, MAE 62.47–67.04, R² 0.612–0.618; WFtopic-polit RMSE 86.209–97.213, MAE 51.820–58.256, R² 0.438–0.465 (Table 2).
- Spatio-temporal graph models (T-GAT, T-GCN, Graph WaveNet) had RMSE 10.75–43.16 lower than LSTM/GRU on WFtopic-econ, and Graph WaveNet's MAE was 6.14–14.60 lower than T-GCN's, indicating convolutional temporal extraction outperformed recurrent extraction.
- T-GAT converged fastest (31 epochs on WFtopic-econ, 45 on WFtopic-polit) but had the longest per-epoch training time (0.054 s and 0.035 s); t-tests against Graph WaveNet yielded all p-values < 0.05.
Methods
- Design: T-GAT stacks spatio-temporal blocks, each with a dilated causal temporal convolutional layer (gating removed, weight normalization and residual connections added) and a multi-head graph attention layer using scaled dot-product attention with adjacency-based masking; outputs are averaged across 4 heads, followed by two fully connected layers.
- Data: Two datasets built from Wanfang Chinese Academic Database metadata — WFtopic-econ (40,254 economics papers, 1999–2021; 367 nodes, 6212 edges, time span 1991–2021) and WFtopic-polit (146 nodes, 1932 edges). Topics are keywords appearing ≥20 times; edges are keyword co-occurrence; node features are annual citation counts.
- Analysis: Sliding-window setup (observation window 4, prediction window 1; also tested at 6 and 8 steps), 60/40 chronological train-test split, MSE loss, Adam optimizer (lr 1×10⁻³, weight decay 1×10⁻⁵), hidden dimension 32, kernel size 2, up to 3000 epochs with early stopping; evaluated with RMSE, MAE, and R².
Limitations
- Stated by the authors: the model's training time is relatively long, and its ability to extract correlation features still requires improvement; they plan to address both in future work, including investigating logarithmic quantization.
- Evident from the text: the datasets are limited to two Chinese-language domains (economics and politics) from a single database, so generalization to other disciplines or languages is untested; the paper reports no ablation isolating the contribution of the scaled dot-product attention versus the temporal convolution alone.
Model-written summary. Check it against the paper before relying on it.
Integrity signals
Registry
Cites
Statistics
Figures




Verification
Claims the paper makes
0 Valid · 5 Not valid · 5 Not checked · 55 Own results and interpretations
A result the paper reports from its own data — it cites no other source for it, so there is none to check. The quote shows it is in the paper.
In the paper
“Specifically, in the WFtopic-econ dataset, the T-GAT proposed in this study requires only three to five observation time steps to achieve a significant reduction in the MAE of the predictive outcomes.”
§ Temporal Graph Attention Network for Spatio-Temporal Feature Extraction in Research Topic Trend Prediction > •
plainstates a cause- Asserted: passes — The authors put it forward as true.
- Checkable: passes — It can be checked against evidence.
- Load-bearing: passes — The paper’s conclusions depend on it.
- Based: passes — The paper gives a reason why it holds.
A result the paper reports from its own data — it cites no other source for it, so there is none to check. The quote shows it is in the paper.
In the paper
“on the WFtopic-polit dataset, RMSE and MAE were reduced by 4.0% to 5.3% and 10.0% to 10.7%, respectively, and R 2 improved by 7.6% to 14.4%.”
§ Temporal Graph Attention Network for Spatio-Temporal Feature Extraction in Research Topic Trend Prediction > Abstract
plainstates a cause- Asserted: passes — The authors put it forward as true.
- Checkable: passes — It can be checked against evidence.
- Load-bearing: passes — The paper’s conclusions depend on it.
- Based: passes — The paper gives a reason why it holds.
- Rests on an assumption not shown here.
A result the paper reports from its own data — it cites no other source for it, so there is none to check. The quote shows it is in the paper.
In the paper
“On one hand, the training time of the model is relatively long.”
§ Temporal Graph Attention Network for Spatio-Temporal Feature Extraction in Research Topic Trend Prediction > 6. Conclusions
plain- Asserted: passes — The authors put it forward as true.
- Checkable: passes — It can be checked against evidence.
- Load-bearing: unclear — It is unclear whether the paper’s conclusions depend on it.
- Based: passes — The paper gives a reason why it holds.
A result the paper reports from its own data — it cites no other source for it, so there is none to check. The quote shows it is in the paper.
In the paper
“The training times for spatio-temporal graph neural networks, such as T-GAT, T-GCN, and Graph WaveNet, are 0.021 to 0.036 s per epoch longer than that of GRU.”
§ Temporal Graph Attention Network for Spatio-Temporal Feature Extraction in Research Topic Trend Prediction > •
plainstates an association- Asserted: passes — The authors put it forward as true.
- Checkable: passes — It can be checked against evidence.
- Load-bearing: unclear — It is unclear whether the paper’s conclusions depend on it.
- Based: passes — The paper gives a reason why it holds.
A result the paper reports from its own data — it cites no other source for it, so there is none to check. The quote shows it is in the paper.
In the paper
“Furthermore, the results of the t-tests for T-GAT and Graph WaveNet are illustrated in Figure 4, with all p-values being less than 0.05, confirming the improvements of T-GAT.”
§ Temporal Graph Attention Network for Spatio-Temporal Feature Extraction in Research Topic Trend Prediction > •
plain- Asserted: passes — The authors put it forward as true.
- Checkable: passes — It can be checked against evidence.
- Load-bearing: passes — The paper’s conclusions depend on it.
- Based: passes — The paper gives a reason why it holds.
40 more claims
Create a free account to see all 65 claims and to verify the 4 references still open.
- It may state two separate claims as one. 11
- The quote only partly states this claim. 2
- Probably not a substantial claim. 12
Self-check
Percentages, sums and reported differences re-computed from the paper’s own numbers.
Each contradiction between two passages listed here was confirmed by an independent check.
Rated minor: it would not touch a result — a value no result rests on, a p-value that stays on the same side of the significance level, or a conflict that is clerical, resolved elsewhere in the paper, or outside its own findings.
In the paper
§ Temporal Graph Attention Network for Spatio-Temporal Feature Extraction in Research Topic Trend Prediction > 5.1. Dataset
“For WFtopic-econ, we first collected metadata from 40,254 papers in the field of economics, spanning the years 1999 to 2021.”
§ Temporal Graph Attention Network for Spatio-Temporal Feature Extraction in Research Topic Trend Prediction > 6. Conclusions
“| WFtopic-econ | 367 | 6212 | 1991-2021 | 0 | 4203 | 234.697 |”
Citations
Cites
Vaswani, A., Shazeer, N., Parmar, N., Uszkoreit, J., Jones, L., Gomez, A. N., Kaiser, L., & Polosukhin, I. (2017) · arXiv · doi:10.48550/arxiv.1706.03762 · Cited by 120,404
Semi-supervised classification with graph convolutional networks
Kipf, T. N., & Welling, M. (2016) · arXiv · doi:10.48550/arxiv.1609.02907 · Cited by 24,853
An Empirical Evaluation of Generic Convolutional and Recurrent Networks for Sequence Modeling
Bai, S., Kolter, J. Z., & Koltun, V. (2018) · arXiv · doi:10.48550/arxiv.1803.01271 · Cited by 4,655
T-GCN: A Temporal Graph Convolutional Network for Traffic Prediction
Zhao, L., Song, Y., Zhang, C., Liu, Y., Wang, P., Lin, T., Deng, M., & Li, H. (2020) · IEEE Transactions on Intelligent Transportation Systems · doi:10.1109/tits.2019.2935152 · Cited by 3,326
Graph WaveNet for Deep Spatial-Temporal Graph Modeling
Wu, Z., Pan, S., Long, G., Jiang, J., & Zhang, C. (2019) · Proceedings of the Twenty-Eighth International Joint Conference on Artificial Intelligence · doi:10.24963/ijcai.2019/264 · Cited by 2,948
Taylor, S. J., & Letham, B. (2018) · The American Statistician · doi:10.1080/00031305.2017.1380080 · Cited by 2,737
Long sequence time-series forecasting with deep learning: A survey
Chen, Z., Ma, M., Li, T., Wang, H., & Li, C. (2023) · Information Fusion · doi:10.1016/j.inffus.2023.101819 · Cited by 349
RGDAN: A random graph diffusion attention network for traffic prediction
Fan, J., Weng, W., Tian, H., Wu, H., Zhu, F., & Wu, J. X. (2024) · Neural Networks · doi:10.1016/j.neunet.2023.106093 · Cited by 122
A Comparison of TCN and LSTM Models in Detecting Anomalies in Time Series Data
Gopali, S., Abri, F., Siami‐Namini, S., & Namin, A. S. (2021) · IEEE International Conference on Big Data (BigData) · doi:10.1109/bigdata52589.2021.9671488 · Cited by 119
Emerging research topics detection with multiple machine learning models
Xu, S., Hao, L., An, X., Yang, G., & Wang, F. (2019) · Journal of Informetrics · doi:10.1016/j.joi.2019.100983 · Cited by 73
Research works printed but not linked: 2
- Box, G.E., Jenkins, G.M., Reinsel, G.C., and Ljung, G.M. (2015). Time Series Analysis: Forecasting and Control, John Wiley & Sons.
- Veličković, P., Cucurull, G., Casanova, A., Romero, A., Liò, P., and Bengio, Y. (May, January 30). Graph Attention Networks. Proceedings of the International Conference on Learning Representations, Vancouver, BC, Canada.
Cited by
Arora, I., & Gangadharappa, M. (2025) · Modelling—International Open Access Journal of Modelling in Engineering Science · doi:10.3390/modelling6020033 · Cited by 5
Cheng, W., Zheng, X., Zheng, D., Li, M., & Tianshi, C. (2026) · Journal of Informetrics · doi:10.1016/j.joi.2025.101765 · Cited by 5
Pandey, B. B. (2026) · Precision Journal of Information Technology & Scientific Innovation · doi:10.67887/pd2601202006 · Cited by 5
Mawarni, E., & Hendrawan, A. (2025) · International Journal on Data Science · doi:10.18517/ijods.6.2.103-112.2025 · Cited by 3
Fusing Time Series and Tweet Semantics: A Cross-Modal LLM Framework for Topic Popularity Forecasting
Zheng, J., Peng, X., Dai, G., & Zhang, B. (2025) · International Conference on Machine Learning and Computer Application (ICMLCA) · doi:10.1109/icmlca66850.2025.11336482 · Cited by 2
Kim, M., Lee, S., Oh, D., Park, B., Jo, J., & Lee, C. (2026) · Mathematics · doi:10.3390/math14030471 · Cited by 2
Wang, L., Zhang, K., Sikdar, B., Wang, Y., Bi, W., & Ning, J. (2026) · IEEE Transactions on Smart Grid · doi:10.1109/tsg.2026.3698557
Kumar, K., & Venkatesan, A. (2026) · International Conference on Data Science and Business Systems (ICDSBS) · doi:10.1109/icdsbs69077.2026.11634858
Facial Age Estimation Using a Hybrid EfficientNet-LSTM Network with Texture-Aware Feature FusionPreprint
Chen, Y.-L., Huang, H., Pan, Y.-S., Chen, P.-A., & Lin, L.-W. (2026) · SSRN Electronic Journal · doi:10.2139/ssrn.7265754
윤동규, Hwang, M., Baek, J., Shin, D., & Whang, J. J. (2026) · arXiv (Cornell University) · doi:10.48550/arxiv.2610.25281
A comparative study of pond linings for effective water storage in arid and semi-arid regions
Kaboré, T. V. R., Keïta, A., Maïga, I. M., Barbier, B., Lawane, A., & Sawadogo, B. (2026) · Applied Water Science · doi:10.1007/s13201-026-03023-5
Metadata
- Authors
- Guo, Z., Lu, M., & Han, J.
- Affiliations
- Nanjing University of Information Science and Technology (CN)
- Nanjing University (CN)
- Venue
- Mathematics
- Publisher
- MDPI AG
- Published
- 2025-02-20
- Volume
- 13
- Issue
- 5
- Pages
- 686
- ISSN
- 2227-7390 (ISSN-L)
- OpenAlex
- W4407782414
- Cited by
- 11
- References
- 26
- Citations by year
- 2026: 8 · 2025: 3
- FWCI
- 2.10
- Type
- journal article
- Language
- en
- Open access
- gold
- doi.org
- Licence
- Locations
- Mathematics (publishedVersion, cc-by)
- Preprints.org (submittedVersion, cc-by)
- RePEc: Research Papers in Economics (submittedVersion)
- DOAJ (DOAJ: Directory of Open Access Journals) (submittedVersion, cc-by-sa)
- Funders
- “Design, Evaluation, and Research & Development of Lightweight Cryptographic Systems for the Application Scenarios of Blockchain” (SYC2022093)
- Topics
- Physical Sciences › Computer Science › Artificial Intelligence › Advanced Graph Neural Networks
- Social Sciences › Transportation › Traffic Prediction and Management Techniques
- Physical Sciences › Computer Science › Information Systems › Recommender Systems and Techniques
- Keywords
- spatiotemporal feature extraction, temporal graph attention network, graph attention networks, temporal convolutional network, over-smoothing
About these checks
Registry, retraction, Cites and statistics results are computed, not judged, with one exception: a printed reference that no index lists is read once by a model before it counts as a citation error. Claims are extracted by a model and kept only when their quote appears verbatim in the text; each cited source is then checked, with a model’s help, for whether it says what the claim relies on. Those verdicts can be wrong — read the claim’s quote and the cited source before relying on one.
A language model drew the claims from the paper on 2026-11-18, under version 3 of the claim definition (model deepseek-v4.1-flash, prompt extract-v3).
A second model labelled each claim on 2026-11-18 (model jev-1.13-20260917, definition revision gold-guideline-v0.2).
Statistics and arithmetic are recomputed, not judged.
Confidence bands are shown only for fields calibrated on our annotated test set. None is calibrated yet, so no band is shown.
What counts as a claim ›How we measure confidence ›How we check this ›
Are you an author, or do you see a problem with this page? Request a review
Data sources
Bibliographic data: Semantic Scholar, OpenAlex, Crossref.
Contains information from the Semantic Scholar Academic Graph Datasets, made available under the ODC Attribution License (ODC-BY 1.0).
Semantic Scholar’s data is described in: Kinney, R., et al. (2023). The Semantic Scholar Open Data Platform. arXiv:2301.10140.
