

Spectrum Analysis Enabled Periodic Feature Reconstruction Based Automatic Defect Detection System for Electroluminescence Images of Photovoltaic Modules
Open accessThe DOI matches its Crossref record; the references it cites are not checked yet.
Abstract
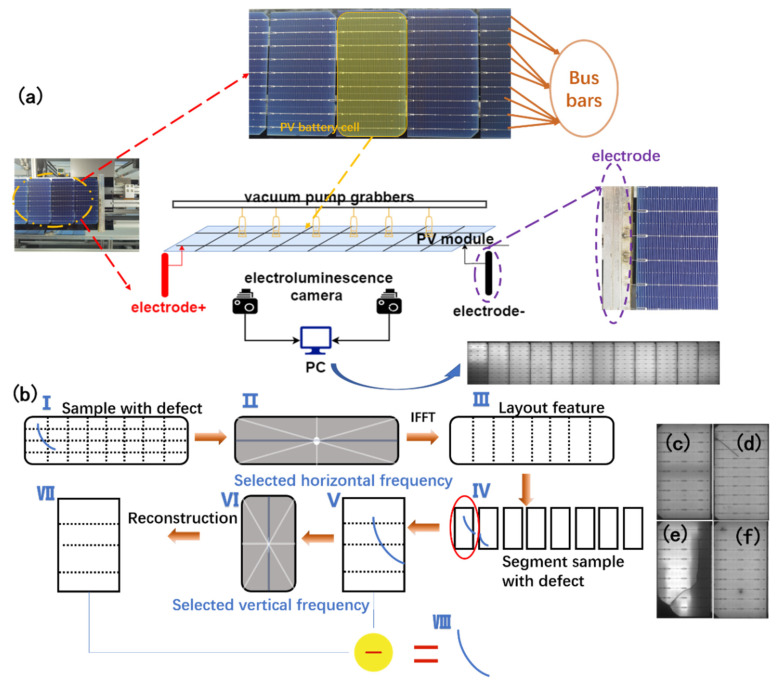
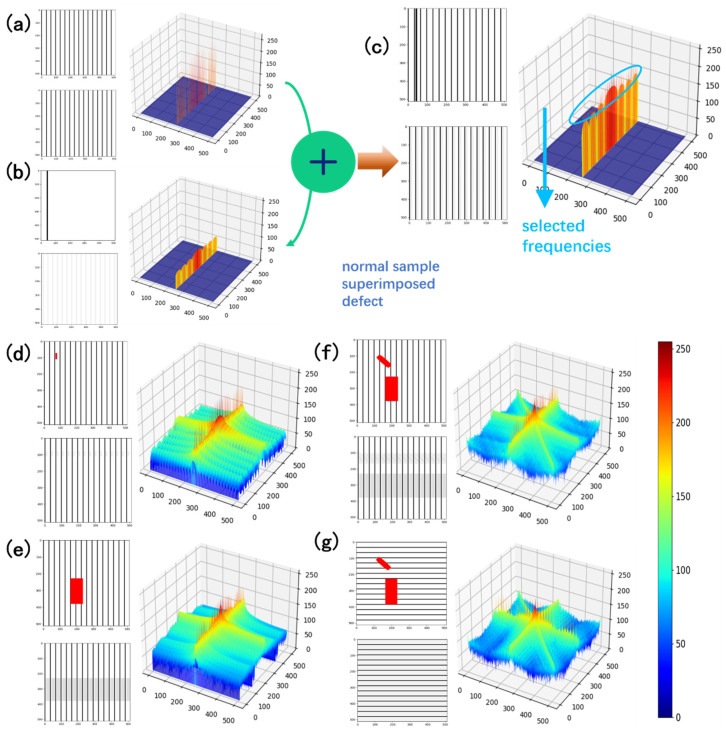
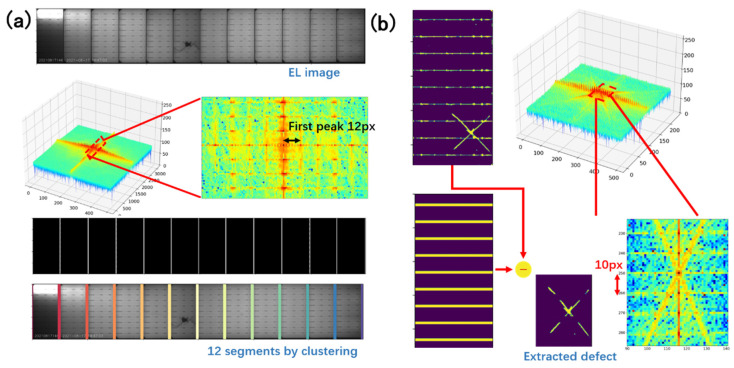
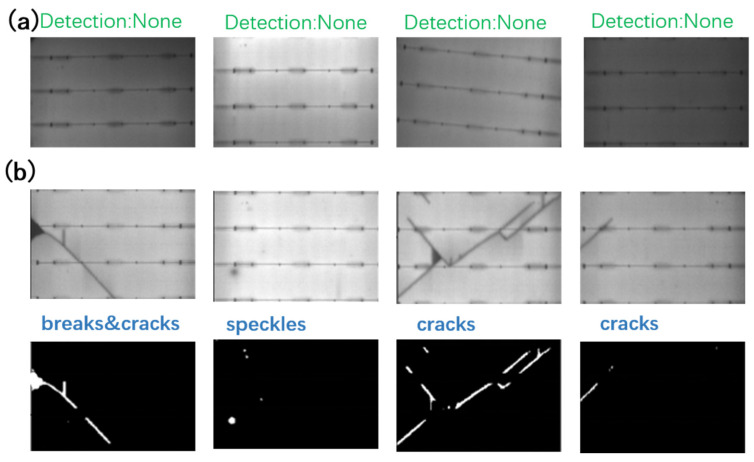
Electroluminescence (EL) imaging is a widely adopted method in quality assurance of the photovoltaic (PV) manufacturing industry. With the growing demand for high-quality PV products, automatic inspection methods based on machine vision have become an emerging area concern to replace manual inspectors. Therefore, this paper presents an automatic defect-inspection method for multi-cell monocrystalline PV modules with EL images. A processing routine is designed to extract the defect features of the PV module, eliminating the influence of the intrinsic structural features. Spectrum domain analysis is applied to effectively reconstruct an improved PV layout from a defective one by spectrum filtering in a certain direction. The reconstructed image is used to segment the PV module into cells and slices. Based on the segmentation, defect detection is carried out on individual cells or slices to detect cracks, breaks, and speckles. Robust performance has been achieved from experiments on many samples with varying illumination conditions and defect shapes/sizes, which shows the proposed method can efficiently distinguish intrinsic structural features from the defect features, enabling precise and speedy defect detections on multi-cell PV modules.
Overview
The claims and statistics of this paper haven’t been checked yet.
Free: it reads the open-access text and checks the first 5 claims that cite a source we can check. Create a free account to check every claim.
Integrity signals
Registry
Cites
Statistics
Figures
Verification
Claims the paper makes
The claims and statistics of this paper haven’t been checked yet.
Free: it reads the open-access text and checks the first 5 claims that cite a source we can check. Create a free account to check every claim.
Claims other papers make about this one
Each is checked against this paper’s own text: does it say what the citing paper says it does?
The check wasn’t confident either way, so it gives no verdict — never disputed.
In the citing paper
“However, the collected and retrieved images and extracted frames lacked in terms of quality and resolution, and thus the model would suffer by being impotent and incapacitated in retrieving integral features that would prominently aid towards differentiating between moderate and severe accidents [22].”
From A Real-Time Computer Vision Based Approach to Detection and Classification of Traffic Incidents (2023) · cites this paper as [22]
Experimental — accuracy not yet measured
Self-check
Percentages, sums and reported differences re-computed from the paper’s own numbers.
The self-check needs the paper’s full text.
Citations
The citation lists are queued
They are fetched later and appear here then.
References 22 · Cited by 14
Metadata
- Authors
- Yu, J., Yang, Y., Zhang, H., Sun, H., Zhang, Z., Xia, Z., Zhu, J., Dai, M., & Wen, H.
- Affiliations
- Southeast University (CN)
- Corresponding author
- Zhang, Zhisheng
- Xia, Zhijie
- Zhu, Jianxiong
- Venue
- Micromachines
- Publisher
- MDPI AG
- Published
- 2022-02-19
- Volume
- 13
- Issue
- 2
- Pages
- 332
- ISSN
- 2072-666X (ISSN-L)
- PMC
- PMC8876488
- OpenAlex
- W4220762544
- Cited by
- 14
- References
- 22
- Citations by year
- 2026: 2 · 2025: 2 · 2024: 4 · 2023: 4 · 2022: 2
- FWCI
- 1.38
- Type
- journal article
- Language
- en
- Open access
- gold
- doi.org
- Licence
- Locations
- Micromachines (publishedVersion, cc-by)
- SSRN Electronic Journal (acceptedVersion)
- PubMed Central (publishedVersion, cc-by)
- PubMed (publishedVersion)
- DOAJ (DOAJ: Directory of Open Access Journals) (submittedVersion, cc-by-sa)
- Funders
- National Natural Science Foundation of China (51775108)
- Topics
- Physical Sciences › Engineering › Industrial and Manufacturing Engineering › Industrial Vision Systems and Defect Detection
- Physical Sciences › Engineering › Civil and Structural Engineering › Infrastructure Maintenance and Monitoring
- Physical Sciences › Engineering › Electrical and Electronic Engineering › Silicon and Solar Cell Technologies
- Keywords
- electroluminescence imaging, photovoltaic module defect detection, automated inspection, spectral filtering, cell segmentation, crack detection, speckle detection, automated visual inspection
About these checks
Registry, retraction, Cites and statistics results are computed, not judged, with one exception: a printed reference that no index lists is read once by a model before it counts as a citation error. Claims are extracted by a model and kept only when their quote appears verbatim in the text; each cited source is then checked, with a model’s help, for whether it says what the claim relies on. Those verdicts can be wrong — read the claim’s quote and the cited source before relying on one.
Statistics and arithmetic are recomputed, not judged.
Confidence bands are shown only for fields calibrated on our annotated test set. None is calibrated yet, so no band is shown.
What counts as a claim ›How we measure confidence ›How we check this ›
Are you an author, or do you see a problem with this page? Request a review
How to cite
Cite CoChat for the checks on this page, and the paper for its own findings.
- This page
- CoChat. (2026). Citation check: Spectrum Analysis Enabled Periodic Feature Reconstruction Based Automatic Defect Detection System for Electroluminescence Images of Photovoltaic Modules. https://app.cochat.ai/papers/10.3390/mi13020332
- The paper
- Yu, J., Yang, Y., Zhang, H., Sun, H., Zhang, Z., Xia, Z., Zhu, J., Dai, M., & Wen, H. (2022). Spectrum Analysis Enabled Periodic Feature Reconstruction Based Automatic Defect Detection System for Electroluminescence Images of Photovoltaic Modules. Micromachines. https://doi.org/10.3390/mi13020332
Data sources
Bibliographic data: Semantic Scholar, OpenAlex, Crossref.
Contains information from the Semantic Scholar Academic Graph Datasets, made available under the ODC Attribution License (ODC-BY 1.0).
Semantic Scholar’s data is described in: Kinney, R., et al. (2023). The Semantic Scholar Open Data Platform. arXiv:2301.10140.
