

The DOI matches its Crossref record; 31 of the 31 references it cites were found in a registry or an index.
Drug Repurposing as an Antitumor Agent: Disulfiram-Mediated Carbonic Anhydrase 12 and Anion Exchanger 2 Modulation to Inhibit Cancer Cell Migration
Open accessAbstract
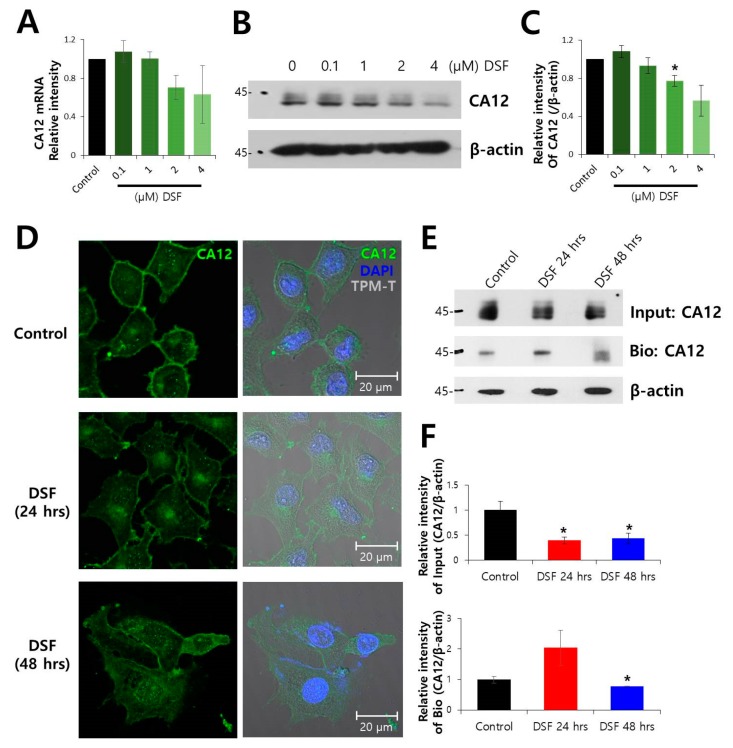
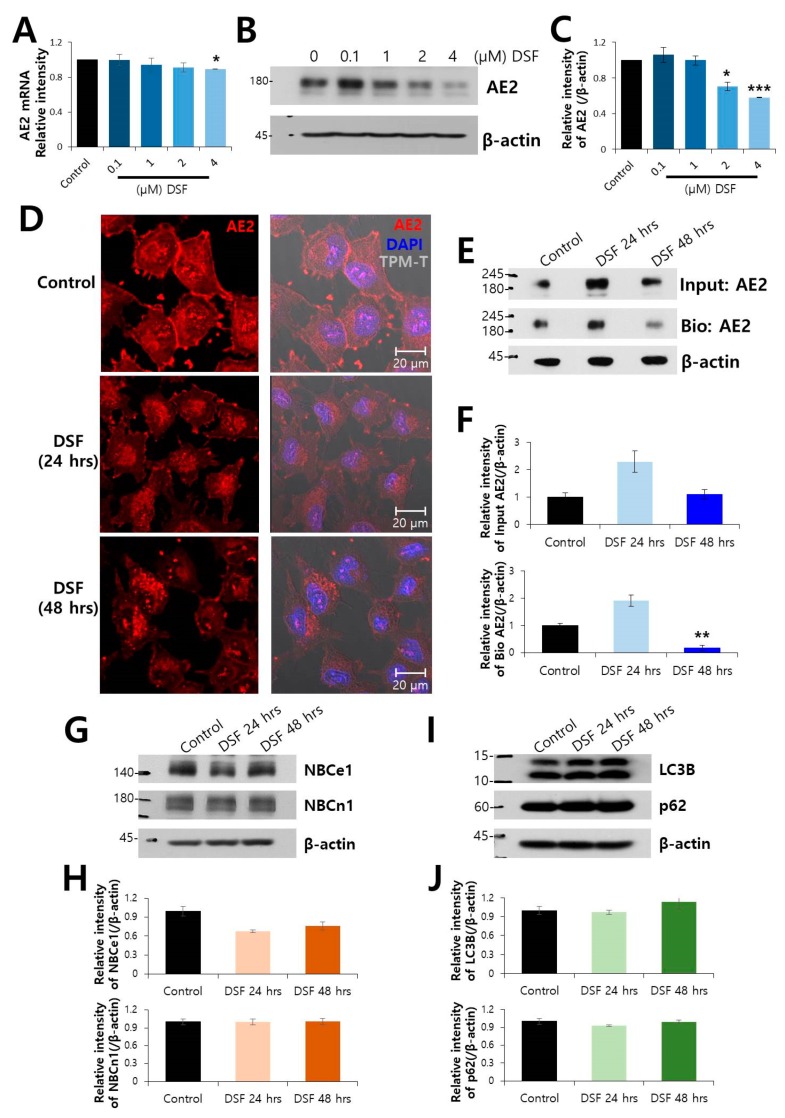
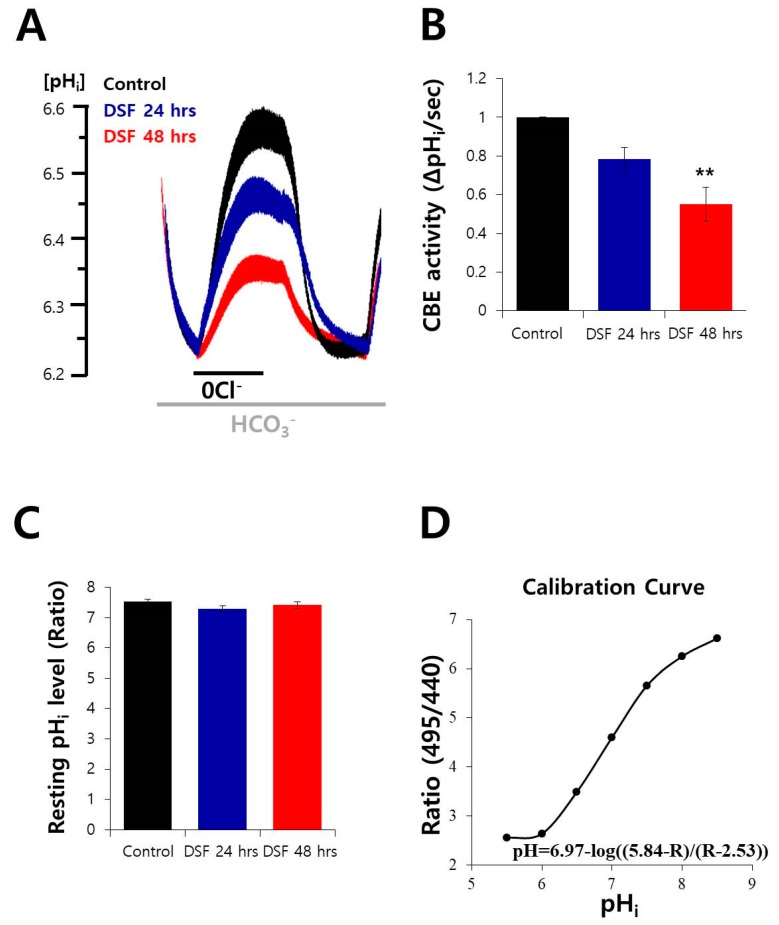
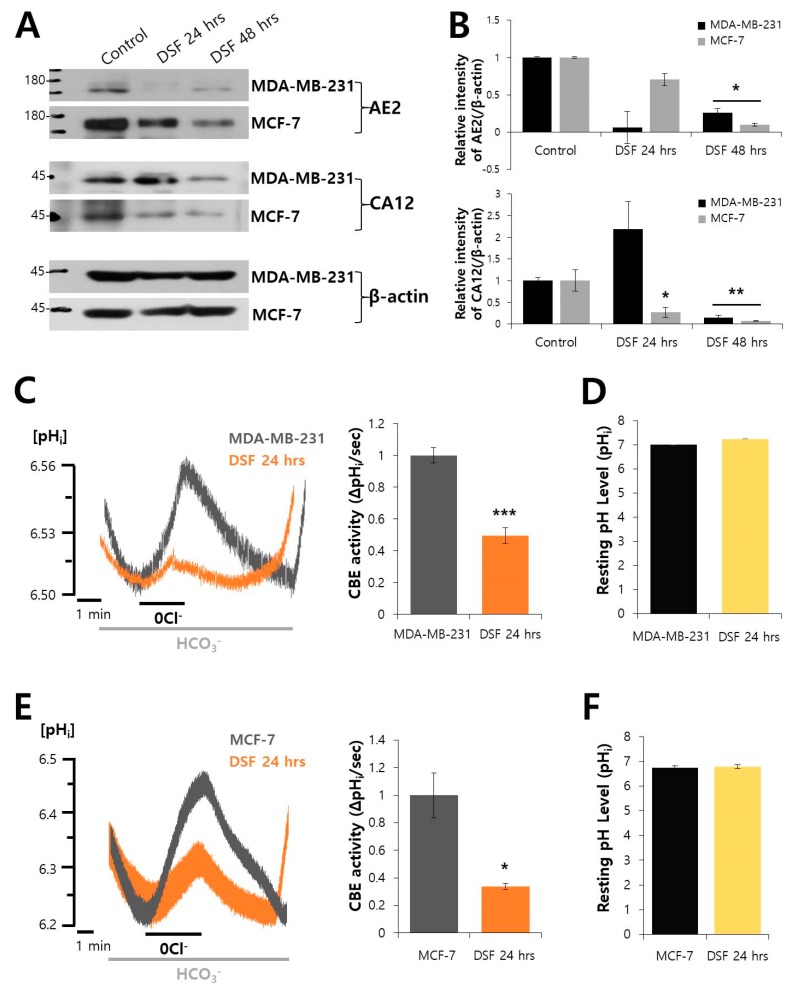
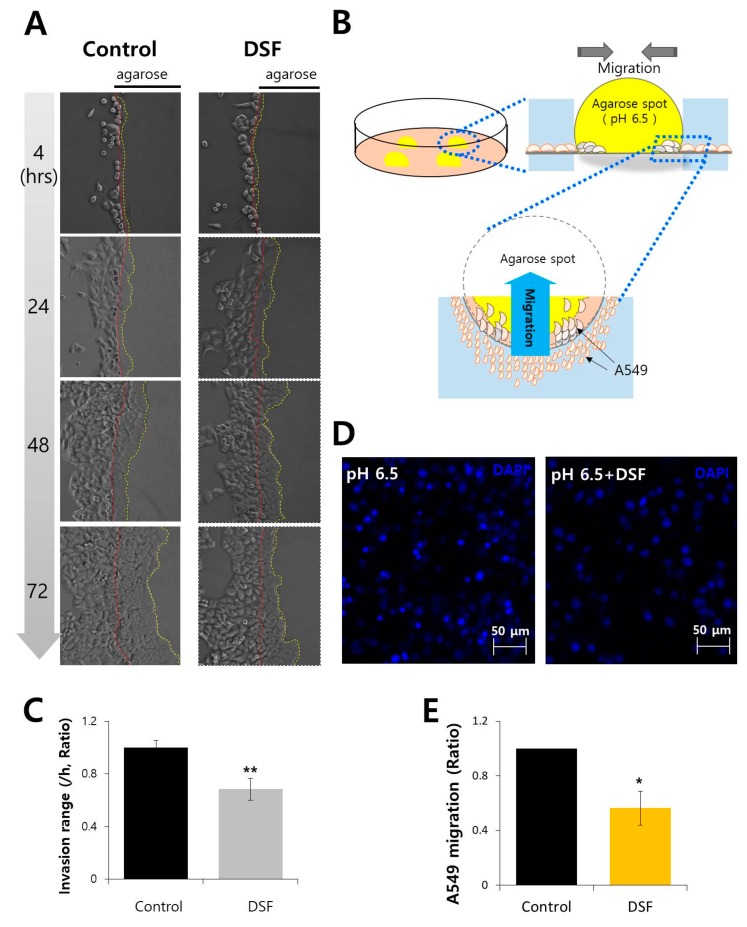
Disulfiram has been used in the treatment of alcoholism and exhibits an anti-tumor effect. However, the intracellular mechanism of anti-tumor activity of Disulfiram remains unclear. In this study, we focused on the modulatory role of Disulfiram via oncogenic factor carbonic anhydrase CA12 and its associated transporter anion exchanger AE2 in lung cancer cell line A549. The surface expression of CA12 and AE2 were decreased by Disulfiram treatment with a time-dependent manner. Disulfiram treatment did not alter the expression of Na+-bicarbonate cotransporters, nor did it affect autophagy regulation. The chloride bicarbonate exchanger activity of A549 cells was reduced by Disulfiram treatment in a time-dependent manner without change in the resting pH level. The expression and activity of AE2 and the expression of CA12 were also reduced by Disulfiram treatment in the breast cancer cell line. An invasion assay and cell migration assay revealed that Disulfiram attenuated the invasion and migration of A549 cells. In conclusion, the attenuation of AE2 and its supportive enzyme CA12, and the inhibitory effect on cell migration by Disulfiram treatment in cancer cells provided the molecular evidence supporting the potential of Disulfiram as an anticancer agent.
Overview
The claims and statistics of this paper haven’t been checked yet.
Run the check — free, no account needed. It reads the open-access text and checks the sources it cites.
Integrity signals
Registry
Cites
Statistics
Figures
Verification
Claims the paper makes
The claims and statistics of this paper haven’t been checked yet.
Run the check — free, no account needed. It reads the open-access text and checks the sources it cites.
Claims other papers make about this one
Each is checked against this paper’s own text: does it say what the citing paper says it does?
The cited source says what the claim attributes to it.
In the citing paper
“DIS modulates endogenous plasma membrane-associated carbonic anhydrases 12 (CA12) and its associated transporter anion exchanger 2 (AE2) expression while attenuating cancer cell migration and invasion through reduced AE2 activity and levels.86”
From Off-label and repurposed use of disulfiram beyond alcohol dependence: A systematic review of clinical and preclinical evidence (2026) · cites this paper as [86]
Self-check
Percentages, sums and reported differences re-computed from the paper’s own numbers.
The self-check needs the paper’s full text.
Citations
Cites
Carbonic anhydrase inhibitors as emerging agents for the treatment and imaging of hypoxic tumors
Supuran, C. T. (2018) · Expert Opinion on Investigational Drugs · doi:10.1080/13543784.2018.1548608 · Cited by 262
Švastová, E., Witarski, W., Csáderová, L., Košík, I., Škvarková, L., Hulı́ková, A., Zaťovičová, M., Baráthová, M., Kopáček, J., Pastorek, J., et al. (2011) · Journal of Biological Chemistry · doi:10.1074/jbc.m111.286062 · Cited by 190
Carbonic anhydrase XII functions in health and disease
Waheed, A., & Sly, W. S. (2017) · Gene · doi:10.1016/j.gene.2017.04.027 · Cited by 130
Carbonic anhydrase XII is a new therapeutic target to overcome chemoresistance in cancer cells
Kopecka, J., Campia, I., Jacobs, A., Frei, A. P., Ghigo, D., Wollscheid, B., & Riganti, C. (2015) · Oncotarget · doi:10.18632/oncotarget.2882 · Cited by 122
Parks, S. K., & Pouysségur, J. (2015) · Journal of Cellular Physiology · doi:10.1002/jcp.24930 · Cited by 110
Inhibition of Invasion and Angiogenesis by Zinc-Chelating Agent Disulfiram
Shian, S.-G., Kao, Y.-R., Wu, F. Y.-H., & Wu, C. (2003) · Molecular Pharmacology · doi:10.1124/mol.64.5.1076 · Cited by 106
Lauritzen, G., Stock, C.-M., Lemaire, J., Lund, S. F., Jensen, M. B. F., Damsgaard, B., Petersen, K. S., Wiwel, M., Rønnov‐Jessen, L., Schwab, A., et al. (2011) · Cancer Letters · doi:10.1016/j.canlet.2011.11.023 · Cited by 102
Expression of transmembrane carbonic anhydrases IX and XII in ovarian tumours
Hynninen, P., Vaskivuo, L., Saarnio, J., Haapasalo, H. K., Kivelä, J., Pastoreková, S., Pastorek, J., Waheed, A., Sly, W. S., Puistola, U., et al. (2006) · Histopathology · doi:10.1111/j.1365-2559.2006.02523.x · Cited by 101
An Agarose Spot Assay for Chemotactic Invasion
Wiggins, H. L., & Rappoport, J. Z. (2010) · BioTechniques · doi:10.2144/000113353 · Cited by 98
Cho, H.-J., Lee, T., Park, J.-B., Park, K., Choe, J., Sin, D.-I., Park, Y.-Y., Moon, Y. S., Lee, K.-G., Yeo, J., et al. (2007) · BMB Reports · doi:10.5483/bmbrep.2007.40.6.1069 · Cited by 97
Tumor metabolism, cancer cell transporters, and microenvironmental resistance
Alfarouk, K. O. (2016) · Journal of Enzyme Inhibition and Medicinal Chemistry · doi:10.3109/14756366.2016.1140753 · Cited by 88
Tafreshi, N. K., Lloyd, M. C., Proemsey, J. B., Bui, M. M., Kim, J., Gillies, R. J., & Morse, D. L. (2015) · Molecular Imaging and Biology · doi:10.1007/s11307-015-0885-x · Cited by 87
Ion channels and transporters in metastasis
Stock, C. M., & Schwab, A. (2014) · Biochimica et Biophysica Acta (BBA) - Biomembranes · doi:10.1016/j.bbamem.2014.11.012 · Cited by 80
Cell-surface marker discovery for lung cancer
Cohen, A. S., Khalil, F. K., Welsh, E. A., Schabath, M. B., Enkemann, S. A., Davis, A., Zhou, J.-M., Boulware, D. C., Kim, J., Haura, E. B., et al. (2017) · Oncotarget · doi:10.18632/oncotarget.23009 · Cited by 66
Aldehyde dehydrogenase inhibition blocks mucosal fibrosis in human and mouse ocular scarring
Ahadome, S. D., Abraham, D., Rayapureddi, S., Saw, V. P. J., Saban, D. R., Calder, V. L., Norman, J. T., Ponticos, M., Daniels, J. T., & Dart, J. K. G. (2016) · JCI Insight · doi:10.1172/jci.insight.87001 · Cited by 51
Hong, J. H., Muhammad, E., Zheng, C., Hershkovitz, E., Alkrinawi, S., Loewenthal, N., Parvari, R., & Muallem, S. (2015) · The Journal of Physiology · doi:10.1113/jp271378 · Cited by 49
Self-citationSasaki, M., Sato, Y., & Nakanuma, Y. (2018) · Laboratory Investigation · doi:10.1038/s41374-018-0045-4 · Cited by 47
High expression of carbonic anhydrase 12 (CA12) is associated with good prognosis in breast cancer
Li, Y.-M., Lei, B., Zou, J., Wang, W., Chen, A., Zhang, J., Fu, Y., & Li, Z. (2019) · Neoplasma · doi:10.4149/neo_2018_180819n624 · Cited by 45
Gastrin inhibits a novel, pathological colon cancer signaling pathway involving EGR1, AE2, and P-ERK
Song, L., Liu, R., Zeng, Z. R., Alper, S. L., Cui, H., Yang, L., Zheng, L., Yan, Z.-W., & Fu, G. (2012) · Journal of Molecular Medicine · doi:10.1007/s00109-011-0851-2 · Cited by 37
Reduction of anion exchanger 2 expression induces apoptosis of human hepatocellular carcinoma cells
Hwang, J.-M., Kao, S., Hsieh, Y., Li, K.-L., Wang, P.-H., Hsu, L.-S., & Liu, J.-Y. (2009) · Molecular and Cellular Biochemistry · doi:10.1007/s11010-009-0051-3 · Cited by 33
Yang, Y., Zhang, K., Wang, Y., Li, M., Sun, X., Liang, Z., Wang, L., Chen, L., Yang, H., & Zhu, L. (2016) · Scanning · doi:10.1002/sca.21332 · Cited by 27
Expression of anion exchanger 2 in human gastric cancer.
Yang, Y., Wu, P.-L., Wu, J., Shen, W.-H., Wu, Y., Fu, A., Zheng, L., Jin, X. L., & Fu, G. H. (2008) · PubMed · Cited by 25
Overexpression of anion exchanger 2 in human hepatocellular carcinoma.
Wu, T.-T., Hsieh, Y., Wu, C., Tsai, J.-H., Hsieh, Y., Huang, C., & Liu, J. Y. (2006) · PubMed · Cited by 23
Zhang, L.-J., Lu, R., Song, Y.-N., Zhu, J., Xia, W., Zhang, M., Shao, Z.-Y., Huang, Y., Zhou, Y., Zhang, H., et al. (2017) · Scientific Reports · doi:10.1038/s41598-017-06472-w · Cited by 22
Shiozaki, A., Hikami, S., Ichikawa, D., Kosuga, T., Shimizu, H., Kudou, M., Yamazato, Y., Kobayashi, T., Shoda, K., Arita, T., et al. (2018) · Oncotarget · doi:10.18632/oncotarget.25417 · Cited by 22
Intracellular pH Measurements In Vivo Using Green Fluorescent Protein Variants
Nehrke, K. W. (2006) · Humana Press eBooks · doi:10.1385/1-59745-151-7:223 · Cited by 18
Carbonic anhydrase 12 mutation modulates membrane stability and volume regulation of aquaporin 5
Hwang, S., Kang, J. Y., Kim, M.-J., Shin, D. M., & Hong, J. H. (2018) · Journal of Enzyme Inhibition and Medicinal Chemistry · doi:10.1080/14756366.2018.1540475 · Cited by 15
Self-citationGoverning effect of regulatory proteins for Cl−/HCO3− exchanger 2 activity
Jeong, Y. S., & Hong, J. H. (2015) · Channels · doi:10.1080/19336950.2015.1134068 · Cited by 14
Self-citationRochon, P., Jourdain, M., Mangalaboyi, J., Fourrier, F., Bégu, S., Buys, B., Dehlin, G., Lesage, J. C., Chambrin, M. C., & Mordon, S. R. (2007) · Journal of Biomedical Optics · doi:10.1117/1.2821698 · Cited by 13
Celay, J., Lozano, T., Concepcion, A. R., Beltrán, E., Rudilla, F., Garcia-Barchino, M. J., Robles, E. F., Rabal, O., de Miguel, I., Panizo, C., et al. (2017) · Haematologica · doi:10.3324/haematol.2017.175687 · Cited by 12
Lee, D., Lee, S. A., Shin, D. M., & Hong, J. H. (2018) · Frontiers in Physiology · doi:10.3389/fphys.2018.00889 · Cited by 11
Self-citation
Cited by
Sorted by citations
Benkő, B.-M., De Brito Parreirinha, N. S., Sebe, I., & Zelkó, R. (2026) · iScience · doi:10.1016/j.isci.2026.115441 · Cited by 2
Metadata
- Authors
- Hwang, S., Shin, D. M., & Hong, J. H.
- Affiliations
- Gachon University (KR)
- Yonsei University (KR)
- Corresponding author
- Shin, Dong Min
- Hong, Jeong Hee
- Venue
- Molecules
- Publisher
- MDPI AG
- Published
- 2019-09-19
- Volume
- 24
- Issue
- 18
- Pages
- 3409
- ISSN
- 1420-3049 (ISSN-L)
- PMC
- PMC6767608
- OpenAlex
- W2973928408
- Cited by
- 20
- References
- 31
- Citations by year
- 2026: 1 · 2025: 1 · 2024: 3 · 2023: 3 · 2022: 4 · 2021: 3 · 2020: 5
- FWCI
- 0.99
- Type
- journal article
- Language
- en
- Open access
- gold
- dx.doi.org
- Licence
- Locations
- Molecules (publishedVersion, cc-by)
- PubMed Central (publishedVersion, cc-by)
- PubMed (publishedVersion)
- DOAJ (DOAJ: Directory of Open Access Journals) (submittedVersion, cc-by-sa)
- YUHSpace (Yonsei University Medical Library) (submittedVersion, cc-by-nc-nd)
- Funders
- the National Research Foundation of Korea (NRF) grant funded by the Korean government (MSIT) and the grant from the Gachon University Gil Medical Center project (NRF-2019R1F1A1046785 (JHH), NRF-2016R1A5A2008630 (DMS), FRD 2018-07 (JHH))
- Topics
- Life Sciences › Biochemistry, Genetics and Molecular Biology › Molecular Biology › Enzyme function and inhibition
- Life Sciences › Biochemistry, Genetics and Molecular Biology › Cancer Research › Cancer, Hypoxia, and Metabolism
- Life Sciences › Biochemistry, Genetics and Molecular Biology › Molecular Biology › Metabolism, Diabetes, and Cancer
- Keywords
- disulfiram, drug repurposing, AE2, tumor cell migration, tumor invasion, lung cancer, breast cancer, chloride/bicarbonate exchanger, anticancer activity, A549 cells
- MeSH terms
- Antineoplastic Agents, Carbonic Anhydrases, Cell Membrane, Cell Movement, Disulfiram, Humans, Neoplasm Invasiveness, Neoplasms, Chloride-Bicarbonate Antiporters, Cell Line, Tumor, Drug Repositioning, Tumor Microenvironment
About these checks
Registry, retraction, Cites and statistics results are computed, not judged, with one exception: a printed reference that no index lists is read once by a model before it counts as a citation error. Claims are extracted by a model and kept only when their quote appears verbatim in the text; each cited source is then checked, with a model’s help, for whether it says what the claim relies on. Those verdicts can be wrong — read the claim’s quote and the cited source before relying on one.
Statistics and arithmetic are recomputed, not judged.
Confidence bands are shown only for fields calibrated on our annotated test set. None is calibrated yet, so no band is shown.
What counts as a claim ›How we measure confidence ›How we check this ›
Are you an author, or do you see a problem with this page? Request a review
