

The DOI matches its Crossref record; 84 of the 85 references it cites were found in a registry or an index.
A Critical View of the Application of the APEX Software (Aqueous Photochemistry of Environmentally-Occurring Xenobiotics) to Predict Photoreaction Kinetics in Surface Freshwaters
Open accessAbstract
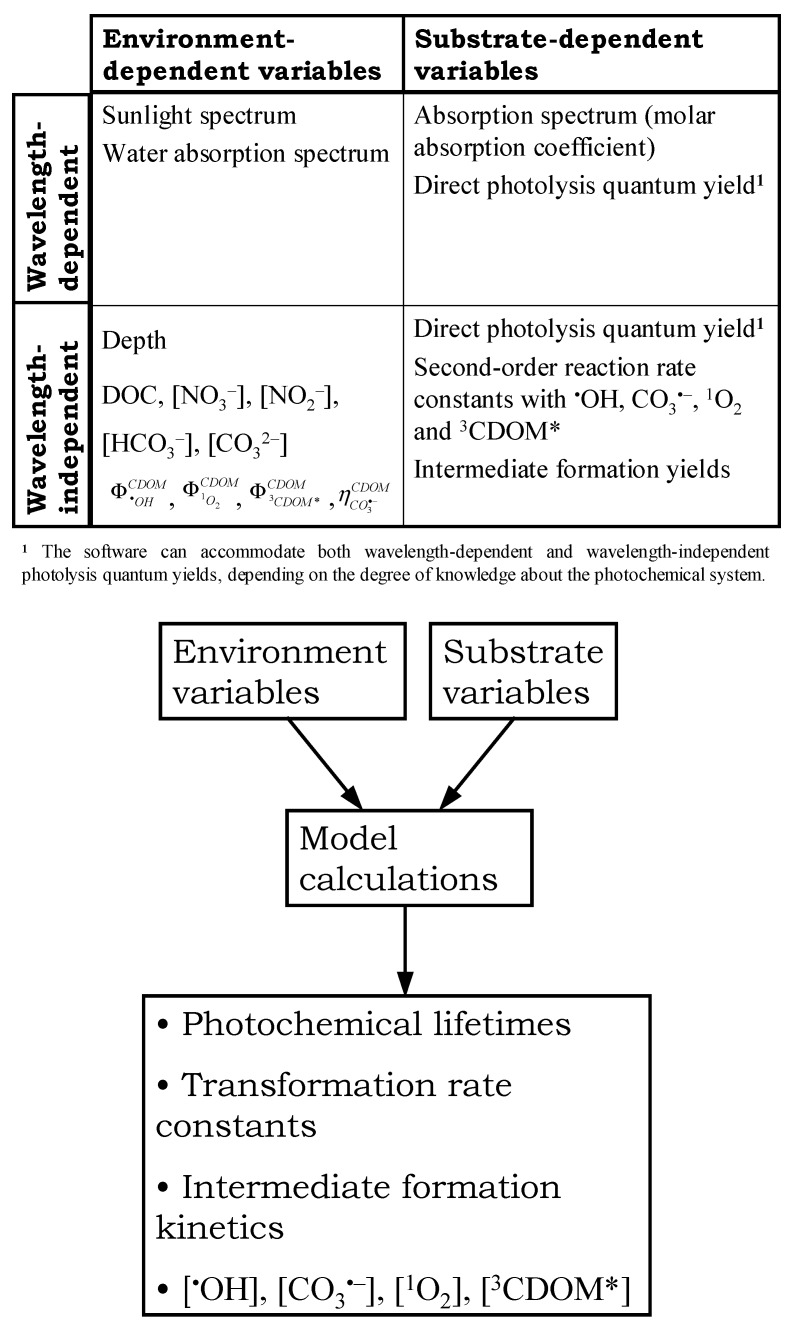
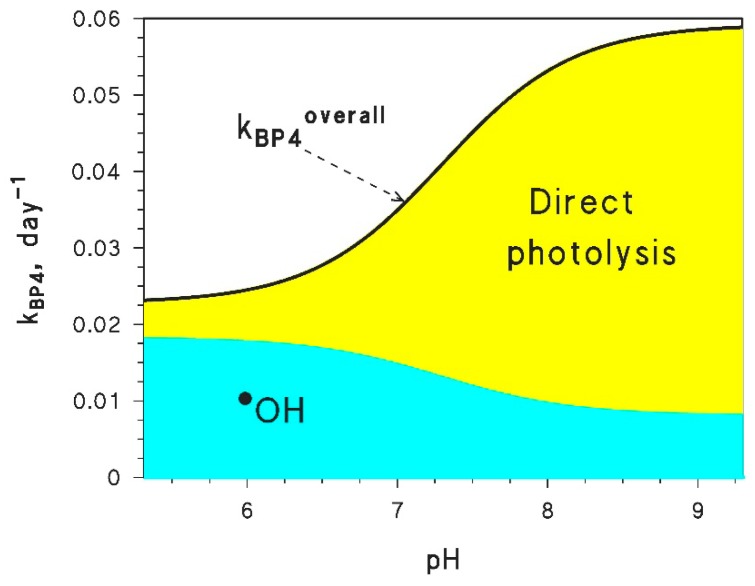
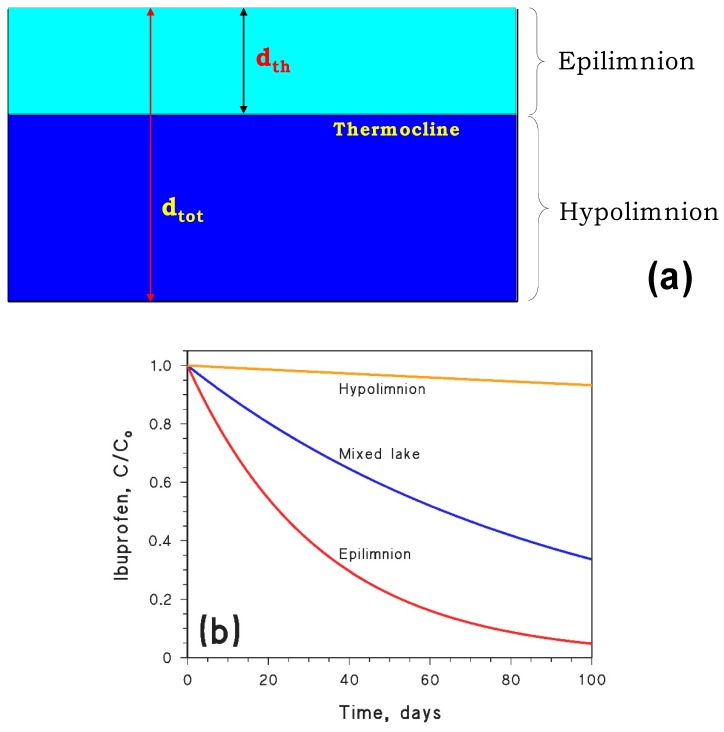
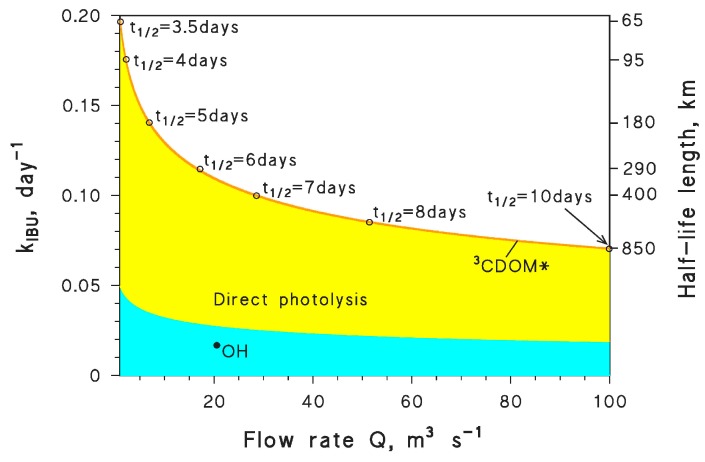
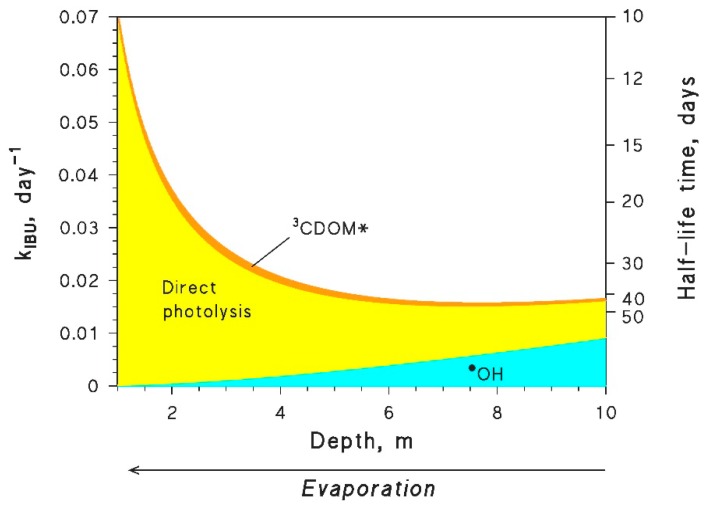
The APEX (aqueous photochemistry of environmentally occurring xenobiotics) software computes the phototransformation kinetics of compounds that occur in sunlit surface waters. It is free software based on Octave, and was originally released in 2014. Since then, APEX has proven to be a remarkably flexible platform, allowing for the addressing of several environmental problems. However, considering APEX as a stand-alone software is not conducive to exploiting its full potentialities. Rather, it is part of a whole ecosystem that encompasses both the software and the laboratory protocols that allow for the measurement of substrate photoreactivity parameters. Coherently with this viewpoint, the present paper shows both how to use APEX, and how to experimentally derive or approximately assess the needed input data. Attention is also given to some issues that might provide obstacles to users, including the extension of APEX beyond the simple systems for which it was initially conceived. In particular, we show how to use APEX to deal with compounds that undergo acid–base equilibria, and with the photochemistry of systems such as stratified lakes, lakes undergoing evaporation, and rivers. Hopefully, this work will provide a reference for the smooth use of one of the most powerful instruments for the modeling of photochemical processes in freshwater environments. All authors have read and agreed to the published version of the manuscript.
Overview
The claims and statistics of this paper haven’t been checked yet.
Run the check — free, no account needed. It reads the open-access text and checks the sources it cites.
Integrity signals
Registry
Cites
Statistics
Figures
Verification
Claims the paper makes
The claims and statistics of this paper haven’t been checked yet.
Run the check — free, no account needed. It reads the open-access text and checks the sources it cites.
Claims other papers make about this one
Each is checked against this paper’s own text: does it say what the citing paper says it does?
The source backs part of the claim, not all of it — or backs it for a different population, condition or comparison.
In the citing paper
“Ozone depletion would also increase the direct photolysis of pollutants that absorb UV-B radiation (e.g., diclofenac, ibuprofen, and naproxen) [238].”
From Environmental consequences of interacting effects of changes in stratospheric ozone, ultraviolet radiation, and climate: UNEP Environmental Effects Assessment Panel, Update 2024 (2025) · cites this paper as [238]
Experimental — accuracy not yet measuredThe check wasn’t confident either way, so it gives no verdict — never disputed.
In the citing paper
“In contrast, the same change in total column ozone would have little effect on 3CDOM* and 1O2 (+ 2–3%) generation [237] and, hence, on the degradation of contaminants, such as fenuron, isoproturon, amoxicillin, and chlorophenolates, plus phenols and anilines in organic-rich waters [238].”
From Environmental consequences of interacting effects of changes in stratospheric ozone, ultraviolet radiation, and climate: UNEP Environmental Effects Assessment Panel, Update 2024 (2025) · cites this paper as [238]
Experimental — accuracy not yet measured
Self-check
Percentages, sums and reported differences re-computed from the paper’s own numbers.
The self-check needs the paper’s full text.
Citations
Cites
Buxton, G. V., Greenstock, C. L., Helman, W. P., & Ross, A. B. (1988) · Journal of Physical and Chemical Reference Data · doi:10.1063/1.555805 · Cited by 12,332
Rate Constants for Reactions of Inorganic Radicals in Aqueous Solution
Neta, P., Huie, R. E., & Ross, A. B. (1988) · Journal of Physical and Chemical Reference Data · doi:10.1063/1.555808 · Cited by 3,651
Water Analysis: Emerging Contaminants and Current Issues
Richardson, S. D., & Ternes, T. A. (2014) · Analytical Chemistry · doi:10.1021/ac500508t · Cited by 2,144
Environmental Implications of Hydroxyl Radicals ( • OH)
Gligorovski, S., Strekowski, R., Barbati, S., & Vione, D. V. (2015) · Chemical Reviews · doi:10.1021/cr500310b · Cited by 1,679
Self-citationWilkinson, F., Helman, W. P., & Ross, A. B. (1995) · Journal of Physical and Chemical Reference Data · doi:10.1063/1.555965 · Cited by 1,481
Glossary of terms used in photochemistry, 3rd edition (IUPAC Recommendations 2006)
Braslavsky, S. E. (2007) · Pure and Applied Chemistry · doi:10.1351/pac200779030293 · Cited by 1,262
Evaluating Pesticide Degradation in the Environment: Blind Spots and Emerging Opportunities
Fenner, K., Canonica, S., Wackett, L. P., & Elsner, M. (2013) · Science · doi:10.1126/science.1236281 · Cited by 1,169
Chemical actinometry (IUPAC Technical Report)
Kuhn, H.-R., Braslavsky, S. E., & Schmidt, R. (2004) · Pure and Applied Chemistry · doi:10.1351/pac200476122105 · Cited by 878
McNeill, K., & Canonica, S. (2016) · Environmental Science Processes & Impacts · doi:10.1039/c6em00408c · Cited by 665
Wols, B. A., & Hofman-Caris, C. H. M. (2012) · Water Research · doi:10.1016/j.watres.2012.03.036 · Cited by 624
Rates of direct photolysis in aquatic environment
Zepp, R. G., & Cline, D. M. (1977) · Environmental Science & Technology · doi:10.1021/es60127a013 · Cited by 588
Solomon, C. T., Jones, S. E., Weidel, B. C., Buffam, I., Fork, M. L., Karlsson, J., Larsen, S. E., Lennon, J. T., Read, J. S., Sadro, S., et al. (2015) · Ecosystems · doi:10.1007/s10021-015-9848-y · Cited by 521
Wenk, J., von Gunten, U., & Canonica, S. (2011) · Environmental Science & Technology · doi:10.1021/es102212t · Cited by 518
Canonica, S., Kohn, T., Mac, M., Real, F. J., Wirz, J., & von Gunten, U. (2005) · Environmental Science & Technology · doi:10.1021/es051236b · Cited by 491
Vione, D. V., Minella, M., Maurino, V., & Minero, C. (2014) · Chemistry - A European Journal · doi:10.1002/chem.201400413 · Cited by 473
Self-citationIdentification of the pharmaceuticals for human use contaminating the Italian aquatic environment
Zuccato, E., Castiglioni, S., & Fanelli, R. (2005) · Journal of Hazardous Materials · doi:10.1016/j.jhazmat.2005.03.001 · Cited by 423
Rodgers, M. A. J., & Snowden, P. T. (1982) · Journal of the American Chemical Society · doi:10.1021/ja00384a070 · Cited by 410
Solar ultraviolet radiation in a changing climate
Williamson, C. E., Zepp, R. G., Lucas, R. M., Madronich, S., Austin, A. T., Ballaré, C. L., Norval, M., Sulzberger, B., Bais, A. F., McKenzie, R., et al. (2014) · Nature Climate Change · doi:10.1038/nclimate2225 · Cited by 385
Probe Compounds to Assess the Photochemical Activity of Dissolved Organic Matter
Rosario‐Ortiz, F. L., & Canonica, S. (2016) · Environmental Science & Technology · doi:10.1021/acs.est.6b02776 · Cited by 336
Appiani, E., Ossola, R., Latch, D. E., Erickson, P. R., & McNeill, K. (2017) · Environmental Science Processes & Impacts · doi:10.1039/c6em00646a · Cited by 319
Nelson, K. L., Boehm, A. B. B., Davies‐Colley, R. J., Dodd, M. C., Kohn, T., Linden, K. G., Liu, Y., Maraccini, P. A., McNeill, K., Mitch, W. A., et al. (2018) · Environmental Science Processes & Impacts · doi:10.1039/c8em00047f · Cited by 311
Ervens, B., Gligorovski, S., & Herrmann, H. (2003) · Physical Chemistry Chemical Physics · doi:10.1039/b300072a · Cited by 275
Inhibitory effect of dissolved organic matter on triplet-induced oxidation of aquatic contaminants
Canonica, S., & Laubscher, H. (2008) · Photochemical & Photobiological Sciences · doi:10.1039/b719982a · Cited by 247
Wenk, J., & Canonica, S. (2012) · Environmental Science & Technology · doi:10.1021/es300485u · Cited by 234
Page, S. E., Arnold, W. A., & McNeill, K. (2011) · Environmental Science & Technology · doi:10.1021/es2000694 · Cited by 228
Ge, L., Zhang, P., Halsall, C. J., Li, Y., Chen, C.-E., Li, J., Sun, H., & Yao, Z. (2018) · Water Research · doi:10.1016/j.watres.2018.11.009 · Cited by 205
Electron-Rich Phenols for Probing the Photochemical Reactivity of Freshwaters
Canonica, S., & Freiburghaus, M. (2001) · Environmental Science & Technology · doi:10.1021/es0011360 · Cited by 197
2-Nitrobenzaldehyde as a chemical actinometer for solution and ice photochemistry
Galbavý, Š., Ram, K., & Anastasio, C. (2009) · Journal of Photochemistry and Photobiology A Chemistry · doi:10.1016/j.jphotochem.2009.11.013 · Cited by 189
Vione, D. V., Khanra, S., Man, S. C., Maddigapu, P. R., Das, R., Arsene, C., Olariu, R. I., Maurino, V., & Minero, C. (2009) · Water Research · doi:10.1016/j.watres.2009.07.032 · Cited by 187
Self-citationA Chemical Equilibrium Model for Natural Waters
Millero, F. J., & Pierrot, D. (1998) · Aquatic Geochemistry · doi:10.1023/a:1009656023546 · Cited by 172
Photochemical Fate of Carbamazepine in Surface Freshwaters: Laboratory Measures and Modeling
Laurentiis, E. D., Chirón, S., Kouras-Hadef, S., Richard, C., Minella, M., Maurino, V., Minero, C., & Vione, D. V. (2012) · Environmental Science & Technology · doi:10.1021/es3015887 · Cited by 155
Self-citationStudies on photodegradation process of psychotropic drugs: a review
Trawiński, J., & Skibiński, R. (2016) · Environmental Science and Pollution Research · doi:10.1007/s11356-016-7727-5 · Cited by 143
Bodrato, M., & Vione, D. V. (2013) · Environmental Science Processes & Impacts · doi:10.1039/c3em00541k · Cited by 139
Self-citationLaurentiis, E. D., Prasse, C., Ternes, T. A., Minella, M., Maurino, V., Minero, C., Sarakha, M., Brigante, M., & Vione, D. V. (2014) · Water Research · doi:10.1016/j.watres.2014.01.016 · Cited by 137
Self-citationEnhancement of dye sonochemical degradation by some inorganic anions present in natural waters
Minero, C., Pellizzari, P., Maurino, V., Pelizzetti, E., & Vione, D. V. (2007) · Applied Catalysis B: Environmental · doi:10.1016/j.apcatb.2007.08.001 · Cited by 133
Self-citationPhotochemistry of Surface Fresh Waters in the Framework of Climate Change
Vione, D. V., & Scozzaro, A. (2019) · Environmental Science & Technology · doi:10.1021/acs.est.9b00968 · Cited by 133
Self-citationModelling the photochemical fate of ibuprofen in surface waters
Vione, D. V., Maddigapu, P. R., Laurentiis, E. D., Minella, M., Pazzi, M., Maurino, V., Minero, C., Kouras-Hadef, S., & Richard, C. (2011) · Water Research · doi:10.1016/j.watres.2011.10.014 · Cited by 123
Self-citationSinglet Oxygen Phosphorescence as a Probe for Triplet-State Dissolved Organic Matter Reactivity
Erickson, P. R., Moor, K. J., Werner, J. J., Latch, D. E., Arnold, W. A., & McNeill, K. (2018) · Environmental Science & Technology · doi:10.1021/acs.est.8b02379 · Cited by 123
Ruggeri, G., Ghigo, G., Maurino, V., Minero, C., & Vione, D. V. (2013) · Water Research · doi:10.1016/j.watres.2013.07.031 · Cited by 97
Self-citationMarchetti, G., Minella, M., Maurino, V., Minero, C., & Vione, D. V. (2013) · Water Research · doi:10.1016/j.watres.2013.07.038 · Cited by 96
Self-citationAvetta, P., Fabbri, D., Minella, M., Brigante, M., Maurino, V., Minero, C., Pazzi, M., & Vione, D. V. (2016) · Water Research · doi:10.1016/j.watres.2016.08.058 · Cited by 95
Self-citationMarchisio, A., Minella, M., Maurino, V., Minero, C., & Vione, D. V. (2015) · Water Research · doi:10.1016/j.watres.2015.01.016 · Cited by 94
Self-citationEstimating Evaporation from Lakes and Reservoirs under Limited Data Condition in a Semi-Arid Region
Majidi, M., Alizadeh, A., Faridhosseini, A., & Vazifedoust, M. (2015) · Water Resources Management · doi:10.1007/s11269-015-1025-8 · Cited by 91
Mattle, M. J., Vione, D. V., & Kohn, T. (2014) · Environmental Science & Technology · doi:10.1021/es504764u · Cited by 89
Self-citationNissenson, P. M., Dabdub, D., Das, R., Maurino, V., Minero, C., & Vione, D. V. (2010) · Atmospheric Environment · doi:10.1016/j.atmosenv.2010.08.035 · Cited by 88
Self-citationSchmitt, M., Erickson, P. R., & McNeill, K. (2017) · Environmental Science & Technology · doi:10.1021/acs.est.7b03402 · Cited by 79
Laurentiis, E. D., Minella, M., Sarakha, M., Marrese, A., Minero, C., Mailhot, G., Brigante, M., & Vione, D. V. (2013) · Water Research · doi:10.1016/j.watres.2013.07.017 · Cited by 75
Self-citationArnold, W. A., Oueis, Y., O’Connor, M., Rinaman, J. E., Taggart, M. G., McCarthy, R. E., Foster, K. A., & Latch, D. E. (2016) · Environmental Science Processes & Impacts · doi:10.1039/c6em00580b · Cited by 75
Maddigapu, P. R., Minella, M., Vione, D. V., Maurino, V., & Minero, C. (2010) · Environmental Science & Technology · doi:10.1021/es102458n · Cited by 72
Self-citationVione, D. V., Fabbri, D., Minella, M., & Canonica, S. (2017) · Water Research · doi:10.1016/j.watres.2017.10.020 · Cited by 71
Self-citationZhou, C., Chen, J., Xie, H., Zhang, Y., Li, Y., Wang, Y., Xie, Q. L., & Zhang, S. (2018) · Journal of Hazardous Materials · doi:10.1016/j.jhazmat.2018.01.051 · Cited by 70
Bianco, A., Fabbri, D., Minella, M., Brigante, M., Mailhot, G., Maurino, V., Minero, C., & Vione, D. V. (2014) · Water Research · doi:10.1016/j.watres.2014.07.036 · Cited by 66
Self-citationKohn, T., Mattle, M. J., Minella, M., & Vione, D. V. (2015) · Water Research · doi:10.1016/j.watres.2015.11.022 · Cited by 62
Self-citationLima, A. B., Faria, E. O., Montes, R. H. O., Cunha, R. R., Richter, E. M., Muñoz, R. A. A., & dos Santos, W. T. P. (2013) · Electroanalysis · doi:10.1002/elan.201300014 · Cited by 58
Phototransformation of anthraquinone-2-sulphonate in aqueous solution
Bedini, A., Laurentiis, E. D., Sur, B., Maurino, V., Minero, C., Brigante, M., Mailhot, G., & Vione, D. V. (2012) · Photochemical & Photobiological Sciences · doi:10.1039/c2pp25111f · Cited by 58
Self-citationA method of estimating in-stream residence time of water in rivers
Worrall, F., Howden, N. J. K., & Burt, T. (2014) · Journal of Hydrology · doi:10.1016/j.jhydrol.2014.02.050 · Cited by 56
Osorio, V., Proia, L., Ricart, M., Pérez, S., Ginebreda, A., Cortina, J. L., Sabater, S., & Barceló, . (2013) · The Science of The Total Environment · doi:10.1016/j.scitotenv.2013.11.069 · Cited by 50
On the effect of 2-propanol on phenol photonitration upon nitrate photolysis
Vione, D. V., Sur, B., Dutta, B. K., Maurino, V., & Minero, C. (2011) · Journal of Photochemistry and Photobiology A Chemistry · doi:10.1016/j.jphotochem.2011.09.008 · Cited by 50
Self-citationPhototransformation of the Herbicide Propanil in Paddy Field Water
Carena, L., Minella, M., Barsotti, F., Brigante, M., Milan, M., Ferrero, A., Berto, S., Minero, C., & Vione, D. V. (2017) · Environmental Science & Technology · doi:10.1021/acs.est.6b05053 · Cited by 49
Self-citationLastre-Acosta, A. M., Barberato, B., Parizi, M. P. S., & Teixeira, A. C. S. C. (2018) · Environmental Science and Pollution Research · doi:10.1007/s11356-018-2555-4 · Cited by 45
Carena, L., Puscasu, C. G., Comis, S., Sarakha, M., & Vione, D. V. (2019) · Chemosphere · doi:10.1016/j.chemosphere.2019.124476 · Cited by 45
Self-citationVione, D. V., Das, R., Rubertelli, F., Maurino, V., Minero, C., Barbati, S., & Chirón, S. (2010) · International Journal of Environmental & Analytical Chemistry · doi:10.1080/03067310902894218 · Cited by 43
Self-citationGe, L., Dong, Q., Halsall, C. J., Chen, C.-E., Li, J., Wang, D., Zhang, P., & Yao, Z. (2018) · Environmental Science and Pollution Research · doi:10.1007/s11356-018-1765-0 · Cited by 41
Chen, J., Peijnenburg, W. J. G. M., Quan, X., & Yang, F. (2000) · The Science of The Total Environment · doi:10.1016/s0048-9697(99)00407-6 · Cited by 39
Minella, M., Merlo, M. P., Maurino, V., Minero, C., & Vione, D. V. (2012) · Chemosphere · doi:10.1016/j.chemosphere.2012.07.013 · Cited by 37
Self-citationQuantitative structure–property relationships (QSPRs) on direct photolysis quantum yields of PCDDs
Chen, J., Quan, X., Peijnenburg, W. J. G. M., & Yang, F. (2001) · Chemosphere · doi:10.1016/s0045-6535(00)00141-7 · Cited by 37
Water loss through evaporation from water surfaces of lakes and reservoirs in Turkey
Gökbulak, F., & Özhan, S. (2006) · Cited by 36
Serna-Galvis, E. A., Troyon, J. A., Giannakis, S., Torres-Palma, R. A., Minero, C., Vione, D. V., & Pulgarin, C. O. (2018) · Water Research · doi:10.1016/j.watres.2018.10.011 · Cited by 35
Self-citationThe trophic evolution of Lake Iseo as related to its holomixis
Garibaldi, L., Mezzanotte, V., Brizzio, M. C., Rogora, M., & MOSELLO, R. (1999) · Journal of Limnology · doi:10.4081/jlimnol.1999.10 · Cited by 35
Minella, M., Rapa, L., Carena, L., Pazzi, M., Maurino, V., Minero, C., Brigante, M., & Vione, D. V. (2018) · Environmental Science Processes & Impacts · doi:10.1039/c8em00155c · Cited by 33
Self-citationTremblay, L., Caparros, J., Leblanc, K., & Obernosterer, I. (2015) · Biogeosciences · doi:10.5194/bg-12-607-2015 · Cited by 32
Calza, P., Noè, G., Fabbri, D., Santoro, V., Minero, C., Vione, D. V., & Medana, C. (2017) · Water Research · doi:10.1016/j.watres.2017.05.064 · Cited by 30
Self-citationLow to negligible photoactivity of lake-water matter in the size range from 0.1 to 5 μm
Minella, M., Romeo, F., Vione, D. V., Maurino, V., & Minero, C. (2011) · Chemosphere · doi:10.1016/j.chemosphere.2011.02.093 · Cited by 29
Self-citationPhotochemical Fate of Amicarbazone in Aqueous Media: Laboratory Measurement and Simulations
Parizi, M. P. S., Mostafa, S., McKay, G., Rosario‐Ortiz, F. L., & Teixeira, A. C. S. C. (2015) · Environmental Engineering Science · doi:10.1089/ees.2015.0127 · Cited by 28
Carena, L., Proto, M., Minella, M., Ghigo, G., Giovannoli, C., Brigante, M., Mailhot, G., Maurino, V., Minero, C., & Vione, D. V. (2018) · Environmental Science & Technology · doi:10.1021/acs.est.8b00710 · Cited by 28
Self-citationMinella, M., Giannakis, S., Mazzavillani, A., Maurino, V., Minero, C., & Vione, D. V. (2017) · Chemosphere · doi:10.1016/j.chemosphere.2017.07.128 · Cited by 27
Self-citationKoehler, B., Barsotti, F., Minella, M., Landelius, T., Minero, C., Tranvik, L. J., & Vione, D. V. (2017) · Water Research · doi:10.1016/j.watres.2017.10.064 · Cited by 24
Self-citationSur, B., Laurentiis, E. D., Minella, M., Maurino, V., Minero, C., & Vione, D. V. (2012) · The Science of The Total Environment · doi:10.1016/j.scitotenv.2012.03.034 · Cited by 23
Self-citationLong-term trends of chemical and modelled photochemical parameters in four Alpine lakes
Minella, M., Leoni, B., Salmaso, N., Savoye, L., Sommaruga, R., & Vione, D. V. (2015) · The Science of The Total Environment · doi:10.1016/j.scitotenv.2015.08.149 · Cited by 21
Self-citationEnvironmental photochemical fate and UVC degradation of sodium levothyroxine in aqueous medium
Parizi, M. P. S., Lastre-Acosta, A. M., Ishiki, H. M., Rossi, R. C., Mafra, R. C., & Teixeira, A. C. S. C. (2018) · Environmental Science and Pollution Research · doi:10.1007/s11356-018-2907-0 · Cited by 18
Laurentiis, E. D., Minella, M., Bodrato, M., Maurino, V., Minero, C., & Vione, D. V. (2013) · Aquatic Ecosystem Health & Management · doi:10.1080/14634988.2013.788433 · Cited by 17
Self-citationCarena, L., Terrenzio, D., Mosley, L. M., Toldo, M., Minella, M., & Vione, D. V. (2019) · Chemosphere · doi:10.1016/j.chemosphere.2019.124356 · Cited by 13
Self-citationBintou, A. T., Bianco, A., Mailhot, G., & Brigante, M. (2015) · Journal of Photochemistry and Photobiology A Chemistry · doi:10.1016/j.jphotochem.2015.06.030 · Cited by 10
THE TEMPERATURE COEFFICIENTS OF SOME PHOTOCHEMICAL REACTIONS
Kistiakowsky, G. B. (1929) · Proceedings of the National Academy of Sciences · doi:10.1073/pnas.15.3.194 · Cited by 4
Cited by
Sorted by citations
Guo, Z., Kodikara, D., Albi, L. S., Hatano, Y., Chen, G., Yoshimura, C., & Wang, J. (2022) · Water Research · doi:10.1016/j.watres.2022.118236 · Cited by 270
Guo, Z., Wang, J., Chen, X., Cui, F., Wang, T., Zhou, C., Song, G., Zhang, S., & Chen, J. (2020) · Water Research · doi:10.1016/j.watres.2020.116568 · Cited by 97
Photochemical behavior of dissolved organic matter in environmental surface waters: A review
Xu, Y., Zhang, Y., Qiu, L., Zhang, M., Yang, J., Ji, R., Vione, D. V., Chen, Z., & Gu, C. (2024) · Eco-Environment & Health · doi:10.1016/j.eehl.2024.06.002 · Cited by 79
Self-citationGarcía-Gil, Á., García‐Muñoz, R. A., McGuigan, K. G., & Marugán, J. (2021) · Molecules · doi:10.3390/molecules26113431 · Cited by 76
Biodegradation, photolysis, and sorption of antibiotics in aquatic environments: A scoping review
Bueno, I., He, H., Kinsley, A. C., Ziemann, S. J., Degn, L. R., Nault, A. J., Beaudoin, A. L., Singer, R. S., Wammer, K. H., & Arnold, W. A. (2023) · The Science of The Total Environment · doi:10.1016/j.scitotenv.2023.165301 · Cited by 72
Metadata
- Authors
- Vione, D.
- Affiliations
- University of Turin (IT)
- Corresponding author
- Vione, Davide
- ORCID
- Vione, Davide
- Venue
- Molecules
- Publisher
- MDPI AG
- Published
- 2019-12-18
- Volume
- 25
- Issue
- 1
- Pages
- 9
- ISSN
- 1420-3049 (ISSN-L)
- PMC
- PMC7017383
- OpenAlex
- W2994797139
- Cited by
- 66
- References
- 85
- Citations by year
- 2026: 2 · 2025: 6 · 2024: 11 · 2023: 11 · 2022: 9 · 2021: 17 · 2020: 10
- FWCI
- 0.87
- Type
- journal article
- Language
- en
- Open access
- gold
- dx.doi.org
- Licence
- Locations
- Molecules (publishedVersion, cc-by)
- Europe PMC (PubMed Central) (publishedVersion, cc-by)
- PubMed Central (publishedVersion, cc-by)
- PubMed (publishedVersion)
- Institutional Research Information System University of Turin (University of Turin) (submittedVersion, other-oa)
- Topics
- Physical Sciences › Environmental Science › Health, Toxicology and Mutagenesis › Toxic Organic Pollutants Impact
- Physical Sciences › Environmental Science › Water Science and Technology › Advanced oxidation water treatment
- Physical Sciences › Environmental Science › Pollution › Pesticide and Herbicide Environmental Studies
- Keywords
- aqueous photochemistry, xenobiotics, acid-base balance, stratified lakes, lake evaporation, rivers, photochemical modeling
- MeSH terms
- Cheminformatics, Algorithms, Fresh Water, Models, Chemical, Photolysis, Software, Sunlight, Xenobiotics, Photochemical Processes
About these checks
Registry, retraction, Cites and statistics results are computed, not judged, with one exception: a printed reference that no index lists is read once by a model before it counts as a citation error. Claims are extracted by a model and kept only when their quote appears verbatim in the text; each cited source is then checked, with a model’s help, for whether it says what the claim relies on. Those verdicts can be wrong — read the claim’s quote and the cited source before relying on one.
Statistics and arithmetic are recomputed, not judged.
Confidence bands are shown only for fields calibrated on our annotated test set. None is calibrated yet, so no band is shown.
What counts as a claim ›How we measure confidence ›How we check this ›
Are you an author, or do you see a problem with this page? Request a review
