

The DOI matches its Crossref record; 177 of the 178 references it cites were found in a registry or an index.
Computational Approaches in Theranostics: Mining and Predicting Cancer Data
Open accessAbstract
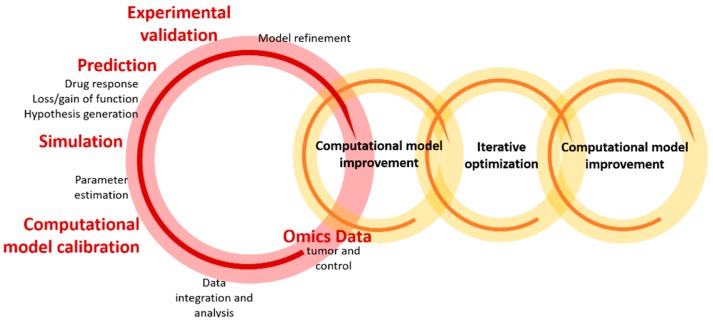
The ability to understand the complexity of cancer-related data has been prompted by the applications of (1) computer and data sciences, including data mining, predictive analytics, machine learning, and artificial intelligence, and (2) advances in imaging technology and probe development. Computational modelling and simulation are systematic and cost-effective tools able to identify important temporal/spatial patterns (and relationships), characterize distinct molecular features of cancer states, and address other relevant aspects, including tumor detection and heterogeneity, progression and metastasis, and drug resistance. These approaches have provided invaluable insights for improving the experimental design of therapeutic delivery systems and for increasing the translational value of the results obtained from early and preclinical studies. The big question is: Could cancer theranostics be determined and controlled in silico? This review describes the recent progress in the development of computational models and methods used to facilitate research on the molecular basis of cancer and on the respective diagnosis and optimized treatment, with particular emphasis on the design and optimization of theranostic systems. The current role of computational approaches is providing innovative, incremental, and complementary data-driven solutions for the prediction, simplification, and characterization of cancer and intrinsic mechanisms, and to promote new data-intensive, accurate diagnostics and therapeutics.
Overview
The claims and statistics of this paper haven’t been checked yet.
Free: it reads the open-access text and checks the first 5 claims that cite a source we can check. Create a free account to check every claim.
Integrity signals
Registry
Cites
Statistics
Figures





Verification
Claims the paper makes
The claims and statistics of this paper haven’t been checked yet.
Free: it reads the open-access text and checks the first 5 claims that cite a source we can check. Create a free account to check every claim.
Claims other papers make about this one
Each is checked against this paper’s own text: does it say what the citing paper says it does?
The source backs part of the claim, not all of it — or backs it for a different population, condition or comparison.
In the citing paper
“Therefore, on the other side of the argument, interactions in reactive non-neoplastic cells, genetically-altered tumor cells, and ECM control the majority of the stages of tumorigenesis effectively including clonal evolution, cancer heterogeneity, epithelial-mesenchymal-transition (EMT), migration, invasion, development of metastasis, neovascularization, apoptosis and chemotherapeutic drug resist”
From Tumor microenvironment complexity and therapeutic implications at a glance (2020) · cites this paper as [14]
Experimental — accuracy not yet measured
Self-check
Percentages, sums and reported differences re-computed from the paper’s own numbers.
The self-check needs the paper’s full text.
Citations
Cites
Radiomics: Images Are More than Pictures, They Are Data
Gillies, R. J., Kinahan, P. E., & Hricak, H. (2016) · Radiology · doi:10.1148/radiol.2015151169 · Cited by 8,421
Decoding tumour phenotype by noninvasive imaging using a quantitative radiomics approach
Aerts, H. J. W. L., Velazquez, E. R., Leijenaar, R. T. H., Parmar, C., Grossmann, P., Carvalho, S., Bussink, J., Monshouwer, R., Haibe-Kains, B., Rietveld, D., et al. (2014) · Nature Communications · doi:10.1038/ncomms5006 · Cited by 5,132
Systems biology: a brief overview
Kitano, H. (2002) · Science · doi:10.1126/science.1069492 · Cited by 4,265
Immunotherapy of Diffuse Gliomas: Biological Background, Current Status and Future Developments
Grauer, O. M., Wesseling, P., & Adema, G. J. (2009) · Brain Pathology · doi:10.1111/j.1750-3639.2009.00315.x · Cited by 4,007
Multi-omics approaches to disease
Hasin, Y., Seldin, M., & Lusis, A. (2017) · Genome Biology · doi:10.1186/s13059-017-1215-1 · Cited by 2,953
Metabolomic profiles delineate potential role for sarcosine in prostate cancer progression
Sreekumar, A., Poisson, L. M., Rajendiran, T. M., Khan, A. P., Cao, Q., Yu, J., Laxman, B., Mehra, R., Lonigro, R. J., Li, Y., et al. (2009) · Nature · doi:10.1038/nature07762 · Cited by 2,234
Tumor microenvironment complexity and therapeutic implications at a glance
Baghban, R., Roshangar, L., Jahanban-Esfahlan, R., Seidi, K., Ebrahimi-Kalan, A., Jaymand, M., Kolahian, S., Javaheri, T., & Zare, P. (2020) · Cell Communication and Signaling · doi:10.1186/s12964-020-0530-4 · Cited by 1,784
Applications of Support Vector Machine (SVM) Learning in Cancer Genomics
(2018) · Cancer Genomics & Proteomics · doi:10.21873/cgp.20063 · Cited by 1,528
Deep learning for computational biology
Angermueller, C., Pärnamaa, T., Parts, L., & Stegle, O. (2016) · Molecular Systems Biology · doi:10.15252/msb.20156651 · Cited by 1,473
Graham, M. V., Purdy, J. A., Emami, B., Harms, W., Bosch, W., Lockett, M. A., & Perez, C. A. (1999) · International Journal of Radiation Oncology*Biology*Physics · doi:10.1016/s0360-3016(99)00183-2 · Cited by 1,223
Research works printed but not linked: 3
- Morris, 2018, Big Data, Machine Learning, and Molecular Imaging, J. Nucl. Med., 59, 1159
- Chen, X., and Wong, S. (2014). Chapter 2—Genomics-Based Cancer Theranostics. Cancer Theranostics, Academic Press. · DOI
- Puri, M., Pathak, Y., Sutariya, V.K., Tipparaju, S., and Moreno, W. (2016). Chapter 14—ANN in Pharmaceutical Product and Process Development. Artificial Neural Network for Drug Design, Delivery and Disposition, Academic Press.
Cited by
Tumor microenvironment complexity and therapeutic implications at a glance
Baghban, R., Roshangar, L., Jahanban-Esfahlan, R., Seidi, K., Ebrahimi-Kalan, A., Jaymand, M., Kolahian, S., Javaheri, T., & Zare, P. (2020) · Cell Communication and Signaling · doi:10.1186/s12964-020-0530-4 · Cited by 1,784
“Therefore, on the other side of the argument, interactions in reactive non-neoplastic cells, genetically-altered tumor cells, and ECM control the majority of the stages of tumorigenesis effectively including clonal evolution, cancer heterogeneity, epithelial-mesenchymaltransition (EMT), migration, invasion, developmen…”
BackgroundArtificial intelligence aids in development of nanomedicines for cancer management
Tan, P., Chen, X., Zhang, H., Wei, Q., & Luo, K. (2023) · Seminars in Cancer Biology · doi:10.1016/j.semcancer.2023.01.005 · Cited by 246
Recent advances in theranostic polymeric nanoparticles for cancer treatment: A review
Indoria, S., Singh, V., & Hsieh, M.-F. (2020) · International Journal of Pharmaceutics · doi:10.1016/j.ijpharm.2020.119314 · Cited by 168
Novel therapeutic targets for cancer metastasis
Stoletov, K. V., Beatty, P. H., & Lewis, J. D. (2020) · Expert Review of Anticancer Therapy · doi:10.1080/14737140.2020.1718496 · Cited by 109
Artificial intelligence and big data facilitated targeted drug discovery
Liu, B., He, H., Luo, H., Zhang, T., & Jiang, J. (2019) · Stroke and Vascular Neurology · doi:10.1136/svn-2019-000290 · Cited by 86
Metadata
- Authors
- Cova, T. F. G. G., Bento, D. J., & Nunes, S. C. C.
- Affiliations
- University of Coimbra (PT)
- Corresponding author
- Cova, Tânia F. G. G.
- Nunes, Sandra C. C.
- Venue
- Pharmaceutics
- Publisher
- MDPI AG
- Published
- 2019-03-13
- Volume
- 11
- Issue
- 3
- Pages
- 119
- ISSN
- 1999-4923 (ISSN-L)
- PMC
- PMC6471740
- OpenAlex
- W2921183732
- Cited by
- 32
- References
- 178
- Citations by year
- 2026: 2 · 2025: 8 · 2024: 4 · 2023: 2 · 2022: 4 · 2021: 4 · 2020: 6 · 2019: 2
- FWCI
- 0.33
- Type
- journal article
- Language
- en
- Open access
- gold
- dx.doi.org
- Licence
- Locations
- Pharmaceutics (publishedVersion, cc-by)
- Europe PMC (PubMed Central) (publishedVersion, cc-by)
- PubMed Central (publishedVersion, cc-by)
- PubMed (publishedVersion)
- Portuguese National Funding Agency for Science, Research and Technology (RCAAP Project by FCT) (submittedVersion, cc-by)
- DOAJ (DOAJ: Directory of Open Access Journals) (submittedVersion, cc-by-sa)
- Funders
- Fundação para a Ciência e a Tecnologia (016648 POCI − 01 − 0145 − FEDER − 016648; COMPETE POCI − 01 − 0145 − FEDER − 007440; PEst − OE/QUI/UI0313/2014; POCI − 01 − 0145 − FEDER − 007630; SFRH/BD/95459/2013; SFRH/BPD/71683/2010)
- Topics
- Life Sciences › Pharmacology, Toxicology and Pharmaceutics › Drug Discovery › Computational Drug Discovery Methods
- Physical Sciences › Mathematics › Modeling and Simulation › Mathematical Biology Tumor Growth
- Physical Sciences › Engineering › Biomedical Engineering › Nanoplatforms for cancer theranostics
- Keywords
- cancer theranostics, computational modeling, data mining, predictive analytics, machine learning, artificial intelligence, cancer diagnosis, tumor heterogeneity, metastasis, drug resistance, molecular basis of cancer
About these checks
Registry, retraction, Cites and statistics results are computed, not judged, with one exception: a printed reference that no index lists is read once by a model before it counts as a citation error. Claims are extracted by a model and kept only when their quote appears verbatim in the text; each cited source is then checked, with a model’s help, for whether it says what the claim relies on. Those verdicts can be wrong — read the claim’s quote and the cited source before relying on one.
Statistics and arithmetic are recomputed, not judged.
Confidence bands are shown only for fields calibrated on our annotated test set. None is calibrated yet, so no band is shown.
What counts as a claim ›How we measure confidence ›How we check this ›
Are you an author, or do you see a problem with this page? Request a review
How to cite
Cite CoChat for the checks on this page, and the paper for its own findings.
- This page
- CoChat. (2026). Citation check: Computational Approaches in Theranostics: Mining and Predicting Cancer Data. https://app.cochat.ai/papers/10.3390/pharmaceutics11030119
- The paper
- Cova, T. F. G. G., Bento, D. J., & Nunes, S. C. C. (2019). Computational Approaches in Theranostics: Mining and Predicting Cancer Data. Pharmaceutics. https://doi.org/10.3390/pharmaceutics11030119
Data sources
Bibliographic data: Semantic Scholar, OpenAlex, Crossref.
Contains information from the Semantic Scholar Academic Graph Datasets, made available under the ODC Attribution License (ODC-BY 1.0).
Semantic Scholar’s data is described in: Kinney, R., et al. (2023). The Semantic Scholar Open Data Platform. arXiv:2301.10140.
