

The DOI matches its Crossref record; 1 of the 1 references it cites were found in a registry or an index.
8-Anilino-1-naphthalenesulfonate-Conjugated Carbon-Coated Ferrite Nanodots for Fluoromagnetic Imaging, Smart Drug Delivery, and Biomolecular Sensing
Abstract
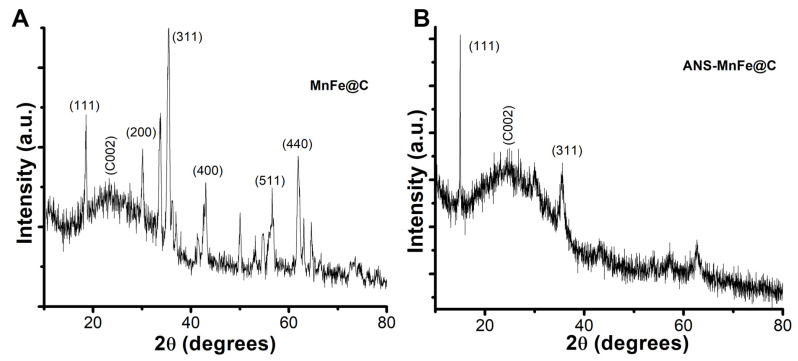
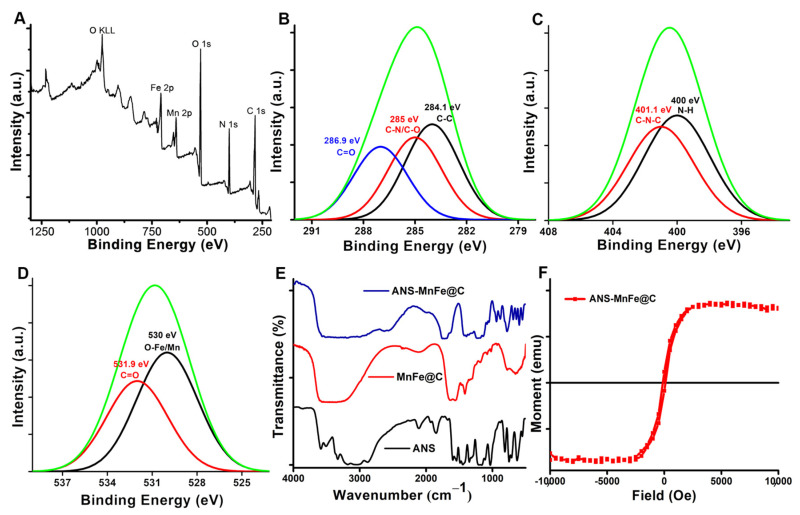
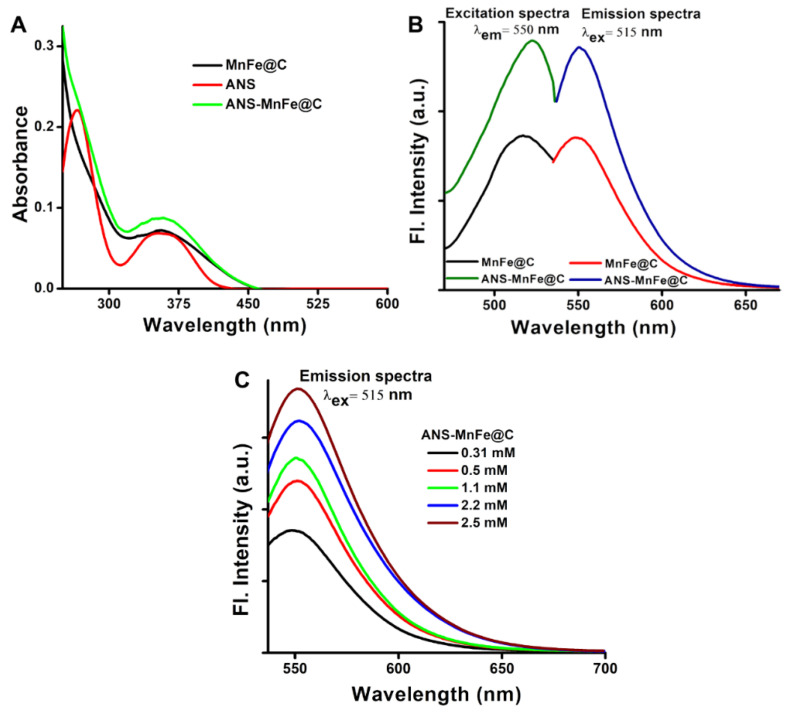
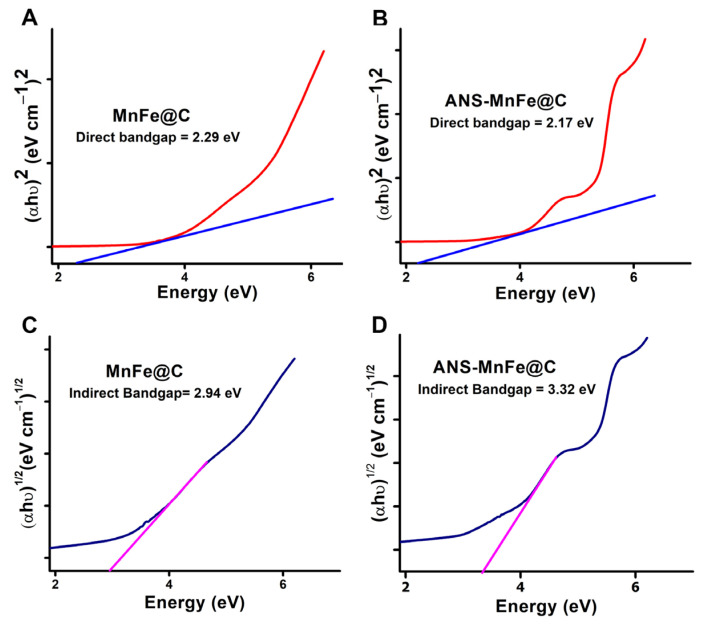
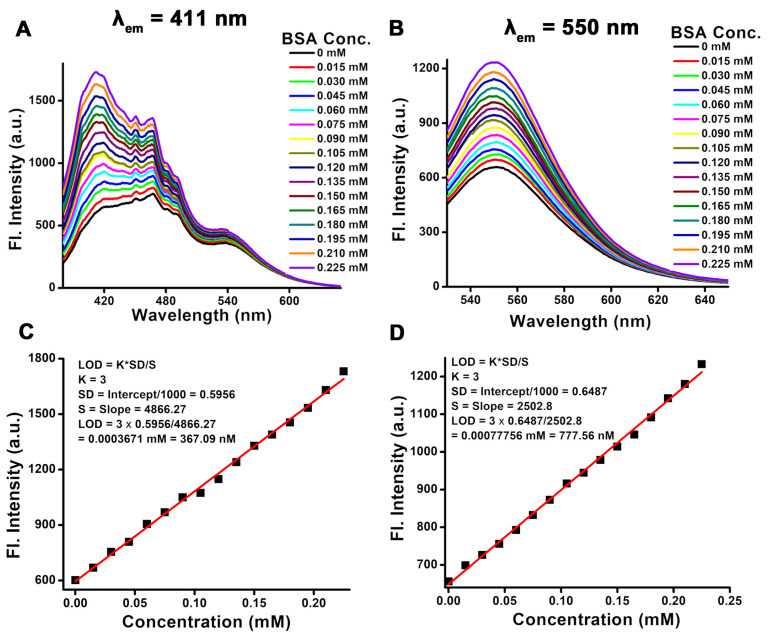
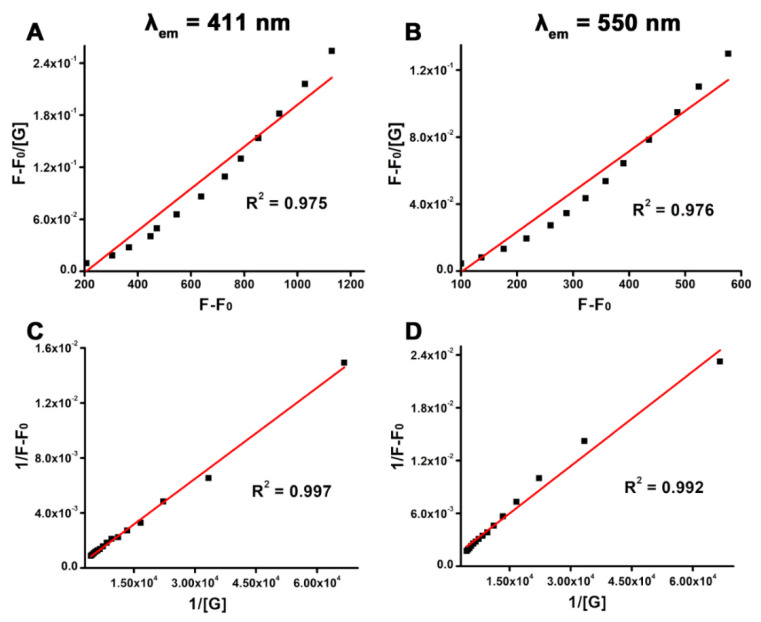
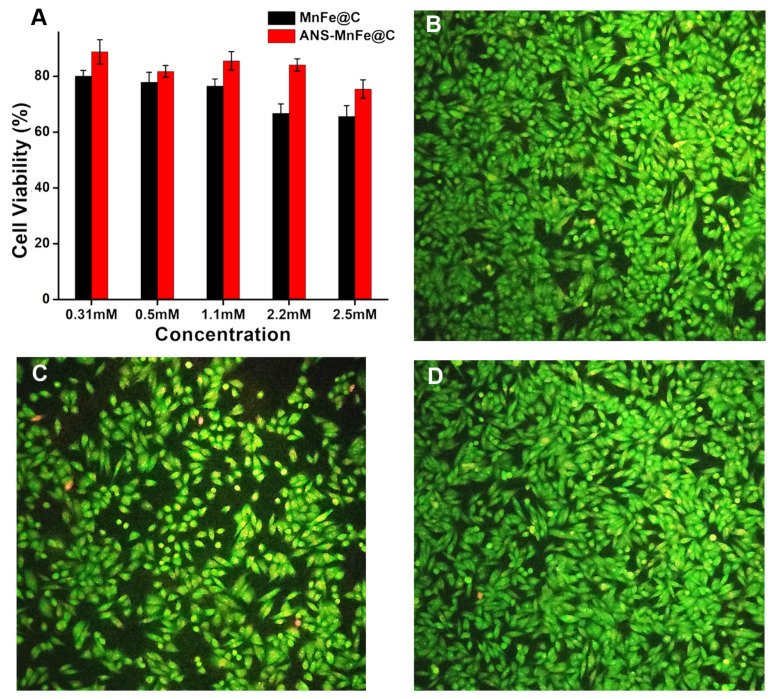
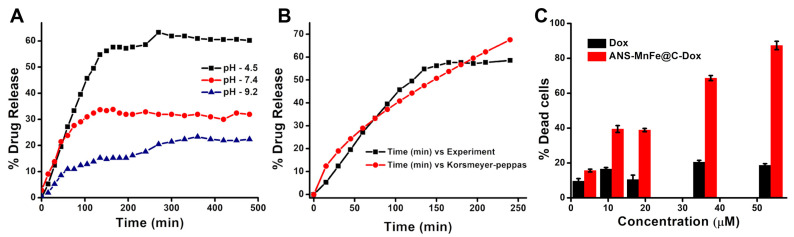
Background: Superparamagnetic properties and excitation independence have been incorporated into carbon-decorated manganese ferrite nanodots (MnFe@C) to introduce an economical and safer multimodal agent for use in both T1-T2 MRI and fluorescence-based imaging to replace the conventional highly toxic heavy metal contrast agents. Methods: The surface conjugation of 8-anilino-1-naphthalenesulfonate (ANS) to MnFe@C nanodots (ANS-MnFe@C) enhances both longitudinal and transverse MRI relaxation, improves fluorescence for optical imaging, and increases protein detection sensitivity, showing higher multimodal efficacy in terms of molar relaxivity, radiant efficiencies, and fluorescence sensitivity compared to MnFe@C. Results: The band gap energy was determined using Tauc’s equation to be 3.32 eV, while a 72% quantum yield demonstrated that ANS-MnFe@C was highly fluorescent, with the linear range and association constant calculated using the Stern–Volmer relation. The synthesized ANS-MnFe@C demonstrated excellent selectivity and sensitivity for bovine serum albumin (BSA), with a nanomolar detection limit of 367.09 nM and a broad linear range from 0.015 to 0.225 mM. Conclusions: In conclusion, ANS-MnFe@C holds ease of fabrication, good biocompatibility, as assessed in A375 cells, and an effective pH-sensitive doxorubicin release profile to establish anticancer activity in lung cancer cell line (A549), highlighting its potential as an affordable therapeutic agent for multimodal imaging, drug delivery, and protein sensing.
Overview
The claims and statistics of this paper haven’t been checked yet.
Run the check — free, no account needed. It reads the open-access text and checks the sources it cites.
Integrity signals
Registry
Cites
Statistics
Figures
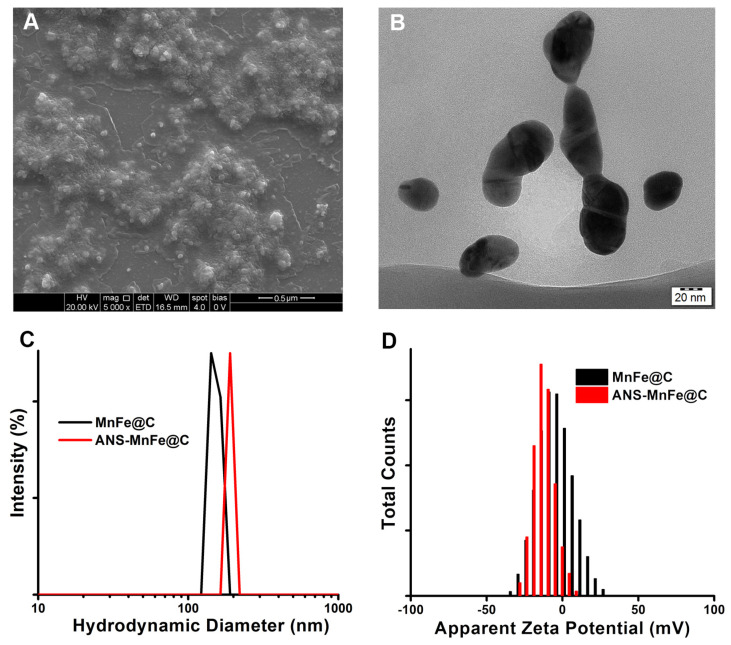
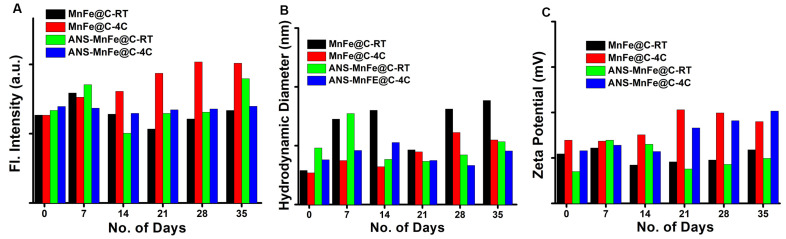
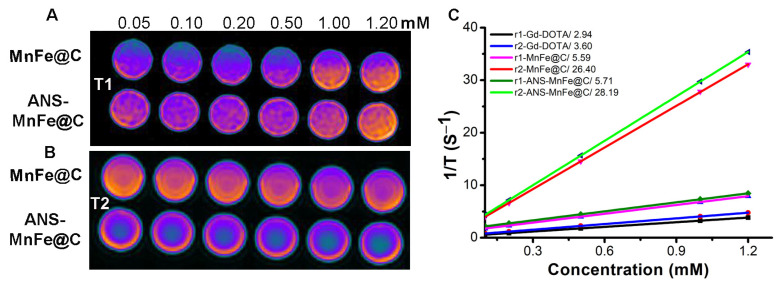
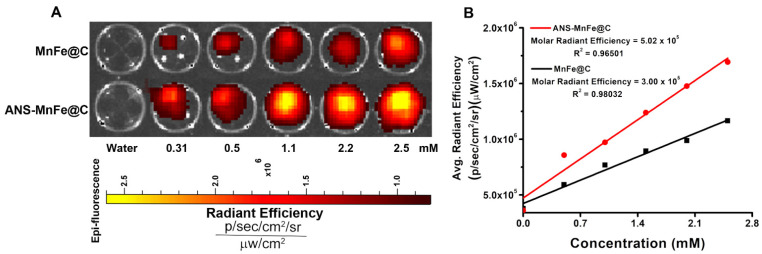
Verification
Claims the paper makes
The claims and statistics of this paper haven’t been checked yet.
Run the check — free, no account needed. It reads the open-access text and checks the sources it cites.
Claims other papers make about this one
Each is checked against this paper’s own text: does it say what the citing paper says it does?
The cited source says what the claim attributes to it.
In the citing paper
“The composition of MNP plays an important role in his compatibility [70].”
From Advances in green-synthesized magnetic nanoparticles for targeted cancer therapy: mechanisms, applications, and future perspectives (2026) · cites this paper as [70]
Self-check
Percentages, sums and reported differences re-computed from the paper’s own numbers.
The self-check needs the paper’s full text.
Citations
Cites
Georgakilas, V., Perman, J. A., Tucek, J., & Zboril, R. (2015) · Chemical Reviews · doi:10.1021/cr500304f · Cited by 2,147
Research works printed but not linked: 55
- Gowtham, 2022, Impact of nanovectors in multimodal medical imaging, Nanomed. J., 9, 107
- Dubey, R., Sinha, N., and Jagannathan, N.R. (2023). Potential of in vitro nuclear magnetic resonance of biofluids and tissues in clinical research. NMR Biomed., 36. · DOI
- Dwivedi, 2022, Emerging MR methods for improved diagnosis of prostate cancer by multiparametric MRI, Magn. Reson. Mater. Phys. Biol. Med., 35, 587, 10.1007/s10334-022-01031-5 · DOI
- Sharmiladevi, 2021, Nano-enabled theranostics for cancer, Mater. Adv., 2, 2876, 10.1039/D1MA00069A · DOI
- Padro, 2022, A Comprehensive Introduction to Magnetic Resonance Imaging Relaxometry and Contrast Agents, ACS Omega, 7, 36905, 10.1021/acsomega.2c03549 · DOI
- Haribabu, 2016, Optimized Mn-doped iron oxide nanoparticles entrapped in dendrimer for dual contrasting role in MRI, J. Biomed. Mater. Res. Part B Appl. Biomater., 104, 817, 10.1002/jbm.b.33550 · DOI
- Xiao, J., Tian, X.M., Yang, C., Liu, P., Luo, N.Q., Liang, Y., Li, H.B., Chen, D.H., Wang, C.X., and Li, L. (2013). Ultrahigh relaxivity and safe probes of manganese oxide nanoparticles for in vivo imaging. Sci. Rep., 3. · DOI
- Amsaveni, 2013, Engineered multifunctional nanoparticles for DLA cancer cells targeting, sorting, MR imaging and drug delivery, Adv. Sci. Eng. Med., 5, 1340, 10.1166/asem.2013.1425 · DOI
- Zhang, Y., Jia, Q., Nan, F., Wang, J., Liang, K., Li, J., Xue, X., Ren, H., Liu, W., and Ge, J. (2023). Carbon dots nanophotosensitizers with tunable reactive oxygen species generation for mitochondrion-targeted type I/II photodynamic therapy. Biomaterials, 293. · DOI
- Li, 2021, Highly Efficient Imaging-Guided Photothermal Therapy for Gliomas with MnFe2O4 Nanoparticle Clusters as a One-For-All Theranostic Agent, ACS Appl. Nano Mater., 4, 4238, 10.1021/acsanm.1c00744 · DOI
- Haribabu, 2021, Magneto-silver core–shell nanohybrids for theragnosis, Nano-Struct. Nano-Objects, 25, 100636, 10.1016/j.nanoso.2020.100636 · DOI
- Akhlaghi, 2021, Manganese ferrite (MnFe2O4) Nanoparticles: From synthesis to application—A review, J. Ind. Eng. Chem., 103, 292, 10.1016/j.jiec.2021.07.043 · DOI
- Poon, 2024, Manganese oxide nanoplatforms for disease diagnosis and treatment: Progress, challenges and opportunities, Coord. Chem. Rev., 500, 215548, 10.1016/j.ccr.2023.215548 · DOI
- Mourdikoudis, 2021, Magnetic Nanoparticle Composites: Synergistic Effects and Applications, Adv. Sci., 8, 2004951, 10.1002/advs.202004951 · DOI
- Zamay, G.S., Zamay, T.N., Lukyanenko, K.A., and Kichkailo, A.S. (2020). Aptamers Increase Biocompatibility and Reduce the Toxicity of Magnetic Nanoparticles Used in Biomedicine. Biomedicines, 8. · DOI
- Vedakumari, 2019, Enhancing anti-cancer activity of erlotinib by antibody conjugated nanofibrin—In vitro studies on lung adenocarcinoma cell lines, Mater. Chem. Phys., 224, 328, 10.1016/j.matchemphys.2018.11.061 · DOI
- Lee, 2021, Manganese–nitrogen and gadolinium–nitrogen Co-doped graphene quantum dots as bimodal magnetic resonance and fluorescence imaging nanoprobes, Nanotechnology, 32, 095103, 10.1088/1361-6528/abc642 · DOI
- Tiron, A., Stan, C.S., Luta, G., Uritu, C.M., Vacarean-Trandafir, I.-C., Stanciu, G.D., Coroaba, A., and Tiron, C.E. (2021). Manganese-Doped N-Hydroxyphthalimide-Derived Carbon Dots—Theranostics Applications in Experimental Breast Cancer Models. Pharmaceutics, 13. · DOI
- Cao, 2008, Novel silica-coated iron–carbon composite particles and their targeting effect as a drug carrier, J. Biomed. Mater. Res. Part A, 86A, 671, 10.1002/jbm.a.31647 · DOI
- Unnikrishnan, 2016, Carbon Dot-Mediated Synthesis of Manganese Oxide Decorated Graphene Nanosheets for Supercapacitor Application, ACS Sustain. Chem. Eng., 4, 3008, 10.1021/acssuschemeng.5b01700 · DOI
- Li, 2020, Manganese oxide doped carbon dots for temperature-responsive biosensing and target bioimaging, Anal. Chim. Acta, 1104, 125, 10.1016/j.aca.2020.01.001 · DOI
- Du, D., Fu, H.-J., Ren, W.-w., Li, X.-L., and Guo, L.-H. (2020). PSA targeted dual-modality manganese oxide–mesoporous silica nanoparticles for prostate cancer imaging. Biomed. Pharmacother., 121. · DOI
- Filippi, 2022, Engineered Magnetic Nanocomposites to Modulate Cellular Function, Small, 18, 2104079, 10.1002/smll.202104079 · DOI
- Venkatesan, 2016, Magnetic nanomaterials and sensors for biological detection, Nanomed. Nanotechnol. Biol. Med., 12, 2459, 10.1016/j.nano.2016.07.003 · DOI
- Nocito, G., Calabrese, G., Forte, S., Petralia, S., Puglisi, C., Campolo, M., Esposito, E., and Conoci, S. (2021). Carbon Dots as Promising Tools for Cancer Diagnosis and Therapy. Cancers, 13. · DOI
- Tian, 2020, Carbon Quantum Dots: In vitro and in vivo Studies on Biocompatibility and Biointeractions for Optical Imaging, Int. J. Nanomed., 15, 6519, 10.2147/IJN.S257645 · DOI
- Yi, 2023, Recent Progress and Perspective of an Evolving Carbon Family From 0D to 3D: Synthesis, Biomedical Applications, and Potential Challenges, ACS Appl. Bio Mater., 6, 2043, 10.1021/acsabm.3c00076 · DOI
- Cui, Y., Liu, L., Shi, M., Wang, Y., Meng, X., Chen, Y., Huang, Q., and Liu, C. (2024). A Review of Advances in Graphene Quantum Dots: From Preparation and Modification Methods to Application. C, 10. · DOI
- Shukla, 2020, Observation of critical magnetic behavior in 2D carbon based composites, Nanoscale Adv., 2, 962, 10.1039/C9NA00663J · DOI
- Ding, 2020, Surface states of carbon dots and their influences on luminescence, J. Appl. Phys., 127, 231101, 10.1063/1.5143819 · DOI
- Vithalani, 2020, Glowing photoluminescene in carbon-based nanodots: Current state and future perspectives, J. Mater. Sci., 55, 8769, 10.1007/s10853-020-04671-x · DOI
- Yamamoto, H., Fukui, N., Adachi, M., Saiki, E., Yamasaki, A., Matsumura, R., Kuroyanagi, D., Hongo, K., Mizobata, T., and Kawata, Y. (2020). Human Molecular Chaperone Hsp60 and Its Apical Domain Suppress Amyloid Fibril Formation of α-Synuclein. Int. J. Mol. Sci., 21. · DOI
- Deshpande, 2018, Interactions with 8-Anilinonaphthalene-1-sulfonic Acid (ANS) and Surface Hydrophobicity of Black Gram (Vigna mungo) Phaseolin, J. Food Sci., 83, 1847, 10.1111/1750-3841.14204 · DOI
- Ota, C., Tanaka, S.-i., and Takano, K. (2021). Revisiting the Rate-Limiting Step of the ANS–Protein Binding at the Protein Surface and Inside the Hydrophobic Cavity. Molecules, 26. · DOI
- Polak, J., Grąz, M., Wlizło, K., Szałapata, K., Kapral-Piotrowska, J., Paduch, R., and Jarosz-Wilkołazka, A. (2022). Bioactive Properties of a Novel Antibacterial Dye Obtained from Laccase-Mediated Oxidation of 8-Anilino-1-naphthalenesulfonic Acid. Molecules, 27. · DOI
- Sinkeldam, 2010, Fluorescent Analogs of Biomolecular Building Blocks: Design, Properties, and Applications, Chem. Rev., 110, 2579, 10.1021/cr900301e · DOI
- Zhao, 2017, Graphene-based nanomaterials for drug and/or gene delivery, bioimaging, and tissue engineering, Drug Discov. Today, 22, 1302, 10.1016/j.drudis.2017.04.002 · DOI
- Qin, 2021, Polarity-based fluorescence probes: Properties and applications, RSC Med. Chem., 12, 1826, 10.1039/D1MD00170A · DOI
- Du, 2015, Supramolecular Hydrogelators and Hydrogels: From Soft Matter to Molecular Biomaterials, Chem. Rev., 115, 13165, 10.1021/acs.chemrev.5b00299 · DOI
- Zhu, 2021, Sustainable synthesis of bright green fluorescent carbon quantum dots from lignin for highly sensitive detection of Fe3+ ions, Appl. Surf. Sci., 565, 150526, 10.1016/j.apsusc.2021.150526 · DOI
- Kiran, 2023, Rice husk assisted carbon quantum dots synthesis for amoxicillin sensing, Results Chem., 6, 101219, 10.1016/j.rechem.2023.101219 · DOI
- Harini, K., Alomar, S.Y., Vajagathali, M., Manoharadas, S., Thirumalai, A., Girigoswami, K., and Girigoswami, A. (2024). Niosomal Bupropion: Exploring Therapeutic Frontiers through Behavioral Profiling. Pharmaceuticals, 17. · DOI
- Unagolla, 2018, Drug transport mechanisms and in vitro release kinetics of vancomycin encapsulated chitosan-alginate polyelectrolyte microparticles as a controlled drug delivery system, Eur. J. Pharm. Sci., 114, 199, 10.1016/j.ejps.2017.12.012 · DOI
- Santadkha, 2022, Diffusion Modeling and In Vitro Release Kinetics Studies of Curcumin−Loaded Superparamagnetic Nanomicelles in Cancer Drug Delivery System, J. Pharm. Sci., 111, 1690, 10.1016/j.xphs.2021.11.015 · DOI
- Zanatta, A.R. (2019). Revisiting the optical bandgap of semiconductors and the proposal of a unified methodology to its determination. Sci. Rep., 9. · DOI
- Tauc, 1966, Optical Properties and Electronic Structure of Amorphous Germanium, Phys. Status Solidi (B), 15, 627, 10.1002/pssb.19660150224 · DOI
- Lakshmi, 2021, Accurate band gap determination of chemically synthesized cobalt ferrite nanoparticles using diffuse reflectance spectroscopy, Adv. Powder Technol., 32, 3706, 10.1016/j.apt.2021.08.028 · DOI
- Andrade, 2024, Band gap analysis in MOF materials: Distinguishing direct and indirect transitions using UV–vis spectroscopy, Appl. Mater. Today, 37, 102094, 10.1016/j.apmt.2024.102094 · DOI
- Abedi, 2018, Decoration of carbon dots and AgCl over g-C3N4 nanosheets: Novel photocatalysts with substantially improved activity under visible light, Sep. Purif. Technol., 199, 64, 10.1016/j.seppur.2018.01.023 · DOI
- Jaiganesh, 2012, Spectroscopically characterized cadmium sulfide quantum dots lengthening the lag phase of Escherichia coli growth, Spectrochim. Acta Part A Mol. Biomol. Spectrosc., 92, 29, 10.1016/j.saa.2012.02.044 · DOI
- Gowtham, P., Girigoswami, K., Pallavi, P., Harini, K., Gurubharath, I., and Girigoswami, A. (2022). Alginate-Derivative Encapsulated Carbon Coated Manganese-Ferrite Nanodots for Multimodal Medical Imaging. Pharmaceutics, 14. · DOI
- Gowtham, 2024, Hydrogels of Alginate Derivative-Encased Nanodots Featuring Carbon-Coated Manganese Ferrite Cores with Gold Shells to Offer Antiangiogenesis with Multimodal Imaging-Based Theranostics, Adv. Ther., 7, 2400054, 10.1002/adtp.202400054 · DOI
- Fegade, 2014, Urea Based Dipodal Fluorescence Receptor for Sensing of Fe3+ Ion in Semi-Aqueous Medium, J. Fluoresc., 24, 27, 10.1007/s10895-013-1297-4 · DOI
- Ali, 2024, Spectroscopic and Molecular Docking Studies of the Interaction of Non-steroidal Anti-inflammatory Drugs with a Carrier Protein: An Interesting Case of Inner Filter Effect and Intensity Enhancement in Protein Fluorescence, J. Fluoresc., 34, 1893, 10.1007/s10895-023-03422-w · DOI
- Fegade, 2014, A selective fluorescent receptor for the determination of nickel (II) in semi-aqueous media, J. Lumin., 146, 234, 10.1016/j.jlumin.2013.09.075 · DOI
Cited by
Sorted by citations
El-khawaga, A. M., Youssef, O. I., El-dydamoni, O. A., Ragab, W. M., & Mohammed, R. A. E. (2026) · European Journal of Medical Research · doi:10.1186/s40001-025-03804-9 · Cited by 14
Metadata
- Authors
- Thirumalai, A., Girigoswami, K., Prabhu, A. D., Durgadevi, P., Kiran, V., & Girigoswami, A.
- Venue
- Pharmaceutics
- Publisher
- MDPI AG
- Published
- 2024-10-26
- Volume
- 16
- Issue
- 11
- Pages
- 1378
- ISSN
- 1999-4923
- PMC
- PMC11597131
- Cited by
- 40
- References
- 1
- Language
- en
About these checks
Registry, retraction, Cites and statistics results are computed, not judged, with one exception: a printed reference that no index lists is read once by a model before it counts as a citation error. Claims are extracted by a model and kept only when their quote appears verbatim in the text; each cited source is then checked, with a model’s help, for whether it says what the claim relies on. Those verdicts can be wrong — read the claim’s quote and the cited source before relying on one.
Statistics and arithmetic are recomputed, not judged.
Confidence bands are shown only for fields calibrated on our annotated test set. None is calibrated yet, so no band is shown.
What counts as a claim ›How we measure confidence ›How we check this ›
Are you an author, or do you see a problem with this page? Request a review
