

The DOI matches its Crossref record; the references it cites are not checked yet.
Maize Yield Prediction at an Early Developmental Stage Using Multispectral Images and Genotype Data for Preliminary Hybrid Selection
Open accessAbstract
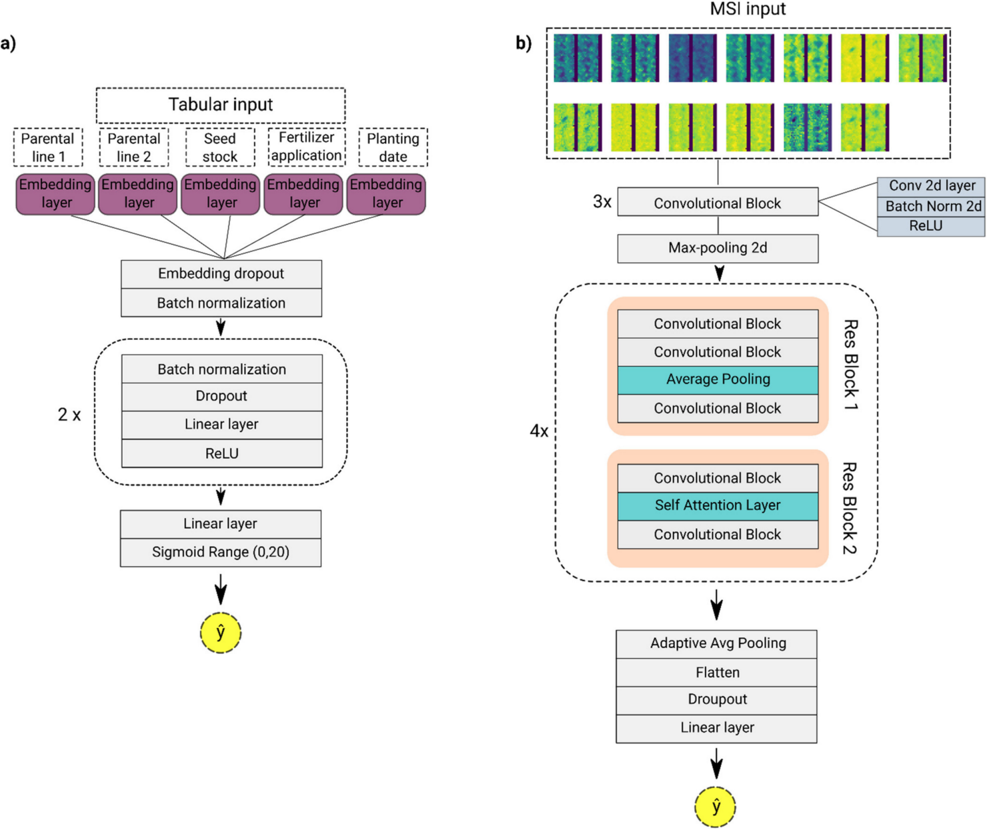
Assessing crop production in the field often requires breeders to wait until the end of the season to collect yield-related measurements, limiting the pace of the breeding cycle. Early prediction of crop performance can reduce this constraint by allowing breeders more time to focus on the highest-performing varieties. Here, we present a multimodal deep learning model for predicting the performance of maize (Zea mays) at an early developmental stage, offering the potential to accelerate crop breeding. We employed multispectral images and eight vegetation indices, collected by an uncrewed aerial vehicle approximately 60 days after sowing, over three consecutive growing cycles (2017, 2018 and 2019). The multimodal deep learning approach was used to integrate field management and genotype information with the multispectral data, providing context to the conditions that the plants experienced during the trial. Model performance was assessed using holdout data, in which the model accurately predicted the yield (RMSE 1.07 t/ha, a relative RMSE of 7.60% of 16 t/ha, and R2 score 0.73) and identified the majority of high-yielding varieties, outperforming previously published models for early yield prediction. The inclusion of vegetation indices was important for model performance, with a normalized difference vegetation index and green with normalized difference vegetation index contributing the most to model performance. The model provides a decision support tool, identifying promising lines early in the field trial.
Overview
The claims and statistics of this paper haven’t been checked yet.
Free: it reads the open-access text and checks the first 5 claims that cite a source we can check. Create a free account to check every claim.
Integrity signals
Registry
Cites
Statistics
Figures





Verification
Claims the paper makes
The claims and statistics of this paper haven’t been checked yet.
Free: it reads the open-access text and checks the first 5 claims that cite a source we can check. Create a free account to check every claim.
Claims other papers make about this one
Each is checked against this paper’s own text: does it say what the citing paper says it does?
The source backs part of the claim, not all of it — or backs it for a different population, condition or comparison.
In the citing paper
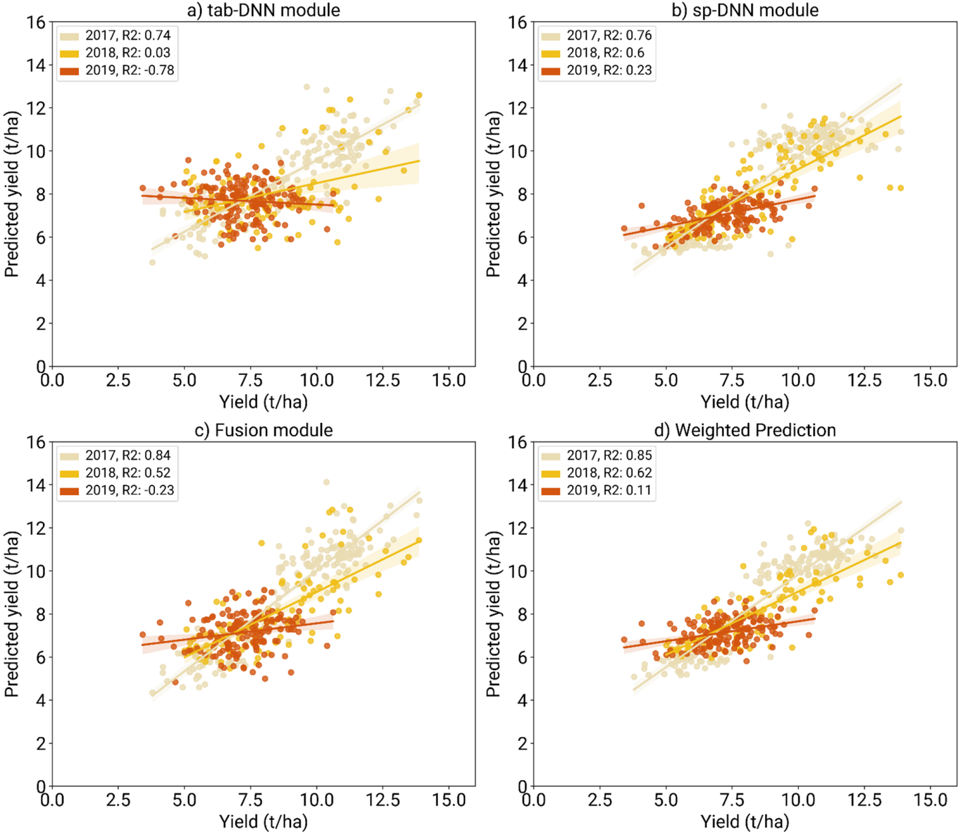
“In every case, the fusion of all modalities outperformed the separated approaches where the highest prediction performance was achieved by scaling the predictions from the tabular, spectral, and fusion modules using the weights defined during training.”
From A review of multimodal deep learning methods for genomic-enabled prediction in plant breeding (2024) · cites this paper as Danilevicz et al. (2021)
Experimental — accuracy not yet measuredThe cited source says what the claim attributes to it.
In the citing paper
“RF (with one-hot coding) seems to be the best model, along with RMSE, RMSE%, and R2 of 1.46 ± 0.08, 10.35 ± 0.54, and 0.55 ± 0.05, respectively, for the validation dataset”
From A review of multimodal deep learning methods for genomic-enabled prediction in plant breeding (2024) · cites this paper as Danilevicz et al. (2021)
The cited source says what the claim attributes to it.
In the citing paper
“The multimodal DL proposed by Danilevicz et al. (2021) functions as a support tool for early identification of good maize lines.”
From Multimodal deep learning methods enhance genomic prediction of wheat breeding (2023) · cites this paper as Danilevicz et al. (2021)
In the citing paper
“However, when tab-DNN and sp-DNN were fused, their joint predictive power clearly surpassed that of separated models.”
From A review of multimodal deep learning methods for genomic-enabled prediction in plant breeding (2024) · cites this paper as Danilevicz et al. (2021)
In the citing paper
“the tab-DNN gave 1.67 ± 0.04, 11.87 ± 0.33, and 0.41 ± 0.02, respectively, for the same metrics”
From A review of multimodal deep learning methods for genomic-enabled prediction in plant breeding (2024) · cites this paper as Danilevicz et al. (2021)
1 more claim about this paper
Create a free account to see every claim other papers make about this one.
Self-check
Percentages, sums and reported differences re-computed from the paper’s own numbers.
The self-check needs the paper’s full text.
Citations
The citation lists are queued
They are fetched later and appear here then.
References 66 · Cited by 75
Research works printed but not linked: 1
- Kingma, D.P., and Ba, J. Adam: A Method for Stochastic Optimization. arXiv.
Metadata
- Authors
- Danilevicz, M. F., Bayer, P. E., Boussaid, F., Bennamoun, M., & Edwards, D.
- Affiliations
- The University of Western Australia (AU)
- School of Computer Science and Software Engineering, University of Western Australia, Perth, WA 6009, Australia
- Corresponding author
- Edwards, David
- Venue
- Remote Sensing
- Publisher
- MDPI AG
- Published
- 2021-10-04
- Volume
- 13
- Issue
- 19
- Pages
- 3976
- ISSN
- 2072-4292 (ISSN-L)
- OpenAlex
- W3207463009
- Cited by
- 75
- References
- 66
- Citations by year
- 2026: 10 · 2025: 14 · 2024: 21 · 2023: 20 · 2022: 10
- FWCI
- 6.88
- Type
- journal article
- Language
- en
- Open access
- gold
- doi.org
- Licence
- Locations
- Remote Sensing (publishedVersion, cc-by)
- UWA Profiles and Research Repository (UWA) (publishedVersion, cc-by)
- DOAJ (DOAJ: Directory of Open Access Journals) (submittedVersion, cc-by-sa)
- Funders
- Australian Research Council (DP210100296, DP200100762)
- Grains Research and Development Corporation (9177539, 9177591)
- Topics
- Physical Sciences › Environmental Science › Ecology › Remote Sensing in Agriculture
- Life Sciences › Agricultural and Biological Sciences › Plant Science › Smart Agriculture and AI
- Physical Sciences › Chemistry › Analytical Chemistry › Spectroscopy and Chemometric Analyses
- Keywords
- maize yield prediction, early yield prediction, hybrid selection, multispectral imagery, unmanned aerial vehicles, vegetation indices, NDVI, NDREI, genotype data, field management, multimodal deep learning, crop breeding, decision support system
About these checks
Registry, retraction, Cites and statistics results are computed, not judged, with one exception: a printed reference that no index lists is read once by a model before it counts as a citation error. Claims are extracted by a model and kept only when their quote appears verbatim in the text; each cited source is then checked, with a model’s help, for whether it says what the claim relies on. Those verdicts can be wrong — read the claim’s quote and the cited source before relying on one.
Statistics and arithmetic are recomputed, not judged.
Confidence bands are shown only for fields calibrated on our annotated test set. None is calibrated yet, so no band is shown.
What counts as a claim ›How we measure confidence ›How we check this ›
Are you an author, or do you see a problem with this page? Request a review
How to cite
Cite CoChat for the checks on this page, and the paper for its own findings.
- This page
- CoChat. (2026). Citation check: Maize Yield Prediction at an Early Developmental Stage Using Multispectral Images and Genotype Data for Preliminary Hybrid Selection. https://app.cochat.ai/papers/10.3390/rs13193976
- The paper
- Danilevicz, M. F., Bayer, P. E., Boussaid, F., Bennamoun, M., & Edwards, D. (2021). Maize Yield Prediction at an Early Developmental Stage Using Multispectral Images and Genotype Data for Preliminary Hybrid Selection. Remote Sensing. https://doi.org/10.3390/rs13193976
Data sources
Bibliographic data: Semantic Scholar, OpenAlex, Crossref.
Contains information from the Semantic Scholar Academic Graph Datasets, made available under the ODC Attribution License (ODC-BY 1.0).
Semantic Scholar’s data is described in: Kinney, R., et al. (2023). The Semantic Scholar Open Data Platform. arXiv:2301.10140.
