

The DOI matches its Crossref record; 6 of the 6 references it cites were found in a registry or an index.
A Novel Urban Heat Vulnerability Analysis: Integrating Machine Learning and Remote Sensing for Enhanced Insights
Open accessAbstract
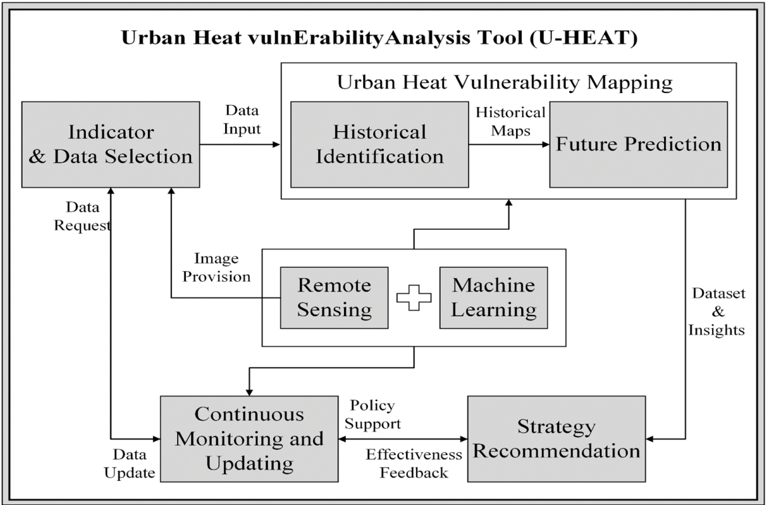
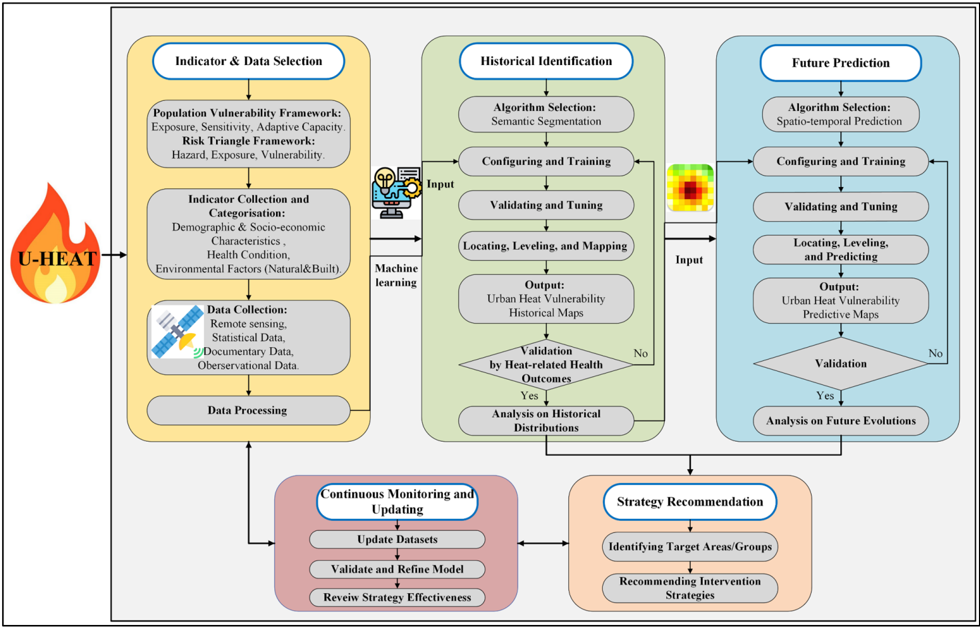
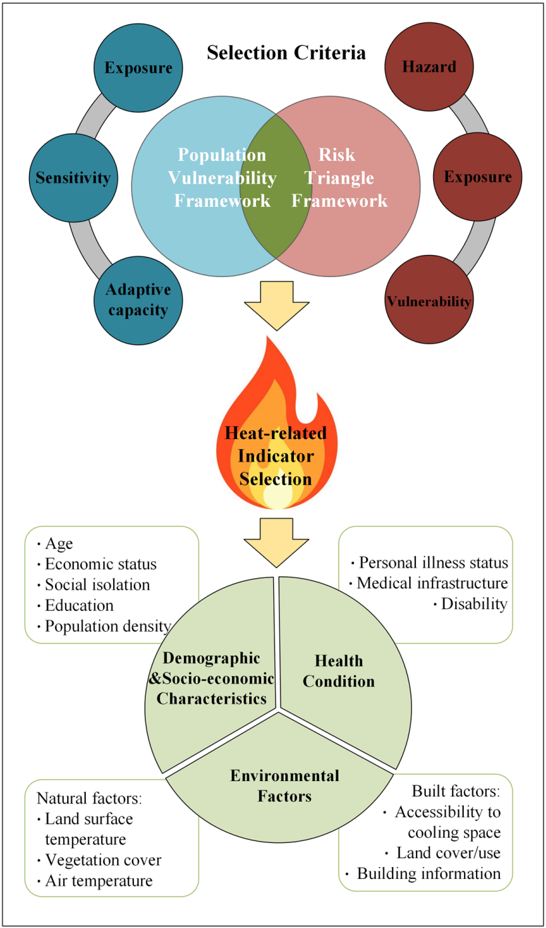
Rapid urbanization and climate change exacerbate the urban heat island effect, increasing the vulnerability of urban residents to extreme heat. Although many studies have assessed urban heat vulnerability, there is a significant lack of standardized criteria and references for selecting indicators, building models, and validating those models. Many existing approaches do not adequately meet urban planning needs due to insufficient spatial resolution, temporal coverage, and accuracy. To address this gap, this paper introduces the U-HEAT framework, a conceptual model for analyzing urban heat vulnerability. The primary objective is to outline the theoretical foundations and potential applications of U-HEAT, emphasizing its conceptual nature. This framework integrates machine learning (ML) with remote sensing (RS) to identify urban heat vulnerability at both long-term and detailed levels. It combines retrospective and forward-looking mapping for continuous monitoring and assessment, providing essential data for developing comprehensive strategies. With its active learning capacity, U-HEAT enables model refinement and the evaluation of policy impacts. The framework presented in this paper offers a standardized and sustainable approach, aiming to enhance practical analysis tools. It highlights the importance of interdisciplinary research in bolstering urban resilience and stresses the need for sustainable urban ecosystems capable of addressing the complex challenges posed by climate change and increased urban heat. This study provides valuable insights for researchers, urban administrators, and planners to effectively combat urban heat challenges.
Overview
The claims and statistics of this paper haven’t been checked yet.
Run the check — free, no account needed. It reads the open-access text and checks the sources it cites.
Integrity signals
Registry
Cites
Statistics
Figures
Verification
Claims the paper makes
The claims and statistics of this paper haven’t been checked yet.
Run the check — free, no account needed. It reads the open-access text and checks the sources it cites.
Claims other papers make about this one
Each is checked against this paper’s own text: does it say what the citing paper says it does?
In the citing paper
“Recent studies demonstrate that urban heat assessment should not be limited to temperature mapping but should also incorporate exposure, vulnerability, and population-related factors [25].”
From GPU-Accelerated Deep Learning for Heatwave Prediction and Urban Heat Risk Assessment (2026) · cites this paper as [25]
Self-check
Percentages, sums and reported differences re-computed from the paper’s own numbers.
The self-check needs the paper’s full text.
Citations
Cites
U-Net: Convolutional Networks for Biomedical Image Segmentation
Ronneberger, O., Fischer, P., & Brox, T. (2015) · Lecture notes in computer science · doi:10.1007/978-3-319-24574-4_28 · Cited by 99,404
Artificial intelligence, systemic risks, and sustainability
Galaz, V., Centeno, M. A., Callahan, P. W., Causevic, A., Patterson, T., Brass, I., Baum, S., Farber, D., Fischer, J., Garcia, D., et al. (2021) · Technology in Society · doi:10.1016/j.techsoc.2021.101741 · Cited by 497
Niu, Y., Li, Z., Gao, Y., Liu, X., Xu, L., Vardoulakis, S., Yue, Y., Wang, J., & Liu, Q. (2021) · Current Climate Change Reports · doi:10.1007/s40641-021-00173-3 · Cited by 129
Long-term exposure to high temperature associated with the incidence of major depressive disorder
Chen, N.-T., Lin, P.-H., & Guo, Y.-L. L. (2019) · Science of The Total Environment · doi:10.1016/j.scitotenv.2018.12.434 · Cited by 81
Mapping vulnerability to extreme heat events: Lessons from metropolitan Chicago
Wilson, B., & Chakraborty, A. (2019) · Journal of Environmental Planning and Management · doi:10.1080/09640568.2018.1462475 · Cited by 71
Rethinking Sustainable Development: Urban Management, Engineering, and Design
(2010) · Advances in Environmental Engineering and Green Technologies · doi:10.4018/978-1-61692-022-7 · Cited by 42
Self-citation
Research works printed but not linked: 116
- Kamruzzaman, 2018, Investigating the Urban Heat Island Effect of Transit Oriented Development in Brisbane, J. Transp. Geogr., 66, 116, 10.1016/j.jtrangeo.2017.11.016 · DOI
- Degirmenci, 2021, Understanding Policy and Technology Responses in Mitigating Urban Heat Islands: A Literature Review and Directions for Future Research, Sustain. Cities Soc., 70, 102873, 10.1016/j.scs.2021.102873 · DOI
- Vescovi, 2005, Assessing Public Health Risk Due to Extremely High Temperature Events: Climate and Social Parameters, Clim. Res., 30, 71, 10.3354/cr030071 · DOI
- Harlan, 2006, Neighborhood Microclimates and Vulnerability to Heat Stress, Soc. Sci. Med., 63, 2847, 10.1016/j.socscimed.2006.07.030 · DOI · Paper page
- Reid, 2009, Mapping Community Determinants of Heat Vulnerability, Environ. Health Perspect., 117, 1730, 10.1289/ehp.0900683 · DOI · Paper page
- Boumans, 2014, Developing a Model for Effects of Climate Change on Human Health and Health–Environment Interactions: Heat Stress in Austin, Texas, Urban Clim., 8, 78, 10.1016/j.uclim.2014.03.001 · DOI
- Zhang, W., McManus, P., and Duncan, E. (2018). A Raster-Based Subdividing Indicator to Map Urban Heat Vulnerability: A Case Study in Sydney, Australia. Int. J. Environ. Res. Public Health, 15. · DOI
- Cheng, 2021, Approaches for Identifying Heat-Vulnerable Populations and Locations: A Systematic Review, Sci. Total Environ., 799, 149417, 10.1016/j.scitotenv.2021.149417 · DOI
- Adger, 2006, Vulnerability, Glob. Environ. Change, 16, 268, 10.1016/j.gloenvcha.2006.02.006 · DOI · Paper page
- Tate, 2012, Social Vulnerability Indices: A Comparative Assessment Using Uncertainty and Sensitivity Analysis, Nat. Hazards, 63, 325, 10.1007/s11069-012-0152-2 · DOI
- Chen, 2018, Spatially Explicit Assessment of Heat Health Risk by Using Multi-Sensor Remote Sensing Images and Socioeconomic Data in Yangtze River Delta, China, Int. J. Health Geogr., 17, 13, 10.1186/s12942-018-0135-y · DOI
- Li, F., Yigitcanlar, T., Nepal, M., Nguyen, K., and Dur, F. (2022). Understanding Urban Heat Vulnerability Assessment Methods: A PRISMA Review. Energies, 15. · DOI
- Kazak, J. (2018). The Use of a Decision Support System for Sustainable Urbanization and Thermal Comfort in Adaptation to Climate Change Actions: The Case of the Wrocław Larger Urban Zone (Poland). Sustainability, 10. · DOI
- He, 2019, Exploring the Mechanisms of Heat Wave Vulnerability at the Urban Scale Based on the Application of Big Data and Artificial Societies, Environ. Int., 127, 573, 10.1016/j.envint.2019.01.057 · DOI
- Holec, 2021, Heat Risk Assessment Based on Mobile Phone Data: Case Study of Bratislava, Slovakia, Nat. Hazards, 108, 3099, 10.1007/s11069-021-04816-4 · DOI
- Weber, 2015, Policy-Relevant Indicators for Mapping the Vulnerability of Urban Populations to Extreme Heat Events: A Case Study of Philadelphia, Appl. Geogr., 63, 231, 10.1016/j.apgeog.2015.07.006 · DOI
- Heaton, 2014, Characterizing Urban Vulnerability to Heat Stress Using a Spatially Varying Coefficient Model, Spat. Spatio-Temporal Epidemiol., 8, 23, 10.1016/j.sste.2014.01.002 · DOI
- Yin, 2021, DTEx: A Dynamic Urban Thermal Exposure Index Based on Human Mobility Patterns, Environ. Int., 155, 106573, 10.1016/j.envint.2021.106573 · DOI
- Bu, 2024, Spatial distribution of heat vulnerability in Toronto, Canada, Urban Clim., 54, 101838, 10.1016/j.uclim.2024.101838 · DOI
- Barron, L., Ruggieri, D., and Branas, C. (2018). Assessing Vulnerability to Heat: A Geospatial Analysis for the City of Philadelphia. Urban Sci., 2. · DOI
- Prosdocimi, 2020, Health Effects of Heat Vulnerability in Rio de Janeiro: A Validation Model for Policy Applications, SN Appl. Sci., 2, 1948, 10.1007/s42452-020-03750-7 · DOI
- Oh, K., Lee, M., and Jeon, S. (2017). Development of the Korean Climate Change Vulnerability Assessment Tool (VESTAP): Centered on Health Vulnerability to Heat Waves. Sustainability, 9. · DOI
- Dong, 2020, Heatwave-Induced Human Health Risk Assessment in Megacities Based on Heat Stress-Social Vulnerability-Human Exposure Framework, Landsc. Urban Plan., 203, 103907, 10.1016/j.landurbplan.2020.103907 · DOI
- Ho, 2015, A Spatial Framework to Map Heat Health Risks at Multiple Scales, Int. J. Environ. Res. Public Health, 12, 16110, 10.3390/ijerph121215046 · DOI
- Krstic, 2017, The Heat Exposure Integrated Deprivation Index (HEIDI): A Data-Driven Approach to Quantifying Neighborhood Risk During Extreme Hot Weather, Environ. Int., 109, 42, 10.1016/j.envint.2017.09.011 · DOI
- Tomlinson, 2011, Including the Urban Heat Island in Spatial Heat Health Risk Assessment Strategies: A Case Study for Birmingham, UK, Int. J. Health Geogr., 10, 42, 10.1186/1476-072X-10-42 · DOI
- Macintyre, 2017, Assessing Urban Population Vulnerability and Environmental Risks Across an Urban Area During Heatwaves: Implications for Health Protection, Sci. Total Environ., 610–611, 678
- Johnson, 2012, Developing an Applied Extreme Heat Vulnerability Index Utilizing Socioeconomic and Environmental Data, Appl. Geogr., 35, 23, 10.1016/j.apgeog.2012.04.006 · DOI
- Kamal, 2021, Extreme Heat Vulnerability Assessment in Tropical Region: A Case Study in Malaysia, Clim. Dev., 4, 472
- Conlon, 2020, Mapping Human Vulnerability to Extreme Heat: A Critical Assessment of Heat Vulnerability Indices Created Using Principal Components Analysis, Environ. Health Perspect., 128, 97001, 10.1289/EHP4030 · DOI
- Estoque, 2020, Heat Health Risk Assessment in Philippine Cities Using Remotely Sensed Data and Social-Ecological Indicators, Nat. Commun., 11, 1581, 10.1038/s41467-020-15218-8 · DOI
- Yoo, 2021, Association Between Extreme Temperatures and Emergency Room Visits Related to Mental Disorders: A Multi-Region Time-Series Study in New York, USA, Sci. Total Environ., 792, 148246, 10.1016/j.scitotenv.2021.148246 · DOI
- Huang, 2019, Automatic Extraction of Impervious Surfaces from High Resolution Remote Sensing Images Based on Deep Learning, J. Vis. Commun. Image Represent., 58, 453, 10.1016/j.jvcir.2018.11.041 · DOI
- Wang, 2022, A Comprehensive Review on Deep Learning Based Remote Sensing Image Super-Resolution Methods, Earth-Sci. Rev., 234, 104110, 10.1016/j.earscirev.2022.104110 · DOI
- Osaku, 2015, Improving Land Cover Classification through Contextual-Based Optimum-Path Forest, Inf. Sci., 324, 60, 10.1016/j.ins.2015.06.020 · DOI
- Kafy, 2022, Predicting the Impacts of Land Use/Land Cover Changes on Seasonal Urban Thermal Characteristics Using Machine Learning Algorithms, Build. Environ., 217, 109066, 10.1016/j.buildenv.2022.109066 · DOI
- Uniyal, 2022, Quantification of Carbon Sequestration by Urban Forest Using Landsat 8 OLI and Machine Learning Algorithms in Jodhpur, India, Urban For. Urban Green., 67, 127445, 10.1016/j.ufug.2021.127445 · DOI
- Wu, 2022, Developing a Data-Fusing Method for Mapping Fine-Scale Urban Three-Dimensional Building Structure, Sustain. Cities Soc., 80, 103716, 10.1016/j.scs.2022.103716 · DOI
- Kim, 2024, Deep Learning-Based Analytic Framework Using Comprehensive Urbanization Index for Heat Vulnerability Assessment in Urban Areas, Expert Syst. Appl., 235, 121140, 10.1016/j.eswa.2023.121140 · DOI
- Li, 2023, Machine Learning and Remote Sensing Integration for Leveraging Urban Sustainability: A Review and Framework, Sustain. Cities Soc., 96, 104653, 10.1016/j.scs.2023.104653 · DOI
- Zhu, 2022, A Weakly Pseudo-Supervised Decorrelated Subdomain Adaptation Framework for Cross-Domain Land-Use Classification, IEEE Trans. Geosci. Remote Sens., 60, 1, 10.1109/TGRS.2022.3230829 · DOI
- Jamali, 2019, Evaluation and Comparison of Eight Machine Learning Models in Land Use/Land Cover Mapping Using Landsat 8 OLI: A Case Study of the Northern Region of Iran, SN Appl. Sci., 1, 1527, 10.1007/s42452-019-1527-8 · DOI
- Frantz, 2021, National-Scale Mapping of Building Height Using Sentinel-1 and Sentinel-2 Time Series, Remote Sens. Environ., 252, 112128, 10.1016/j.rse.2020.112128 · DOI
- Guo, 2021, A Machine Learning-Based Strategy for Estimating Non-Optically Active Water Quality Parameters Using Sentinel-2 Imagery, Int. J. Remote Sens., 42, 1841, 10.1080/01431161.2020.1846222 · DOI
- Manchado, 2022, ArcUHI: A GIS Add-In for Automated Modelling of the Urban Heat Island Effect through Machine Learning, Urban Clim., 44, 101203, 10.1016/j.uclim.2022.101203 · DOI
- Abunnasr, 2022, Towards a Combined Landsat-8 and Sentinel-2 for 10-m Land Surface Temperature Products: The Google Earth Engine Monthly Ten-ST-GEE System, Environ. Model. Softw., 155, 105456, 10.1016/j.envsoft.2022.105456 · DOI
- Casali, 2022, Machine Learning for Spatial Analyses in Urban Areas: A Scoping Review, Sustain. Cities Soc., 85, 104050, 10.1016/j.scs.2022.104050 · DOI
- Demarchi, 2014, Assessing the Performance of Two Unsupervised Dimensionality Reduction Techniques on Hyperspectral APEX Data for High Resolution Urban Land-Cover Mapping, ISPRS J. Photogramm. Remote Sens., 87, 166, 10.1016/j.isprsjprs.2013.10.012 · DOI
- Deng, 2013, The Use of Single-Date MODIS Imagery for Estimating Large-Scale Urban Impervious Surface Fraction with Spectral Mixture Analysis and Machine Learning Techniques, ISPRS J. Photogramm. Remote Sens., 86, 100, 10.1016/j.isprsjprs.2013.09.010 · DOI
- Priem, 2019, Comparing Map-Based and Library-Based Training Approaches for Urban Land-Cover Fraction Mapping from Sentinel-2 Imagery, Int. J. Appl. Earth Obs. Geoinf., 78, 295
- Yigitcanlar, 2006, Australian Local Governments’ Practice and Prospects with Online Planning, URISA J., 18, 7
- Patino, 2013, A Review of Regional Science Applications of Satellite Remote Sensing in Urban Settings, Comput. Environ. Urban Syst., 37, 1, 10.1016/j.compenvurbsys.2012.06.003 · DOI
- Touzani, S., and Granderson, J. (2021). Open Data and Deep Semantic Segmentation for Automated Extraction of Building Footprints. Remote Sens., 13. · DOI
- Chi, 2022, Machine Learning-Based Estimation of Ground-Level NO2 Concentrations over China, Sci. Total Environ., 807, 150721, 10.1016/j.scitotenv.2021.150721 · DOI
- Peng, B., Meng, Z., Huang, Q., and Wang, C. (2019). Patch Similarity Convolutional Neural Network for Urban Flood Extent Mapping Using Bi-Temporal Satellite Multispectral Imagery. Remote Sens., 11. · DOI
- Ghaffarian, 2021, Agent-Based Modelling of Post-Disaster Recovery with Remote Sensing Data, Int. J. Disaster Risk Reduct., 60, 102285, 10.1016/j.ijdrr.2021.102285 · DOI
- Zhang, 2023, Exploring the Response of Ecosystem Service Value to Land Use Changes under Multiple Scenarios Coupling a Mixed-Cell Cellular Automata Model and System Dynamics Model in Xi’an, China, Ecol. Indic., 147, 110009, 10.1016/j.ecolind.2023.110009 · DOI
- Li, 2024, Understanding urban heat vulnerability: Scientometric analysis of five decades of research, Urban Clim., 56, 102035, 10.1016/j.uclim.2024.102035 · DOI
- Yigitcanlar, T. (2010). Sustainable Urban and Regional Infrastructure Development: Technologies, Applications and Management, IGI Global. · DOI · Paper page
- Diop, 2022, Reviewing the Application of Machine Learning Methods to Model Urban Form Indicators in Planning Decision Support Systems: Potential, Issues and Challenges, J. King Saud Univ.-Comput. Inf. Sci., 34, 5943
- Karanja, 2021, Perspectives on Spatial Representation of Urban Heat Vulnerability, Sci. Total Environ., 774, 145634, 10.1016/j.scitotenv.2021.145634 · DOI
- Intergovernmental Panel On Climate Change (2001). Climate Change 2007: Impacts, Adaptation and Vulnerability, Intergovernmental Panel On Climate Change. · DOI
- Rinner, 2010, The Role of Maps in Neighborhood-Level Heat Vulnerability Assessment for the City of Toronto, Cartogr. Geogr. Inf. Sci., 37, 31, 10.1559/152304010790588089 · DOI
- Depietri, 2013, Social Vulnerability Assessment of the Cologne Urban Area (Germany) to Heat Waves: Links to Ecosystem Services, Int. J. Disaster Risk Reduct., 6, 98, 10.1016/j.ijdrr.2013.10.001 · DOI
- Hulley, G., Shivers, S., Wetherley, E., and Cudd, R. (2019). New ECOSTRESS and MODIS Land Surface Temperature Data Reveal Fine-Scale Heat Vulnerability in Cities: A Case Study for Los Angeles County, California. Remote Sens., 11. · DOI
- Buscail, 2012, Mapping Heatwave Health Risk at the Community Level for Public Health Action, Int. J. Health Geogr., 11, 38, 10.1186/1476-072X-11-38 · DOI
- Dugord, 2014, Land Use Patterns, Temperature Distribution, and Potential Heat Stress Risk: The Case Study Berlin, Germany, Comput. Environ. Urban Syst., 48, 86, 10.1016/j.compenvurbsys.2014.07.005 · DOI
- Paranunzio, 2021, Assessing Current and Future Heat Risk in Dublin City, Ireland, Urban Clim., 40, 100983, 10.1016/j.uclim.2021.100983 · DOI
- Luber, 2008, Climate Change and Extreme Heat Events, Am. J. Prev. Med., 35, 429, 10.1016/j.amepre.2008.08.021 · DOI
- Cheng, 2020, An Energy Budget Model for Estimating the Thermal Comfort of Children, Int. J. Biometeorol., 64, 1355, 10.1007/s00484-020-01916-x · DOI
- Alonso, L., and Renard, F. (2020). A Comparative Study of the Physiological and Socio-Economic Vulnerabilities to Heat Waves of the Population of the Metropolis of Lyon (France) in a Climate Change Context. Int. J. Environ. Res. Public Health, 17. · DOI
- Hu, 2017, Spatially Explicit Mapping of Heat Health Risk Utilizing Environmental and Socioeconomic Data, Environ. Sci. Technol., 51, 1498, 10.1021/acs.est.6b04355 · DOI
- Kwon, Y., Lee, D., and Kwon, Y. (2020). Is Sensible Heat Flux Useful for the Assessment of Thermal Vulnerability in Seoul (Korea)?. Int. J. Environ. Res. Public Health, 17. · DOI
- Reid, 2012, Evaluation of a Heat Vulnerability Index on Abnormally Hot Days: An Environmental Public Health Tracking Study, Environ. Health Perspect., 120, 715, 10.1289/ehp.1103766 · DOI
- Xiao, 2022, Generating a Long-Term (2003−2020) Hourly 0.25° Global PM2.5 Dataset via Spatiotemporal Downscaling of CAMS with Deep Learning (DeepCAMS), Sci. Total Environ., 848, 157747, 10.1016/j.scitotenv.2022.157747 · DOI
- Loughnan, 2012, Mapping Heat Health Risks in Urban Areas, Int. J. Popul. Res., 2012, 518687
- Hammer, 2020, Local Extreme Heat Planning: An Interactive Tool to Examine a Heat Vulnerability Index for Philadelphia, Pennsylvania, J. Urban Health, 97, 519, 10.1007/s11524-020-00443-9 · DOI
- Lammers, 2021, Prediction Models for Urban Flood Evolution for Satellite Remote Sensing, J. Hydrol., 603, 127175, 10.1016/j.jhydrol.2021.127175 · DOI
- Wei, 2021, Delineating the Spatial-Temporal Variation of Air Pollution with Urbanization in the Belt and Road Initiative Area, Environ. Impact Assess. Rev., 91, 106646, 10.1016/j.eiar.2021.106646 · DOI
- Yan, C., Fan, X., Fan, J., and Wang, N. (2022). Improved U-Net Remote Sensing Classification Algorithm Based on Multi-Feature Fusion Perception. Remote Sens., 14. · DOI
- Li, 2023, U-Net-Based Semantic Classification for Flood Extent Extraction Using SAR Imagery and GEE Platform: A Case Study for 2019 Central US Flooding, Sci. Total Environ., 869, 161757, 10.1016/j.scitotenv.2023.161757 · DOI
- Stehman, 2011, Adapting a Global Stratified Random Sample for Regional Estimation of Forest Cover Change Derived from Satellite Imagery, Remote Sens. Environ., 115, 650, 10.1016/j.rse.2010.10.009 · DOI
- Amani, 2023, A Review of Machine Learning Models and Influential Factors for Estimating Evapotranspiration Using Remote Sensing and Ground-Based Data, Agric. Water Manag., 284, 108324, 10.1016/j.agwat.2023.108324 · DOI
- Wang, 2023, Health-Integrated Heat Risk Assessment in Australian Cities, Environ. Impact Assess. Rev., 102, 107176, 10.1016/j.eiar.2023.107176 · DOI
- Vu, 2022, Analysis of Input Set Characteristics and Variances on k-Fold Cross Validation for a Recurrent Neural Network Model on Waste Disposal Rate Estimation, J. Environ. Manag., 311, 114869, 10.1016/j.jenvman.2022.114869 · DOI
- Azhar, G., Saha, S., Ganguly, P., Mavalankar, D., and Madrigano, J. (2017). Heat Wave Vulnerability Mapping for India. Int. J. Environ. Res. Public Health, 14. · DOI
- Guo, X., Huang, G., Jia, P., and Wu, J. (2019). Estimating Fine-Scale Heat Vulnerability in Beijing through Two Approaches: Spatial Patterns, Similarities, and Divergence. Remote Sens., 11. · DOI
- Shang, 2023, Spatio-Temporal Analysis of Carbon Footprints for Urban Public Transport Systems Based on Smart Card Data, Appl. Energy, 352, 121859, 10.1016/j.apenergy.2023.121859 · DOI
- Matthews, 2015, Reconceptualizing Green Infrastructure for Climate Change Adaptation: Barriers to Adoption and Drivers for Uptake by Spatial Planners, Landsc. Urban Plan., 138, 155, 10.1016/j.landurbplan.2015.02.010 · DOI
- Mitchell, 2015, Landscapes of Thermal Inequity: Disproportionate Exposure to Urban Heat in the Three Largest US Cities, Environ. Res. Lett., 10, 115005, 10.1088/1748-9326/10/11/115005 · DOI
- Ferreira, 2021, An Explicitly Spatial Approach to Identify Heat Vulnerable Urban Areas and Landscape Patterns, Urban Clim., 40, 101021, 10.1016/j.uclim.2021.101021 · DOI
- Wieland, 2016, Large-Area Settlement Pattern Recognition from Landsat-8 Data, ISPRS J. Photogramm. Remote Sens., 119, 294, 10.1016/j.isprsjprs.2016.06.010 · DOI
- Das, 2021, Spatio-Temporal Pattern of Land Use and Land Cover and Its Effects on Land Surface Temperature Using Remote Sensing and GIS Techniques: A Case Study of Bhubaneswar City, Eastern India (1991–2021), GeoJournal, 87, 765, 10.1007/s10708-021-10541-z · DOI
- Tao, 2023, Time-Sensitive Prediction of NO2 Concentration in China Using an Ensemble Machine Learning Model from Multi-Source Data, J. Environ. Sci., 137, 30, 10.1016/j.jes.2023.02.026 · DOI
- Tella, 2021, Spatial Assessment of PM10 Hotspots Using Random Forest, K-Nearest Neighbour and Naïve Bayes, Atmos. Pollut. Res., 12, 101202, 10.1016/j.apr.2021.101202 · DOI
- Al-Aizari, A.R., Al-Masnay, Y.A., Aydda, A., Zhang, J., Ullah, K., Islam, A.R.M.T., Habib, T., Kaku, D.U., Nizeyimana, J.C., and Al-Shaibah, B. (2022). Assessment Analysis of Flood Susceptibility in Tropical Desert Area: A Case Study of Yemen. Remote Sens., 14. · DOI
- Singleton, 2022, Estimating Generalized Measures of Local Neighbourhood Context from Multispectral Satellite Images Using a Convolutional Neural Network, Comput. Environ. Urban Syst., 95, 101802, 10.1016/j.compenvurbsys.2022.101802 · DOI
- Papadomanolaki, 2021, A Deep Multitask Learning Framework Coupling Semantic Segmentation and Fully Convolutional LSTM Networks for Urban Change Detection, IEEE Trans. Geosci. Remote Sens., 59, 7651, 10.1109/TGRS.2021.3055584 · DOI
- Zhu, 2021, Multitemporal Relearning with Convolutional LSTM Models for Land Use Classification, IEEE J. Sel. Top. Appl. Earth Obs. Remote Sens., 14, 3251, 10.1109/JSTARS.2021.3055784 · DOI
- He, Z., Chow, C.Y., and Zhang, J.D. (2019, January 10–13). STCNN: A Spatio-Temporal Convolutional Neural Network for Long-Term Traffic Prediction. Proceedings of the 2019 20th IEEE International Conference on Mobile Data Management (MDM), Hong Kong, China. · DOI
- Xiao, 2023, Predicting Urban Region Heat via Learning Arrive-Stay-Leave Behaviors of Private Cars, IEEE Trans. Intell. Transp. Syst., 24, 10843, 10.1109/TITS.2023.3276704 · DOI
- Yu, B., Yin, H., and Zhu, Z. (2017). Spatio-temporal Graph Convolutional Networks: A Deep Learning Framework for Traffic Forecasting. arXiv. · DOI
- Xu, Z., Li, J., Lv, Z., Wang, Y., and Li, H. (2021, January 28). A Prediction Method for Population Density in Key Areas. Proceedings of the International Symposium on Artificial Intelligence and Robotics 2021, Fukuoka, Japan. · DOI
- Kim, 2020, Advancing Scenario Planning through Integrating Urban Growth Prediction with Future Flood Risk Models, Comput. Environ. Urban Syst., 82, 101498, 10.1016/j.compenvurbsys.2020.101498 · DOI
- Ma, 2022, Forecasting Vegetation Dynamics in an Open Ecosystem by Integrating Deep Learning and Environmental Variables, Int. J. Appl. Earth Obs. Geoinf., 114, 103060
- Dehghani, 2023, Comparative Evaluation of LSTM, CNN, and ConvLSTM for Hourly Short-Term Streamflow Forecasting Using Deep Learning Approaches, Ecol. Inform., 75, 102119, 10.1016/j.ecoinf.2023.102119 · DOI
- Maier, 2014, Assessing the Performance of a Vulnerability Index during Oppressive Heat across Georgia, United States, Weather. Clim. Soc., 6, 253, 10.1175/WCAS-D-13-00037.1 · DOI
- Mushore, 2017, Determining Extreme Heat Vulnerability of Harare Metropolitan City Using Multispectral Remote Sensing and Socio-Economic Data, J. Spat. Sci., 63, 173, 10.1080/14498596.2017.1290558 · DOI
- Khan, 2022, Machine Learning-Based Monitoring and Modeling for Spatio-Temporal Urban Growth of Islamabad, Egypt. J. Remote Sens. Space Sci., 25, 541
- Tuczek, 2022, Mitigating urban heat with optimal distribution of vegetation and buildings, Urban Clim., 44, 101208, 10.1016/j.uclim.2022.101208 · DOI
- Liu, Y., Yigitcanlar, T., Guaralda, M., Degirmenci, K., and Liu, A. (2024). Spatial Modelling of Urban Wind Characteristics: Review of Contributions to Sustainable Urban Development. Buildings, 14. · DOI
- Liu, Y., Guaralda, M., Yigitcanlar, T., Limb, M., and Garcia-Hansen, V. (2024). Navigating urban climate design implementation challenges: Insights from Brisbane’s built environment experts. J. Urban Des., 1–20. · DOI
- Guo, 2024, Framework of street grid-based urban heat vulnerability assessment: Integrating entropy weight method and BPNN model, Urban Clim., 56, 102067, 10.1016/j.uclim.2024.102067 · DOI
- Kitchley, 2024, A framework to assess the contextual composite heat vulnerability index for a heritage city in India-A case study of Madurai, Sustain. Cities Soc., 101, 105119, 10.1016/j.scs.2023.105119 · DOI
- Wu, 2024, Spatially explicit assessment of the heat-related health risk in the Yangtze River Delta, China, using multisource remote sensing and socioeconomic data, Sustain. Cities Soc., 104, 105300, 10.1016/j.scs.2024.105300 · DOI
- Wang, 2023, Machine Learning Applications on Air Temperature Prediction in the Urban Canopy Layer: A Critical Review of 2011–2022, Urban Clim., 49, 101499, 10.1016/j.uclim.2023.101499 · DOI
Cited by
Sorted by citations
GPU-Accelerated Deep Learning for Heatwave Prediction and Urban Heat Risk Assessment
Alihodžić, A. (2026) · arXiv · doi:10.48550/arxiv.2605.16435
“Recent studies demonstrate that urban heat assessment should not be limited to temperature mapping but should also incorporate exposure, vulnerability, and population-related factors [25].”
Metadata
- Authors
- Li, F., Yigitcanlar, T., Nepal, M., Thanh, K. N., & Dur, F.
- Affiliations
- Queensland University of Technology (AU)
- City 4.0 Lab, School of Architecture and Built Environment, Faculty of Engineering, Queensland University of Technology, 2 George Street, Brisbane, QLD 4000, Australia
- School of Electrical Engineering and Robotics, Faculty of Engineering, Queensland University of Technology, 2 George Street, Brisbane, QLD 4000, Australia
- Venue
- Remote Sensing
- Publisher
- MDPI AG
- Published
- 2024-08-18
- Volume
- 16
- Issue
- 16
- Pages
- 3032
- ISSN
- 2072-4292 (ISSN-L)
- OpenAlex
- W4401703721
- Cited by
- 59
- References
- 6
- Citations by year
- 2026: 28 · 2025: 27 · 2024: 4
- FWCI
- 6.95
- Type
- journal article
- Language
- en
- Open access
- gold
- doi.org
- Licence
- Locations
- Remote Sensing (publishedVersion, cc-by)
- QUT ePrints (Queensland University of Technology) (submittedVersion, cc-by)
- DOAJ (DOAJ: Directory of Open Access Journals) (submittedVersion)
- Topics
- Physical Sciences › Environmental Science › Environmental Engineering › Urban Heat Island Mitigation
- Physical Sciences › Environmental Science › Health, Toxicology and Mutagenesis › Climate Change and Health Impacts
- Physical Sciences › Environmental Science › Global and Planetary Change › Land Use and Ecosystem Services
- Keywords
- urban heat vulnerability, urban heat island, machine learning, urban resilience, climate change adaptation, urban planning, heat risk mapping, active learning (machine learning)
About these checks
Registry, retraction, Cites and statistics results are computed, not judged, with one exception: a printed reference that no index lists is read once by a model before it counts as a citation error. Claims are extracted by a model and kept only when their quote appears verbatim in the text; each cited source is then checked, with a model’s help, for whether it says what the claim relies on. Those verdicts can be wrong — read the claim’s quote and the cited source before relying on one.
Statistics and arithmetic are recomputed, not judged.
Confidence bands are shown only for fields calibrated on our annotated test set. None is calibrated yet, so no band is shown.
What counts as a claim ›How we measure confidence ›How we check this ›
Are you an author, or do you see a problem with this page? Request a review
How to cite
Cite CoChat for the checks on this page, and the paper for its own findings.
- This page
- CoChat. (2026). Citation check: A Novel Urban Heat Vulnerability Analysis: Integrating Machine Learning and Remote Sensing for Enhanced Insights. https://app.cochat.ai/papers/10.3390/rs16163032
- The paper
- Li, F., Yigitcanlar, T., Nepal, M., Thanh, K. N., & Dur, F. (2024). A Novel Urban Heat Vulnerability Analysis: Integrating Machine Learning and Remote Sensing for Enhanced Insights. Remote Sensing. https://doi.org/10.3390/rs16163032
