

The DOI matches its Crossref record; 45 of the 47 references it cites were found in a registry or an index.
Novel Bearing Fault Diagnosis Using Gaussian Mixture Model-Based Fault Band Selection
Open accessAbstract
This paper proposes a Gaussian mixture model-based (GMM) bearing fault band selection (GMM-WBBS) method for signal processing. The proposed method benefits reliable feature extraction using fault frequency oriented Gaussian mixture model (GMM) window series. Selecting exclusively bearing fault frequency harmonics, it eliminates the interference of bearing normal vibrations in the lower frequencies, bearing natural frequencies, and the higher frequency contents that prove to be useful only for anomaly detection but do not provide any insight into the bearing fault location. The features are extracted from time- and frequency- domain signals that exclusively contain the bearing fault frequency harmonics. Classification is done using the Weighted KNN algorithm. The experiments performed with the data containing the vibrations recorded from artificially damaged bearings show the positive effect of utilizing the proposed GMM-WBBS signal processing to filter out the discriminative data of uncertain origin. All comparison methods retrofitted with the proposed method demonstrated classification performance improvements when provided with vibration data with suppressed bearing natural frequencies and higher frequency contents.
Overview
The claims and statistics of this paper haven’t been checked yet.
Run the check — free, no account needed. It reads the open-access text and checks the sources it cites.
Integrity signals
Registry
Cites
Statistics
Figures
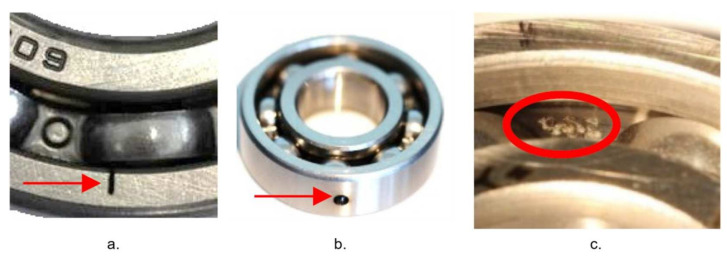
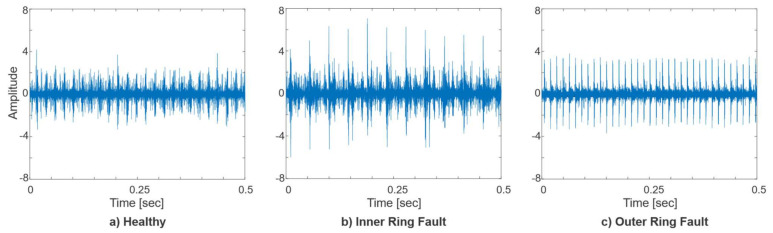
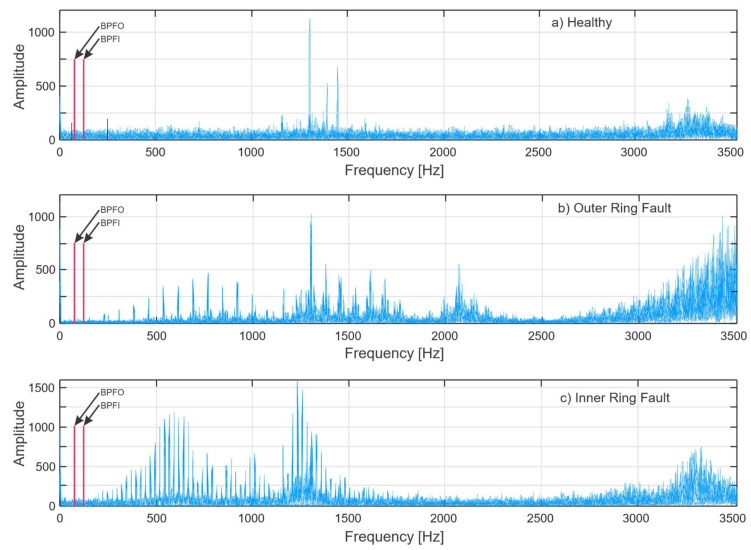
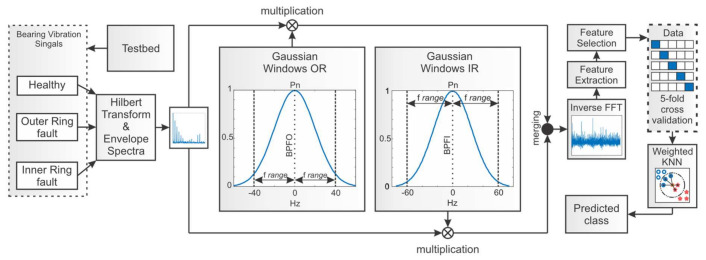
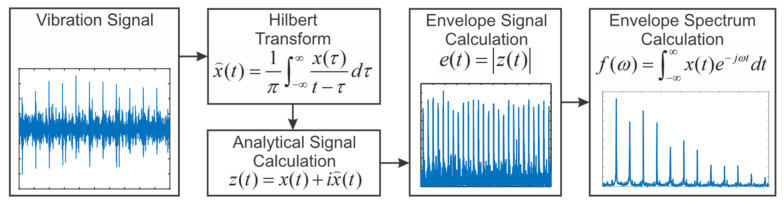
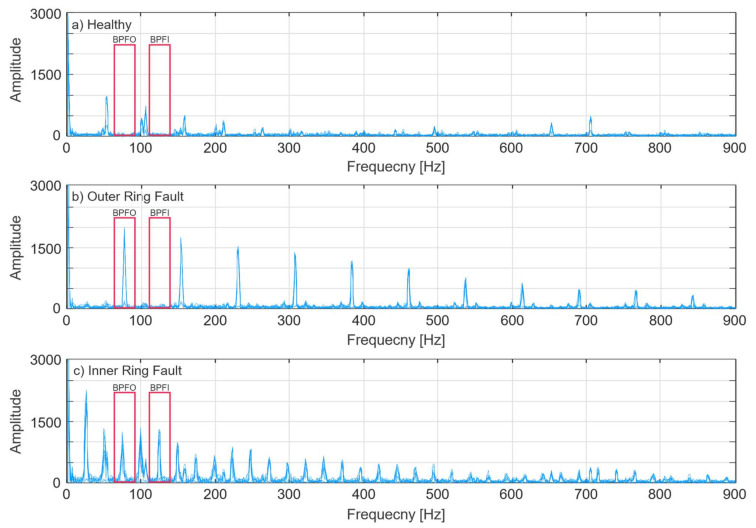
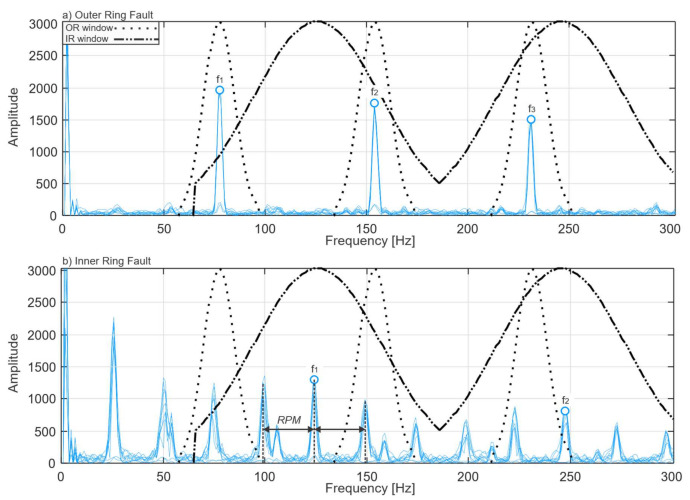
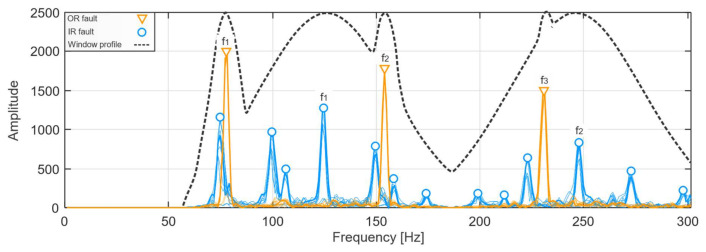
Verification
Claims the paper makes
The claims and statistics of this paper haven’t been checked yet.
Run the check — free, no account needed. It reads the open-access text and checks the sources it cites.
Claims other papers make about this one
Each is checked against this paper’s own text: does it say what the citing paper says it does?
The cited source says what the claim attributes to it.
In the citing paper
“In [127], the Gaussian mixture model-based bearing fault band selection method is used to remove information indicative of bearing damage from the high-frequency band, but not informing about the type of damaged bearing component.”
From Fault Diagnosis and Fault-Tolerant Control of PMSM Drives–State of the Art and Future Challenges (2022) · cites this paper as [127]
Self-check
Percentages, sums and reported differences re-computed from the paper’s own numbers.
The self-check needs the paper’s full text.
Citations
Cites
A review on machinery diagnostics and prognostics implementing condition-based maintenance
Jardine, A. K. S., Lin, D., & Banjević, D. (2005) · Mechanical Systems and Signal Processing · doi:10.1016/j.ymssp.2005.09.012 · Cited by 4,861
Rolling element bearing diagnostics—A tutorial
Randall, R. B., & Antoni, J. (2010) · Mechanical Systems and Signal Processing · doi:10.1016/j.ymssp.2010.07.017 · Cited by 2,784
The Distance-Weighted k-Nearest-Neighbor Rule
Dudani, S. A. (1976) · IEEE Transactions on Systems Man and Cybernetics · doi:10.1109/tsmc.1976.5408784 · Cited by 1,480
Lessmeier, C., Kimotho, J. K., Zimmer, D., & Sextro, W. (2016) · PHM Society European Conference · doi:10.36001/phme.2016.v3i1.1577 · Cited by 1,421
Yin, S., Ding, S. X., Haghani, A., Hao, H., & Zhang, P. (2012) · Journal of Process Control · doi:10.1016/j.jprocont.2012.06.009 · Cited by 1,298
Sawalhı, N., Randall, R. B., & Endo, H. (2007) · Mechanical Systems and Signal Processing · doi:10.1016/j.ymssp.2006.12.002 · Cited by 623
Cause and analysis of stator and rotor failures in three-phase squirrel-cage induction motors
Bonnett, A. H., & Soukup, G. C. (1992) · IEEE Transactions on Industry Applications · doi:10.1109/28.148460 · Cited by 597
Application of an improved kurtogram method for fault diagnosis of rolling element bearings
Lei, Y., Lin, J., He, Z., & Zi, Y. (2011) · Mechanical Systems and Signal Processing · doi:10.1016/j.ymssp.2010.12.011 · Cited by 493
Shao, H., Xia, M., Han, G., Zhang, Y., & Wan, J. (2020) · IEEE Transactions on Industrial Informatics · doi:10.1109/tii.2020.3005965 · Cited by 471
Intelligent Bearing Fault Diagnosis Method Combining Compressed Data Acquisition and Deep Learning
Sun, J., Yan, C., & Wen, J. (2017) · IEEE Transactions on Instrumentation and Measurement · doi:10.1109/tim.2017.2759418 · Cited by 422
Heterogeneous Feature Models and Feature Selection Applied to Bearing Fault Diagnosis
Rauber, T. W., Boldt, F. D. A., & Varejão, F. M. (2014) · IEEE Transactions on Industrial Electronics · doi:10.1109/tie.2014.2327589 · Cited by 370
RUBINI, R., & MENEGHETTI, U. (2001) · Mechanical Systems and Signal Processing · doi:10.1006/mssp.2000.1330 · Cited by 323
Xu, G., Liu, M., Jiang, Z., Söffker, D., & Shen, W. (2019) · Sensors · doi:10.3390/s19051088 · Cited by 323
A comparison of some vibration parameters for the condition monitoring of rolling element bearings
Tandon, N. (1994) · Measurement · doi:10.1016/0263-2241(94)90033-7 · Cited by 197
Seera, M., Lim, C. P., Ishak, D., & Singh, H. (2011) · IEEE Transactions on Neural Networks and Learning Systems · doi:10.1109/tnnls.2011.2178443 · Cited by 187
A new distance-weighted k-nearest neighbor classifier
Gou, J., Du, L., Zhang, Y., & Xiong, T. (2012) · ANU Open Research (Australian National University) · Cited by 175
Application of statistical moments to bearing failure detection
Martin, H. R., & Honarvar, F. (1995) · Applied Acoustics · doi:10.1016/0003-682x(94)p4420-b · Cited by 170
Giantomassi, A., Ferracuti, F., Iarlori, S., Ippoliti, G., & Longhi, S. (2015) · IEEE Transactions on Industrial Electronics · doi:10.1109/tie.2014.2370936 · Cited by 168
Kang, M., Kim, J., Wills, L. M., & Kim, J.-M. (2015) · IEEE Transactions on Industrial Electronics · doi:10.1109/tie.2015.2460242 · Cited by 146
Self-citationLiu, X., Zhou, Q., Zhao, J. X., Shen, H., & Xiong, X. (2019) · Sensors · doi:10.3390/s19040972 · Cited by 136
Toma, R. N., & Kim, J.-M. (2020) · Applied Sciences · doi:10.3390/app10155251 · Cited by 135
Self-citationInduction Motor Fault Diagnosis
Karmakar, S., Chattopadhyay, S., Mitra, M., & Sengupta, S. (2016) · Power systems · doi:10.1007/978-981-10-0624-1 · Cited by 128
Lu, S., Wang, X., He, Q., Liu, F., & Liu, Y. (2016) · Journal of Sound and Vibration · doi:10.1016/j.jsv.2016.09.012 · Cited by 109
Bearing Fault Diagnosis Using Grad-CAM and Acoustic Emission Signals
Kim, J., & Kim, J.-M. (2020) · Applied Sciences · doi:10.3390/app10062050 · Cited by 79
Self-citationToma, R. N., Kim, C. H., & Kim, J.-M. (2021) · Electronics · doi:10.3390/electronics10111248 · Cited by 71
Self-citationRapur, J. S., & Tiwari, R. (2019) · Measurement · doi:10.1016/j.measurement.2019.07.037 · Cited by 68
Wang, C.-S., Kao, I.-H., & Perng, J. (2021) · Sensors · doi:10.3390/s21113608 · Cited by 68
Causes and failures classification of industrial electric motor
Bazurto, A. J., Quispe, E. C., & Mendoza, R. C. (2016) · IEEE ANDESCON · doi:10.1109/andescon.2016.7836190 · Cited by 67
New Statistical Moments for Diagnostics of Rolling Element Bearings
Honarvar, F., & Martin, H. R. (1997) · Journal of Manufacturing Science and Engineering · doi:10.1115/1.2831123 · Cited by 64
Condition Monitoring with Vibration Signals
Nandi, A. K., & Ahmed, H. (2019) · Wiley eBooks · doi:10.1002/9781119544678 · Cited by 63
López‐Estrada, F., Rotondo, D., & Valencia‐Palomo, G. (2019) · Processes · doi:10.3390/pr7110814 · Cited by 62
Tyagi, S., & Panigrahi, S. K. (2017) · Journal of Computational Design and Engineering · doi:10.1016/j.jcde.2017.05.002 · Cited by 52
Fault Diagnosis of Motor Bearings Based on a One-Dimensional Fusion Neural Network
Jian, X., Li, W., Guo, X., & Wang, R. (2019) · Sensors · doi:10.3390/s19010122 · Cited by 50
Bearing Fault Diagnosis by a Robust Higher-Order Super-Twisting Sliding Mode Observer
Piltan, F., & Kim, J.-M. (2018) · Sensors · doi:10.3390/s18041128 · Cited by 43
Self-citationA Diagnosis Method of Bearing and Stator Fault in Motor Using Rotating Sound Based on Deep Learning
Nakamura, H., Asano, K., Usuda, S., & Mizuno, Y. (2021) · Energies · doi:10.3390/en14051319 · Cited by 38
Effectiveness of new spectral tools in the anomaly detection of rolling element bearings
Piñeyro, J. J., Klempnow, A., & Lescano, V. (2000) · Journal of Alloys and Compounds · doi:10.1016/s0925-8388(00)00964-6 · Cited by 32
A Deep-Learning-Based Bearing Fault Diagnosis Using Defect Signature Wavelet Image Visualization
Duong, B. P., Kim, J. Y., Jeong, I.-K., Im, K., Kim, C. H., & Kim, J. M. (2020) · Applied Sciences · doi:10.3390/app10248800 · Cited by 31
Self-citationFault Diagnostic and Monitoring Methods of Induction Motor: A Review
Bhowmik, P. S., Pradhan, S., & Prakash, M. (2019) · doi:10.5281/zenodo.3364468 · Cited by 30
A Crack Characterization Method for Reinforced Concrete Beams Using an Acoustic Emission Technique
Habib, M. A., Kim, C. H., & Kim, J.-M. (2020) · Applied Sciences · doi:10.3390/app10217918 · Cited by 26
Self-citationOh, S., Han, S., & Jeong, J. (2021) · Applied Sciences · doi:10.3390/app11093963 · Cited by 26
Permanent Magnet Synchronous Machines
Eriksson, S. (2019) · Energies · doi:10.3390/en12142830 · Cited by 17
Nguyen, H. N., Kim, C. H., & Kim, J.-M. (2018) · Applied Sciences · doi:10.3390/app8112332 · Cited by 14
Self-citationHybrid Fault Diagnosis of Bearings: Adaptive Fuzzy Orthonormal-ARX Robust Feedback Observer
Piltan, F., & Kim, J.-M. (2020) · Applied Sciences · doi:10.3390/app10103587 · Cited by 13
Self-citationA Starting Method of Ship Electric Propulsion Permanent Magnet Synchronous Motor
Ji, Q., & Liu, S. (2011) · Procedia Engineering · doi:10.1016/j.proeng.2011.08.122 · Cited by 10
Synchronous Machine Faults Detection and Diagnosis for Electro-mechanical Actuators in Aeronautics
Vinson, G., Combacau, M., & Prado, T. (2012) · IFAC Proceedings Volumes · doi:10.3182/20120829-3-mx-2028.00119 · Cited by 5
Research works printed but not linked: 2
- Fitzgerald, A.E., Kingsley, C., and Umans, S.D. (2003). Electric Machinery, McGraw-Hill. [6th ed.].
- Esmael, 2013, A Statistical Feature-Based Approach for Operations Recognition in Drilling Time Series, Int. J. Comput. Inf. Syst. Ind. Manag. Appl., 5, 454
Cited by
Sorted by citations
Fault Diagnosis and Fault-Tolerant Control of PMSM Drives–State of the Art and Future Challenges
Orlowska-Kowalska, T., Wolkiewicz, M., Pietrzak, P., Skowron, M., Ewert, P., Tarchala, G., Krzysztofiak, M., & Kowalski, C. T. (2022) · IEEE Access · doi:10.1109/access.2022.3180153 · Cited by 328
Chaleshtori, A. E., & Aghaie, A. (2023) · Reliability Engineering & System Safety · doi:10.1016/j.ress.2023.109720 · Cited by 168
Ye, M., Yan, X., Hua, X., Jiang, D. L., Xiang, L., & Chen, N. (2024) · Expert Systems with Applications · doi:10.1016/j.eswa.2024.125214 · Cited by 145
Toma, R. N., Piltan, F., & Kim, J.-M. (2021) · Sensors · doi:10.3390/s21248453 · Cited by 60
Self-citationMultistage Centrifugal Pump Fault Diagnosis Using Informative Ratio Principal Component Analysis
Ahmad, Z., Nguyen, T.-K., Ahmad, S., Nguyen, C. D., & Kim, J.-M. (2021) · Sensors · doi:10.3390/s22010179 · Cited by 41
Self-citation
Metadata
- Authors
- Maliuk, A. S., Prosvirin, A. E., Ahmad, Z., Kim, C. H., & Kim, J.-M.
- Affiliations
- University of Ulsan (KR)
- Soongsil University (KR)
- Corresponding author
- Kim, Jong-Myon
- Venue
- Sensors
- Publisher
- MDPI AG
- Published
- 2021-10-01
- Volume
- 21
- Issue
- 19
- Pages
- 6579
- ISSN
- 1424-8220 (ISSN-L)
- PMC
- PMC8512720
- OpenAlex
- W3202586029
- Cited by
- 44
- References
- 47
- Citations by year
- 2026: 4 · 2025: 9 · 2024: 9 · 2023: 9 · 2022: 10 · 2021: 3
- FWCI
- 3.45
- Type
- journal article
- Language
- en
- Open access
- gold
- doi.org
- Licence
- Locations
- Sensors (publishedVersion, cc-by)
- PubMed Central (publishedVersion, cc-by)
- PubMed (publishedVersion)
- DOAJ (DOAJ: Directory of Open Access Journals) (submittedVersion, cc-by-sa)
- Funders
- Ministry of SMEs and Startups (S3106236)
- Topics
- Physical Sciences › Engineering › Control and Systems Engineering › Machine Fault Diagnosis Techniques
- Physical Sciences › Engineering › Control and Systems Engineering › Fault Detection and Control Systems
- Physical Sciences › Engineering › Mechanical Engineering › Gear and Bearing Dynamics Analysis
- Keywords
- bearing fault diagnosis, Gaussian mixture model, feature extraction, vibration signal processing, fault classification
About these checks
Registry, retraction, Cites and statistics results are computed, not judged, with one exception: a printed reference that no index lists is read once by a model before it counts as a citation error. Claims are extracted by a model and kept only when their quote appears verbatim in the text; each cited source is then checked, with a model’s help, for whether it says what the claim relies on. Those verdicts can be wrong — read the claim’s quote and the cited source before relying on one.
Statistics and arithmetic are recomputed, not judged.
Confidence bands are shown only for fields calibrated on our annotated test set. None is calibrated yet, so no band is shown.
What counts as a claim ›How we measure confidence ›How we check this ›
Are you an author, or do you see a problem with this page? Request a review
