

The DOI matches its Crossref record; 29 of the 29 references it cites were found in a registry or an index.
A Transformer-Based Bridge Structural Response Prediction Framework
Open accessAbstract
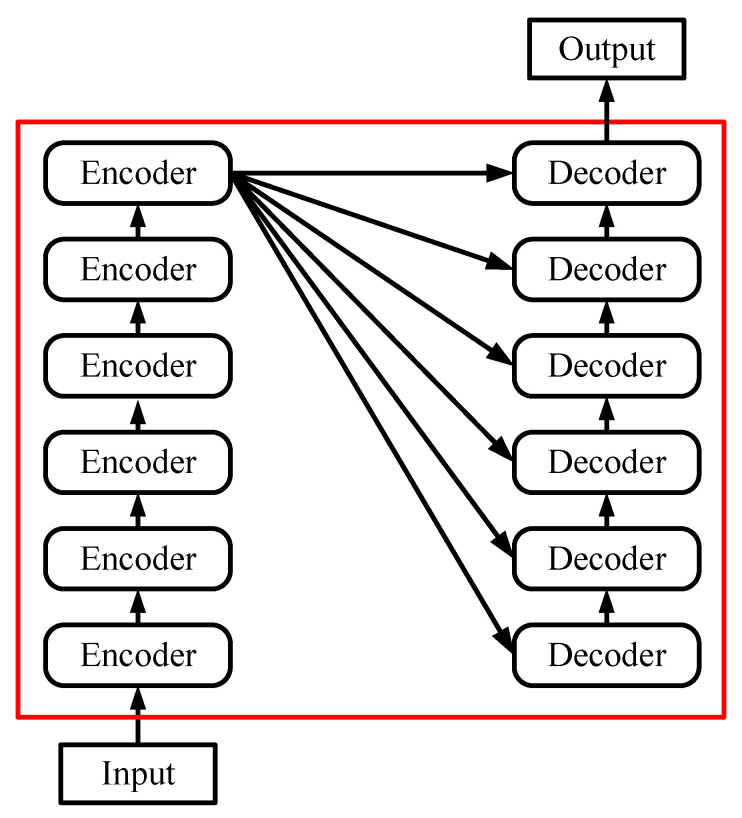
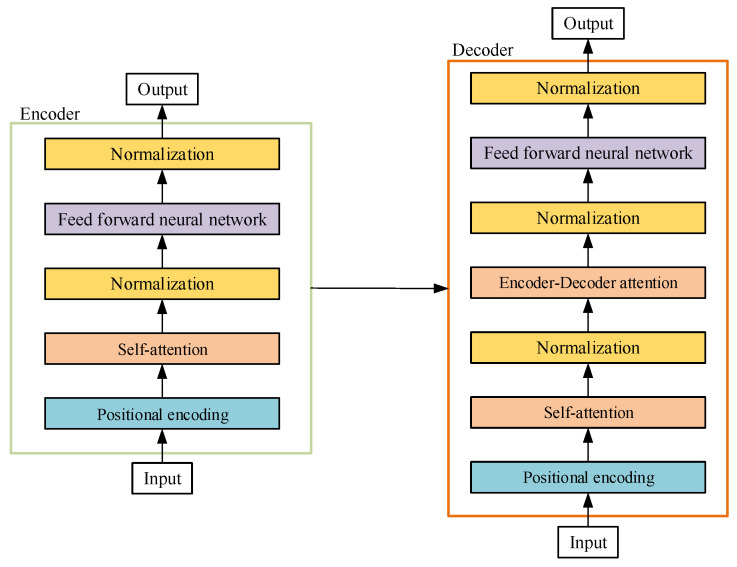
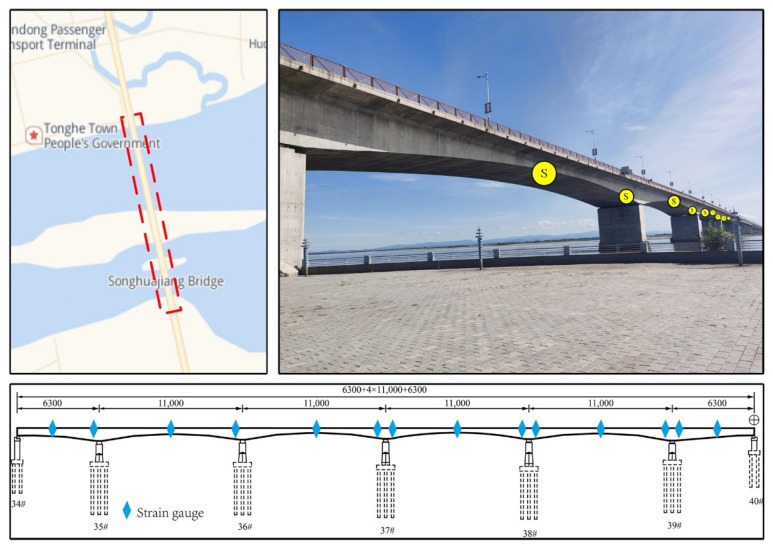
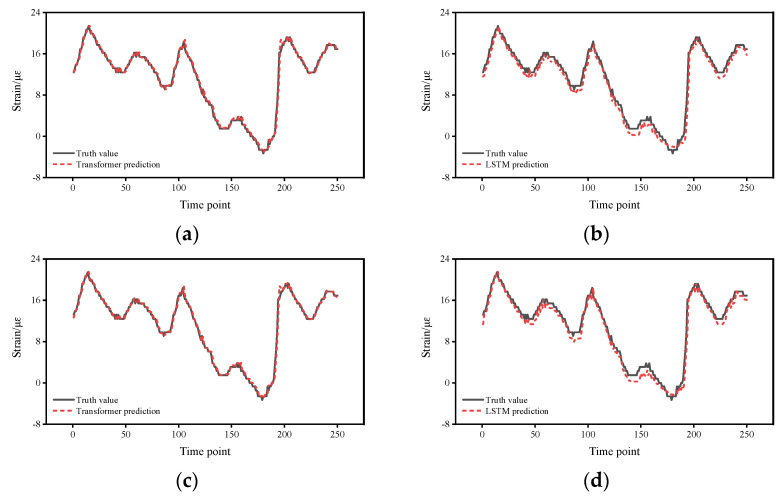
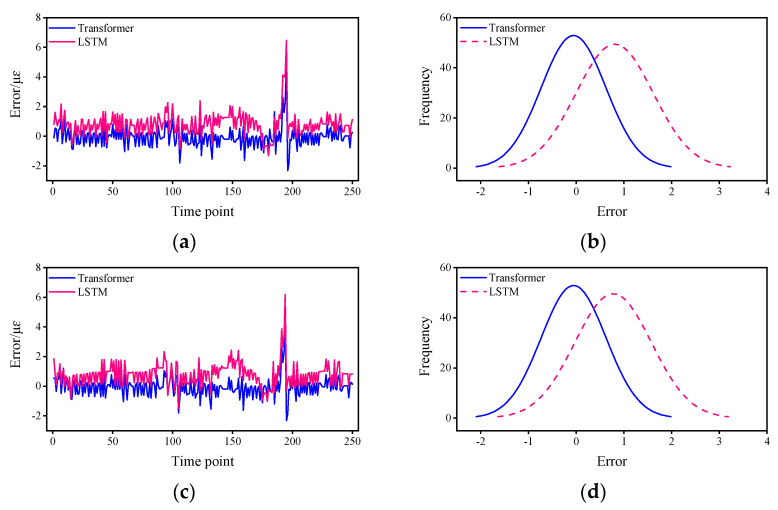
Structural response prediction with desirable accuracy is considerably essential for the health monitoring of bridges. However, it appears to be difficult in accurately extracting structural response features on account of complex on-site environment and noise disturbance, resulting in poor prediction accuracy of the response values. To address this issue, a Transformer-based bridge structural response prediction framework was proposed in this paper. The framework contains multi-layer encoder modules and attention modules that can precisely capture the history-dependent features in time-series data. The effectiveness of the proposed method was validated with the use of six-month strain response data of a concrete bridge, and the results are also compared with those of the most commonly used Long Short-Term Memory (LSTM)-based structural response prediction framework. The analysis indicated that the proposed method was effective in predicting structural response, with the prediction error less than 50% of the LSTM-based framework. The proposed method can be applied in damage diagnosis and disaster warning of bridges.
Overview
The claims and statistics of this paper haven’t been checked yet.
Free: it reads the open-access text and checks the first 5 claims that cite a source we can check. Create a free account to check every claim.
Integrity signals
Registry
Cites
Statistics
Figures
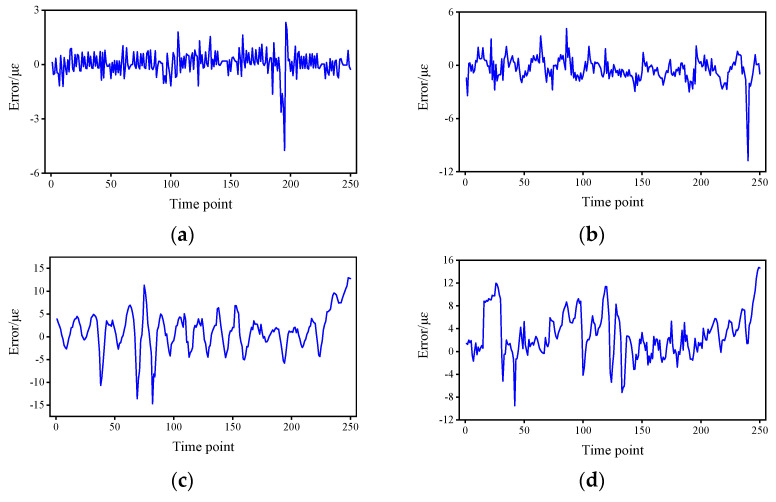
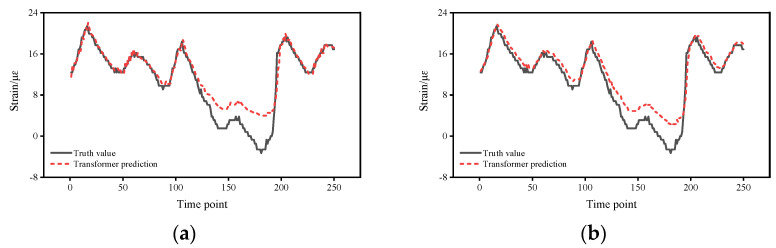
Verification
Claims the paper makes
The claims and statistics of this paper haven’t been checked yet.
Free: it reads the open-access text and checks the first 5 claims that cite a source we can check. Create a free account to check every claim.
Claims other papers make about this one
Each is checked against this paper’s own text: does it say what the citing paper says it does?
The cited source says what the claim attributes to it.
In the citing paper
“Li et al. [197] proposed a transformer-based time series prediction framework, verified by bridge strain data, and was found to have a more minor error than LSTM.”
From Deep Learning for Structural Health Monitoring: Data, Algorithms, Applications, Challenges, and Trends (2023) · cites this paper as [197]
Self-check
Percentages, sums and reported differences re-computed from the paper’s own numbers.
The self-check needs the paper’s full text.
Citations
Cites
Sequence to Sequence Learning with Neural Networks
Sutskever, I., Vinyals, O., & Le, Q. V. (2014) · arXiv · doi:10.48550/arxiv.1409.3215 · Cited by 17,766
Show, Attend and Tell: Neural Image Caption Generation with Visual Attention
Xu, K., Ba, J., Kiros, R., Cho, K., Courville, A., Salakhutdinov, R., Zemel, R., & Bengio, Y. (2015) · arXiv · doi:10.48550/arxiv.1502.03044 · Cited by 8,248
A practical Bayesian framework for backpropagation networks
MacKay, D. J. C. (1992) · Neural Computation · doi:10.1162/neco.1992.4.3.448 · Cited by 2,917 · cited 1×
“Early neural networks mainly refer to Back Propagation (BP) neural networks [10], and these networks were used in areas such as predicting financial markets [11,12], electrical loads [13–15], and traffic accidents [16,17].”
MethodRecurrent Models of Visual Attention
Mnih, V., Heess, N., Graves, A., & Kavukcuoglu, K. (2014) · arXiv (Cornell University) · doi:10.48550/arxiv.1406.6247 · Cited by 2,568 · cited 1×
“Attention Mechanism Attention mechanisms [27] have been widely used in various areas of deep learning in recent years, and is easily encountered in various different types of tasks, be it image processing, speech recognition, or natural language processing.”
BackgroundTraffic Accident’s Severity Prediction: A Deep-Learning Approach-Based CNN Network
Zheng, M., Li, T., Zhu, R., Chen, J., Ma, Z., Tang, M., Cui, Z., & Wang, Z. (2019) · IEEE Access · doi:10.1109/access.2019.2903319 · Cited by 194 · cited 1×
“Early neural networks mainly refer to Back Propagation (BP) neural networks [10], and these networks were used in areas such as predicting financial markets [11,12], electrical loads [13–15], and traffic accidents [16,17].”
MethodMulti-Head Attention with Disagreement Regularization
Li, J., Tu, Z., Yang, B., Lyu, M. R., & Zhang, T. (2018) · Proceedings of the 2018 Conference on Empirical Methods in Natural Language Processing · doi:10.18653/v1/d18-1317 · Cited by 190 · cited 1×
“Multi-Head Attention Multi-Head attention [31] provides multiple “representation subspaces” for an attention.”
BackgroundExploring the attention mechanism in LSTM-based Hong Kong stock price movement prediction
Chen, S., & Ge, L. (2019) · Quantitative Finance · doi:10.1080/14697688.2019.1622287 · Cited by 177 · cited 1×
“With the rise of deep learning, deep learning networks have shown good performance in speech recognition and image processing [18–20], and LSTM is considered to be the best network model for processing time-series data [21,22].”
BackgroundStructural Health Monitoring Based on Vehicle-Bridge Interaction: Accomplishments and Challenges
Zhu, X. Q., & Law, S. S. (2015) · Advances in Structural Engineering · doi:10.1260/1369-4332.18.12.1999 · Cited by 164
Crack detection using fusion features‐based broad learning system and image processing
Zhang, Y., & Yuen, K. (2021) · Computer-Aided Civil and Infrastructure Engineering · doi:10.1111/mice.12753 · Cited by 138
Positional Encoding to Control Output Sequence Length
Takase, S., & Okazaki, N. (2019) · Conference of the North American Chapter of the Association for Computational Linguistics: Human Language Technologies (NAACL-HLT) · doi:10.18653/v1/n19-1401 · Cited by 127 · cited 1×
“Positional Encoding Since there is no loop nor convolutional structure in the Transformer, in order for the model to be able to utilize the order of the sequence, it is necessary to insert some information that can represent the relative or absolute position in the sequence [30].”
Method
Research works printed but not linked: 2
- Hartono, A.M., and Ahmad, M. (2018, January 4–5). Sadikin, Comparison methods of short term electrical load forecasting. Proceedings of the 1st International Conference on Industrial, Electrical and Electronics (ICIEE), Anyer, Indonesia.
- Vaswani, A., Shazeer, N., Parmar, N., Uszkoreit, J., Jones, L., Gomez, A.N., Kaiser, Ł., and Polosukhin, I. (2017, January 4–9). Attention is all you need. Proceedings of the 31st Conference on Neural Information Processing Systems (NIPS 2017), Long Beach, CA, USA.
Cited by
Jia, J., & Li, Y. (2023) · Sensors · doi:10.3390/s23218824 · Cited by 182
“Li et al. [197] proposed a transformer-based time series prediction framework, verified by bridge strain data, and was found to have a more minor error than LSTM.”
ResultSigBERT: vibration-based steel frame structural damage detection through fine-tuning BERT
Honarjoo, A., Darvishan, E., Rezazadeh, H., & Kosarieh, A. H. (2024) · International Journal of Structural Integrity · doi:10.1108/ijsi-04-2024-0065 · Cited by 14
Tan, Z., Gou, H., Li, W., Ye, P., Wang, J., Pu, Q., & Bao, Y. (2025) · Structures · doi:10.1016/j.istruc.2025.110609 · Cited by 12
Song, Z., Tsang, S., Hsung, T.-C., Zhu, Y., & Lo, A. W.-L. (2025) · Forecasting · doi:10.3390/forecast7040055 · Cited by 13
“…demonstrated superior capabilities for capturing temporal dependencies in a wide range of sequential prediction, including framewise phoneme classification and neural machine translation, and have even been adapted to other kinds of applications, such as bridge structural response prediction [14].”
Djerrad, A., Zhou, Y. M., & Meng, S. (2025) · Engineering Structures · doi:10.1016/j.engstruct.2025.121051 · Cited by 9
Metadata
- Authors
- Li, Z., Li, D., & Sun, T.
- Affiliations
- Dalian University of Technology (CN)
- Corresponding author
- Li, Dongsheng
- Venue
- Sensors
- Publisher
- MDPI AG
- Published
- 2022-04-18
- Volume
- 22
- Issue
- 8
- Pages
- 3100
- ISSN
- 1424-8220 (ISSN-L)
- PMC
- PMC9029556
- OpenAlex
- W4224297949
- Cited by
- 34
- References
- 29
- Citations by year
- 2026: 13 · 2025: 18 · 2024: 1 · 2023: 1 · 2022: 1
- FWCI
- 2.36
- Type
- journal article
- Language
- en
- Open access
- gold
- doi.org
- Licence
- Locations
- Sensors (publishedVersion, cc-by)
- PubMed Central (publishedVersion, cc-by)
- PubMed (publishedVersion)
- DOAJ (DOAJ: Directory of Open Access Journals) (submittedVersion, cc-by-sa)
- Funders
- National Natural Science Foundation of China (Nos.51778104)
- Topics
- Physical Sciences › Engineering › Civil and Structural Engineering › Structural Health Monitoring Techniques
- Physical Sciences › Engineering › Civil and Structural Engineering › Structural Engineering and Materials Analysis
- Physical Sciences › Engineering › Civil and Structural Engineering › Infrastructure Maintenance and Monitoring
- Keywords
- transformer models, attention mechanism, bridge health monitoring, strain response, concrete bridges, time series forecasting, damage diagnosis, disaster warning, LSTM comparison
- MeSH terms
- Models, Theoretical, Electric Power Supplies
About these checks
Registry, retraction, Cites and statistics results are computed, not judged, with one exception: a printed reference that no index lists is read once by a model before it counts as a citation error. Claims are extracted by a model and kept only when their quote appears verbatim in the text; each cited source is then checked, with a model’s help, for whether it says what the claim relies on. Those verdicts can be wrong — read the claim’s quote and the cited source before relying on one.
Statistics and arithmetic are recomputed, not judged.
Confidence bands are shown only for fields calibrated on our annotated test set. None is calibrated yet, so no band is shown.
What counts as a claim ›How we measure confidence ›How we check this ›
Are you an author, or do you see a problem with this page? Request a review
How to cite
Cite CoChat for the checks on this page, and the paper for its own findings.
- This page
- CoChat. (2026). Citation check: A Transformer-Based Bridge Structural Response Prediction Framework. https://app.cochat.ai/papers/10.3390/s22083100
- The paper
- Li, Z., Li, D., & Sun, T. (2022). A Transformer-Based Bridge Structural Response Prediction Framework. Sensors. https://doi.org/10.3390/s22083100
Data sources
Bibliographic data: Semantic Scholar, OpenAlex, Crossref.
Contains information from the Semantic Scholar Academic Graph Datasets, made available under the ODC Attribution License (ODC-BY 1.0).
Semantic Scholar’s data is described in: Kinney, R., et al. (2023). The Semantic Scholar Open Data Platform. arXiv:2301.10140.
