

Integrating EEG and Machine Learning to Analyze Brain Changes during the Rehabilitation of Broca’s Aphasia
Open accessThe DOI matches its Crossref record; 37 of the 37 references it cites were found in a registry or an index.
Abstract
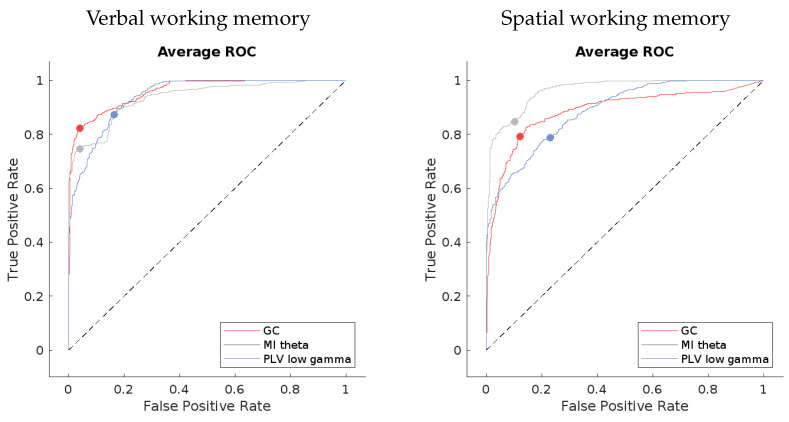
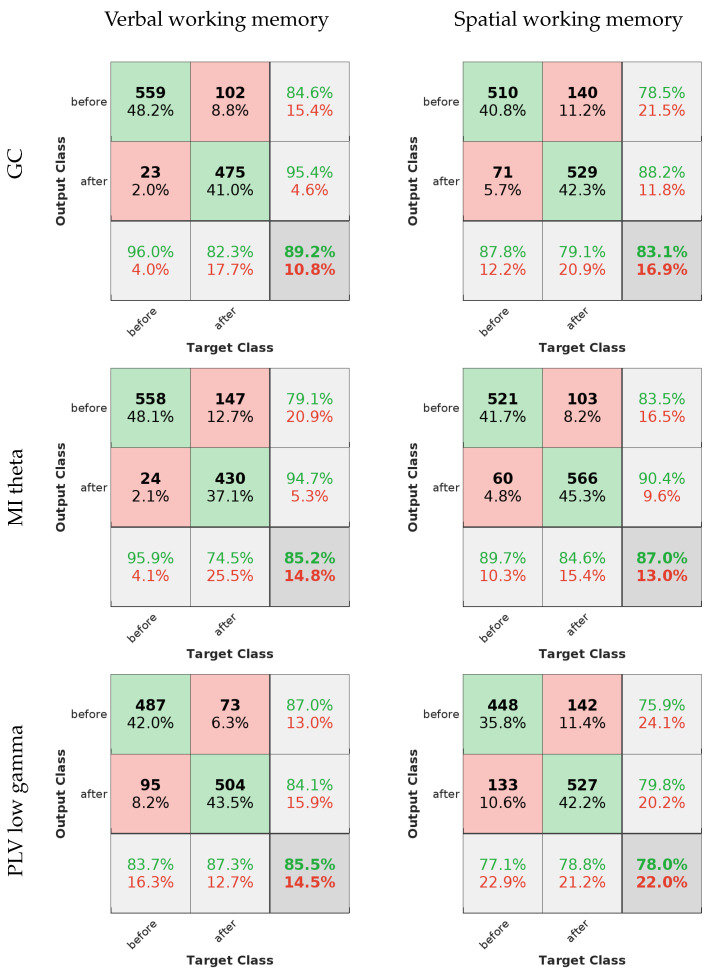
The fusion of electroencephalography (EEG) with machine learning is transforming rehabilitation. Our study introduces a neural network model proficient in distinguishing pre- and post-rehabilitation states in patients with Broca’s aphasia, based on brain connectivity metrics derived from EEG recordings during verbal and spatial working memory tasks. The Granger causality (GC), phase-locking value (PLV), weighted phase-lag index (wPLI), mutual information (MI), and complex Pearson correlation coefficient (CPCC) across the delta, theta, and low- and high-gamma bands were used (excluding GC, which spanned the entire frequency spectrum). Across eight participants, employing leave-one-out validation for each, we evaluated the intersubject prediction accuracy across all connectivity methods and frequency bands. GC, MI theta, and PLV low-gamma emerged as the top performers, achieving 89.4%, 85.8%, and 82.7% accuracy in classifying verbal working memory task data. Intriguingly, measures designed to eliminate volume conduction exhibited the poorest performance in predicting rehabilitation-induced brain changes. This observation, coupled with variations in model performance across frequency bands, implies that different connectivity measures capture distinct brain processes involved in rehabilitation. The results of this paper contribute to current knowledge by presenting a clear strategy of utilizing limited data to achieve valid and meaningful results of machine learning on post-stroke rehabilitation EEG data, and they show that the differences in classification accuracy likely reflect distinct brain processes underlying rehabilitation after stroke.
Overview
The claims and statistics of this paper haven’t been checked yet.
Free: it reads the open-access text and checks the first 5 claims that cite a source we can check. Create a free account to check every claim.
Integrity signals
Registry
Cites
Statistics
Figures


Verification
Claims the paper makes
The claims and statistics of this paper haven’t been checked yet.
Free: it reads the open-access text and checks the first 5 claims that cite a source we can check. Create a free account to check every claim.
Claims other papers make about this one
Each is checked against this paper’s own text: does it say what the citing paper says it does?
The source backs part of the claim, not all of it — or backs it for a different population, condition or comparison.
In the citing paper
“The analysis results showed that the machine learning algorithms used in post-stroke aphasia models were mainly supervised methods, including random forests, neural networks, and support vector machines.”
From Machine learning models in post-stroke aphasia: a scoping review (2026) · cites this paper as [25]
Experimental — accuracy not yet measuredThe cited source says what the claim attributes to it.
In the citing paper
“Twelve studies (19, 20, 22, 24, 25, 27–30, 33, 34, 37) mainly used accuracy, AUC, F1-score, precision, recall, and other indicators.”
From Machine learning models in post-stroke aphasia: a scoping review (2026) · cites this paper as [25]
The cited source says what the claim attributes to it.
In the citing paper
“Among the included studies, 18 (19–29, 31–37) employed supervised machine learning algorithms, including support vector machines, random forests, decision trees, logistic regression, and various neural networks (such as feedforward neural networks, convolutional neural networks, and recurrent neural networks).”
From Machine learning models in post-stroke aphasia: a scoping review (2026) · cites this paper as [25]
The cited source says what the claim attributes to it.
In the citing paper
“The models constructed in five studies (25, 27, 31, 33, 35) were mainly used to monitor or assess symptoms in stroke patients with aphasia.”
From Machine learning models in post-stroke aphasia: a scoping review (2026) · cites this paper as [25]
The cited source says what the claim attributes to it.
In the citing paper
“The other two studies (25, 33) used electroencephalogram indicators to evaluate the neural activity level.”
From Machine learning models in post-stroke aphasia: a scoping review (2026) · cites this paper as [25]
4 more claims about this paper
Create a free account to see every claim other papers make about this one.
Self-check
Percentages, sums and reported differences re-computed from the paper’s own numbers.
The self-check needs the paper’s full text.
Citations
Cites
An Information-Maximization Approach to Blind Separation and Blind Deconvolution
Bell, A. J., & Sejnowski, T. J. (1995) · Neural Computation · doi:10.1162/neco.1995.7.6.1129 · Cited by 8,986 · cited 1×
“We carried out the decomposition of data using the infomax ICA algorithm of Bell and Sejnowski [30] with the natural gradient feature of Amari, Cichocki, and Yang [31] and the extended ICA algorithm of Lee, Girolami, and Sejnowski [32].”
MethodHigh-speed scanning in human memory
Sternberg, S. (1966) · Science · doi:10.1126/science.153.3736.652 · Cited by 3,576 · cited 2×
“These patients underwent verbal and visuospatial working memory tasks both prior to and following their rehabilitation, as outlined by Sternberg [29] in Rutar Gorišek et al. [21].”
MethodWorld Stroke Organization (WSO): Global Stroke Fact Sheet 2022
Feigin, V. L., Brainin, M., Norrving, B., Martins, S., Sacco, R. L., Hacke, W., Fisher, M., Pandian, J., & Lindsay, P. (2022) · International Journal of Stroke · doi:10.1177/17474930211065917 · Cited by 2,979 · cited 3×
“Moreover, the significant majority of survivors are faced with substantial disability or dependency as a consequence [1].”
BackgroundLee, T.-W., Girolami, M., & Sejnowski, T. J. (1999) · Neural Computation · doi:10.1162/089976699300016719 · Cited by 1,967 · cited 1×
“We carried out the decomposition of data using the infomax ICA algorithm of Bell and Sejnowski [30] with the natural gradient feature of Amari, Cichocki, and Yang [31] and the extended ICA algorithm of Lee, Girolami, and Sejnowski [32].”
MethodA Tutorial Review of Functional Connectivity Analysis Methods and Their Interpretational Pitfalls
Bastos, A. M., & Schoffelen, J.-M. (2016) · Frontiers in Systems Neuroscience · doi:10.3389/fnsys.2015.00175 · Cited by 1,313 · cited 4×
“All measures based on phase lag can be used only with signals with a narrow frequency band, which is a limitation of the Hilbert transform [34] used to estimate the instantaneous signal phase angles.”
MethodResultInfluentialRedefining the role of Broca’s area in speech
Flinker, A., Korzeniewska, A., Shestyuk, A. Y., Franaszczuk, P. J., Dronkers, N. F., Knight, R. T., & Crone, N. E. (2015) · Proceedings of the National Academy of Sciences · doi:10.1073/pnas.1414491112 · Cited by 487 · cited 2×
“A distinctive set of post-stroke symptoms is encapsulated in Broca’s aphasia—a condition marked by impaired fluency in speech due to damage to Broca’s area, responsible for speech production [4].”
BackgroundHartwigsen, G., & Saur, D. (2019) · NeuroImage · doi:10.1016/j.neuroimage.2017.11.056 · Cited by 272 · cited 2×
“The process of rehabilitation and healing is associated with the structural changes of the brain via the generation of new white matter tracts, representing the establishment of new connections, and by the thickening and strengthening of previously existing, but weak connective fibers [7–12].”
BackgroundResultNeuroplasticity of Language Networks in Aphasia: Advances, Updates, and Future Challenges
Kiran, S., & Thompson, C. K. (2019) · Frontiers in Neurology · doi:10.3389/fneur.2019.00295 · Cited by 250 · cited 1×
“The process of recovery is a complex interplay of various factors and processes that the brain undergoes following a stroke [6,7].”
BackgroundInfluentialBrain networks and their relevance for stroke rehabilitation
Guggisberg, A. G., Koch, P. J., Hummel, F. C., & Buetefisch, C. M. (2019) · Clinical Neurophysiology · doi:10.1016/j.clinph.2019.04.004 · Cited by 245 · cited 1×
“…the recruitment of adjacent, functionally related areas to perform some of the functions of the damaged area; and the extensive reorganization of the information flow between functionally distinct areas of the brain, to compensate for impaired task-or specific function-related processing [9,13,14].”
BackgroundSennfält, S., Norrving, B., Petersson, J., & Ullberg, T. (2019) · Stroke · doi:10.1161/strokeaha.118.022913 · Cited by 203
Complex Pearson Correlation Coefficient for EEG Connectivity Analysis
Šverko, Z., Vrankić, M., Vlahinić, S., & Rogelj, P. (2022) · Sensors · doi:10.3390/s22041477 · Cited by 189 · cited 2×
“CPCC yields complex-valued results [35], where the absolute value absCPCC reflects the total connectivity, while imaginary component iCPCC reflects only the part that cannot be subjected to volume conduction effects.”
BackgroundMethodSelf-citationDynamics of language reorganization after left temporo-parietal and frontal stroke
Stockert, A., Wawrzyniak, M., Klingbeil, J., Wrede, K., Kümmerer, D., Hartwigsen, G., Kaller, C. P., Weiller, C., & Saur, D. (2020) · Brain · doi:10.1093/brain/awaa023 · Cited by 183 · cited 1×
“Gradually, the areas adjacent to the site of the stroke form their own network nodes and integrate into the reorganized interplay of networks that have, up to this point, compensated for the damage sustained by the stroke [4,7,15].”
BackgroundSpherical Splines and Average Referencing in Scalp Electroencephalography
Ferrée, T. C. (2006) · Brain Topography · doi:10.1007/s10548-006-0011-0 · Cited by 165 · cited 1×
“Spherical interpolation following the procedures in Feree was carried out [33].”
MethodCoherent neural oscillations predict future motor and language improvement after stroke
Nicolo, P., Rizk, S., Magnin, C., Pietro, M. D., Schnider, A., & Guggisberg, A. G. (2015) · Brain · doi:10.1093/brain/awv200 · Cited by 164 · cited 2×
“The next study is the one by Nicolo et al. [27], who used network measures of the coherence of resting EEG signals in the delta, theta, alpha, and beta bands, to explain the motor and language recovery of 24 patients in the period between 2–3 weeks after stroke and 3 months after stroke.”
ResultThe neural and neurocomputational bases of recovery from post-stroke aphasia
Stefaniak, J. D., Halai, A. D., & Lambon Ralph, M. A. (2020) · Nature Reviews Neurology · doi:10.1038/s41582-019-0282-1 · Cited by 162 · cited 1×
“…the recruitment of adjacent, functionally related areas to perform some of the functions of the damaged area; and the extensive reorganization of the information flow between functionally distinct areas of the brain, to compensate for impaired task-or specific function-related processing [9,13,14].”
BackgroundKelsen, B. A., Sumich, A., Kasabov, N., Liang, S. H. Y., & Wang, G. Y. (2022) · Neuroscience & Biobehavioral Reviews · doi:10.1016/j.neubiorev.2020.09.008 · Cited by 148 · cited 1×
“The theta band activity is associated with memory tasks and with speech production [39].”
BackgroundRecovery from aphasia in the first year after stroke
Wilson, S. M., Entrup, J. L., Schneck, S. M., Onuscheck, C. F., Levy, D. F., Rahman, M., Willey, E., Casilio, M., Yen, M., Brito, A. C., et al. (2023) · Brain · doi:10.1093/brain/awac129 · Cited by 141 · cited 4×
“The process of rehabilitation and healing is associated with the structural changes of the brain via the generation of new white matter tracts, representing the establishment of new connections, and by the thickening and strengthening of previously existing, but weak connective fibers [7–12].”
BackgroundInfluentialA Rehabilitation-Internet-of-Things in the Home to Augment Motor Skills and Exercise Training
Dobkin, B. H. (2017) · Neurorehabilitation and Neural Repair · doi:10.1177/1545968316680490 · Cited by 127 · cited 1×
“This potent combination facilitates a deeper understanding of brain activity, offers more precise predictions for recovery outcomes, and enables the personalization of treatment plans [37].”
Backgroundt-Test feature selection approach based on term frequency for text categorization
Wang, D., Zhang, H., Liu, R., Lv, W., & Wang, D. (2014) · Pattern Recognition Letters · doi:10.1016/j.patrec.2014.02.013 · Cited by 124 · cited 1×
“A similar approach was previously used by [36], to determine features for text categorization.”
MethodPeng, Y., Ngo, L., Hay, K. E., Alghamry, A., Colebourne, K. I., & Ranasinghe, I. (2022) · Stroke · doi:10.1161/strokeaha.121.038155 · Cited by 95 · cited 1×
“The mortality rate among those affected ranges from 20% to 50%, contingent on the stroke type and the accessibility of high-quality care [1–3].”
BackgroundTranslating concepts of neural repair after stroke: Structural and functional targets for recovery
Regenhardt, R. W., Takase, H., Lo, E. H., & Lin, D. J. (2020) · Restorative Neurology and Neuroscience · doi:10.3233/rnn-190978 · Cited by 83 · cited 1×
“Invariably, parts of the tissue die, resulting both in white matter loss, representing the loss of communication highways, and gray matter loss, representing the loss of activity-producing nodes in the brain [7–10].”
BackgroundVatinno, A. A., Simpson, A. N., Ramakrishnan, V., Bonilha, H. S., Bonilha, L., & Seo, N. J. (2022) · Neurorehabilitation and neural repair · doi:10.1177/15459683221078294 · Cited by 81 · cited 3×
“Machine learning is increasingly being applied in the field of stroke rehabilitation, particularly as a tool to personalize therapy and monitor progress [16–19].”
BackgroundMethodRecent developments in functional and structural imaging of aphasia recovery after stroke
Meinzer, M., Harnish, S., Conway, T., & Crosson, B. (2011) · Aphasiology · doi:10.1080/02687038.2010.530672 · Cited by 72
Cerasa, A., Tartarisco, G., Bruschetta, R., Ciancarelli, I., Morone, G., Calabrò, R. S., Pioggia, G., Tonin, P., & Iosa, M. (2022) · Biomedicines · doi:10.3390/biomedicines10092267 · Cited by 52
Billot, A., Lai, S., Varkanitsa, M., Braun, E. J., Rapp, B., Parrish, T. B., Higgins, J., Kurani, A. S., Caplan, D., Thompson, C. K., et al. (2022) · Stroke · doi:10.1161/strokeaha.121.036749 · Cited by 47 · cited 1×
“It has already been shown that brain connectivity is a reliable indicator of how the brain activity reorganizes after a stroke and subsequent rehabilitation [38].”
BackgroundPrognostic relevance of quantitative topographical EEG in patients with poststroke aphasia
Szelies, B., Mielke, R., Kessler, J., & Heiss, W. (2002) · Brain and Language · doi:10.1016/s0093-934x(02)00004-4 · Cited by 46 · cited 3×
“Looking at the studies of [27,28], we also find that the theta band can be an important predictor of rehabilitation, but the differences in our study designs and the analysis of EEG data preclude us from drawing further parallels between the results.”
BackgroundResultChiarelli, A. M., Croce, P., Assenza, G., Merla, A., Granata, G., Giannantoni, N. M., Pizzella, V., Tecchio, F., & Zappasodi, F. (2020) · International Journal of Neural Systems · doi:10.1142/s0129065720500677 · Cited by 33 · cited 3×
“When compared to the five related works that also use EEG data to either predict recovery from [23,26–28] or to detect aphasia [22], the present study explores more than one connectivity measure, while also providing a contrast to the EEG connectivity during a language-related working memory task…”
BackgroundMethodResultInfluentialLanzone, J., Motolese, F., Ricci, L., Tecchio, F., Tombini, M., Zappasodi, F., Cruciani, A., Capone, F., Lazzaro, V. D., & Assenza, G. (2023) · Neurological Sciences · doi:10.1007/s10072-023-06981-9 · Cited by 30 · cited 1×
“More broadly, a clinical focus article and a systematic review on the topic of the prediction of aphasia rehabilitation using neuroimaging and EEG reveal three further studies that can be compared to this one [24,25].”
BackgroundBeyond aphasia: Altered EEG connectivity in Broca’s patients during working memory task
Rutar, V., Isoski, V. I. Z., Belič, A., Manouilidou, C., Koritnik, B., Bon, J., Meglič, N. P., Vrabec, M., Žibert, J., Repovš, G., et al. (2016) · Brain and Language · doi:10.1016/j.bandl.2016.08.003 · Cited by 20 · cited 7×
“As for PLV, it has been previously demonstrated to effectively capture changes due to rehabilitation [20,21], which is consistent with our results.”
BackgroundMethodResultInfluentialAlterations to dual stream connectivity predicts response to aphasia therapy following stroke
Iyer, K. K., Angwin, A. J., van Hees, S., McMahon, K. L., Breakspear, M. J., & Copland, D. A. (2019) · Cortex · doi:10.1016/j.cortex.2019.12.017 · Cited by 18 · cited 4×
“In contrast, we use varied connectivity measures, possibly capturing several brain processes underlying rehabilitation, although on the level of the scalp, not in the source-reconstructed space, as in the work of Iyer et al. [26].”
MethodResultInfluentialAberrant beta-band brain connectivity predicts speech motor planning deficits in post-stroke aphasia
Sarmukadam, K., & Behroozmand, R. (2022) · Cortex · doi:10.1016/j.cortex.2022.07.001 · Cited by 14 · cited 2×
“…the recruitment of adjacent, functionally related areas to perform some of the functions of the damaged area; and the extensive reorganization of the information flow between functionally distinct areas of the brain, to compensate for impaired task-or specific function-related processing [9,13,14].”
BackgroundSarmukadam, K., & Behroozmand, R. (2023) · Cortex · doi:10.1016/j.cortex.2023.05.015 · Cited by 13 · cited 3×
“As for PLV, it has been previously demonstrated to effectively capture changes due to rehabilitation [20,21], which is consistent with our results.”
BackgroundResultKokkotis, C., Moustakidis, S., Giarmatzis, G., Γιαννακού, Ε., Makri, E., Sakellari, P., Tsiptsios, D., Karatzetzou, S., Christidi, F., Vadikolias, Κ., et al. (2022) · BioMed · doi:10.3390/biomed3010001 · Cited by 12
Detecting post-stroke aphasia using EEG-based neural envelope tracking of natural speechPreprint
Clercq, P. D., Kries, J., Mehraram, R., Vanthornhout, J., Francart, T., & Vandermosten, M. (2023) · medRxiv · doi:10.1101/2023.03.14.23287194 · Cited by 10 · cited 3×
“Clerq et al. [22] used a support vector machine to detect aphasia in EEG recordings of healthy subjects and individuals with aphasia.”
BackgroundResultZhang, J., Huang, Y., Ye, F., Yang, B., Li, Z., & Hu, X. (2022) · Applied Sciences · doi:10.3390/app12094796 · Cited by 7 · cited 1×
“Machine learning is increasingly being applied in the field of stroke rehabilitation, particularly as a tool to personalize therapy and monitor progress [16–19].”
MethodLassi, M., Bandini, A., Spina, V., Azzollini, V., Dalise, S., Mazzoni, A., Chisari, C., & Micera, S. (2023) · International IEEE/EMBS Conference on Neural Engineering · doi:10.1109/ner52421.2023.10123720 · Cited by 6
Shuster, L. (2018) · American Journal of Speech-Language Pathology · doi:10.1044/2018_ajslp-16-0180 · Cited by 5
Research works printed but not linked: 1
- Touretzky, D., Mozer, M., and Hasselmo, M. (1995). Advances in Neural Information Processing Systems, MIT Press.
Cited by
Wang, J., Zhao, J., Chen, X., Yin, B., Li, X., & Xie, P. (2025) · Frontiers in Aging Neuroscience · doi:10.3389/fnagi.2024.1485132 · Cited by 17
Liu, H., Meng, T., & Qie, R. (2025) · International Journal of Medical Informatics · doi:10.1016/j.ijmedinf.2025.106245 · Cited by 6
Sajovic, J., Drevenšek, G., Plut, A., Eberlinc, A., Vrabec, M. K., Lesjak, A. S., Selič-Zupančič, P., & Drevenšek, M. (2024) · iScience · doi:10.1016/j.isci.2024.110738 · Cited by 1
Self-citationMohapatra, B., & Bhattarai, B. (2025) · Aphasiology · doi:10.1080/02687038.2025.2586583 · Cited by 1
Machine learning models in post-stroke aphasia: a scoping review
Li, X., Song, H., Guo, N., Kang, C., Gong, X., Ji, X., & Zheng, J. (2026) · Frontiers in Neurology · doi:10.3389/fneur.2026.1806856
“The other two studies (25, 33) used electroencephalogram indicators to evaluate the neural activity level.”
Influential
Metadata
- Authors
- Močilnik, V., Rutar Gorišek, V., Sajovic, J., Pretnar Oblak, J., Drevenšek, G., & Rogelj, P.
- Affiliations
- University of Ljubljana (SI)
- University Medical Centre Ljubljana, 1000 Ljubljana, Slovenia
- Faculty of Medicine, University of Ljubljana, 1000 Ljubljana, Slovenia
- University of Primorska (SI)
- Corresponding author
- Sajovic, Jakob
- Venue
- Sensors
- Publisher
- MDPI AG
- Published
- 2024-01-05
- Volume
- 24
- Issue
- 2
- Pages
- 329
- ISSN
- 1424-8220 (ISSN-L)
- PMC
- PMC10818958
- OpenAlex
- W4390608048
- Cited by
- 8
- References
- 37
- Citations by year
- 2026: 3 · 2025: 3 · 2024: 2
- FWCI
- 1.94
- Type
- journal article
- Language
- en
- Open access
- gold
- doi.org
- Licence
- Locations
- Sensors (publishedVersion, cc-by)
- PubMed Central (publishedVersion, cc-by)
- PubMed (publishedVersion)
- DOAJ (DOAJ: Directory of Open Access Journals) (submittedVersion, cc-by-sa)
- Funders
- Javna Agencija za Raziskovalno Dejavnost RS (P3-0293, P5-0110, P3-0338)
- Topics
- Life Sciences › Neuroscience › Cognitive Neuroscience › EEG and Brain-Computer Interfaces
- Health Sciences › Medicine › Rehabilitation › Stroke Rehabilitation and Recovery
- Life Sciences › Neuroscience › Cognitive Neuroscience › Functional Brain Connectivity Studies
- Keywords
- Broca's aphasia, stroke rehabilitation, EEG, brain connectivity, Granger causality, phase locking value, weighted phase lag index, mutual information, working memory, volume conduction, gamma band, neural network classification
- MeSH terms
- Machine Learning, Aphasia, Brain, Electroencephalography, Humans, Memory, Short-Term
About these checks
Registry, retraction, Cites and statistics results are computed, not judged, with one exception: a printed reference that no index lists is read once by a model before it counts as a citation error. Claims are extracted by a model and kept only when their quote appears verbatim in the text; each cited source is then checked, with a model’s help, for whether it says what the claim relies on. Those verdicts can be wrong — read the claim’s quote and the cited source before relying on one.
Statistics and arithmetic are recomputed, not judged.
Confidence bands are shown only for fields calibrated on our annotated test set. None is calibrated yet, so no band is shown.
What counts as a claim ›How we measure confidence ›How we check this ›
Are you an author, or do you see a problem with this page? Request a review
Data sources
Bibliographic data: Semantic Scholar, OpenAlex, Crossref.
Contains information from the Semantic Scholar Academic Graph Datasets, made available under the ODC Attribution License (ODC-BY 1.0).
Semantic Scholar’s data is described in: Kinney, R., et al. (2023). The Semantic Scholar Open Data Platform. arXiv:2301.10140.
