

The DOI matches its Crossref record; the references it cites are not checked yet.
Concentration vs. Optical Density of ESKAPEE Bacteria: A Method to Determine the Optimum Measurement Wavelength
Open accessAbstract
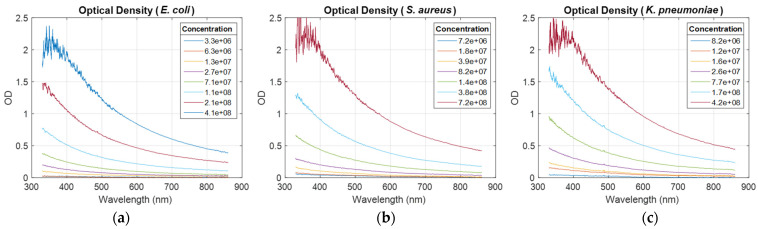
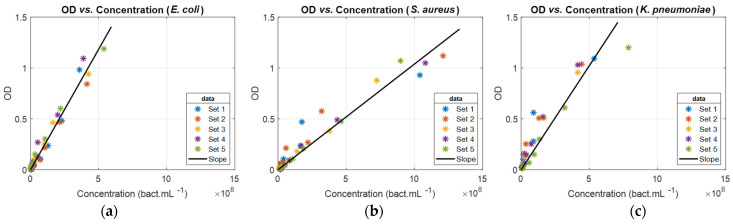
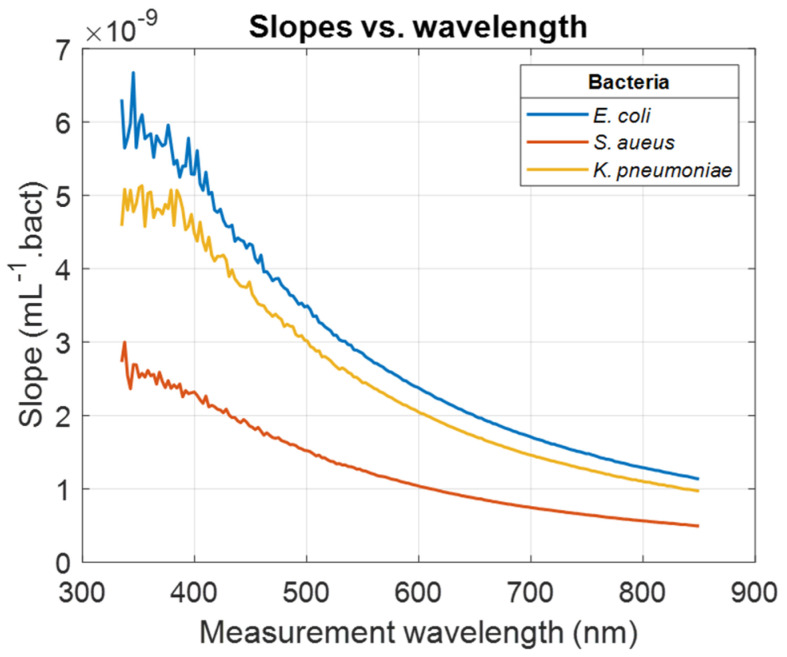
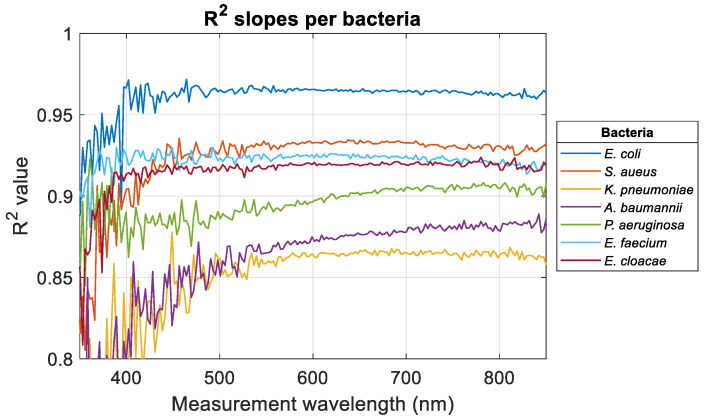
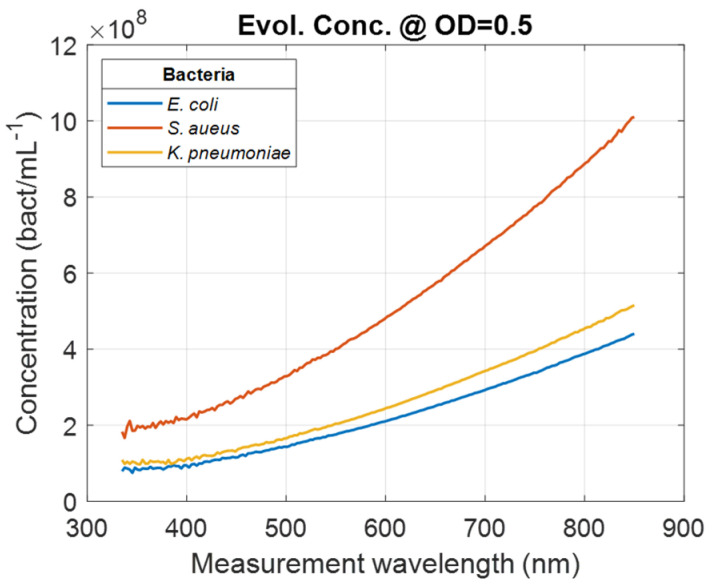
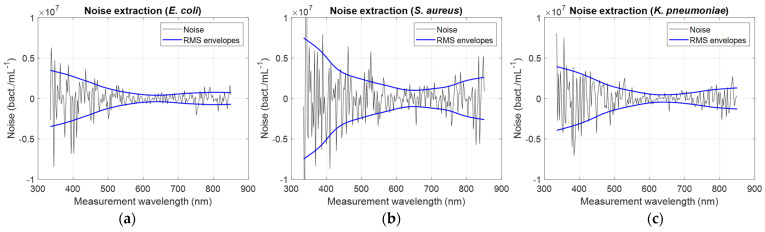
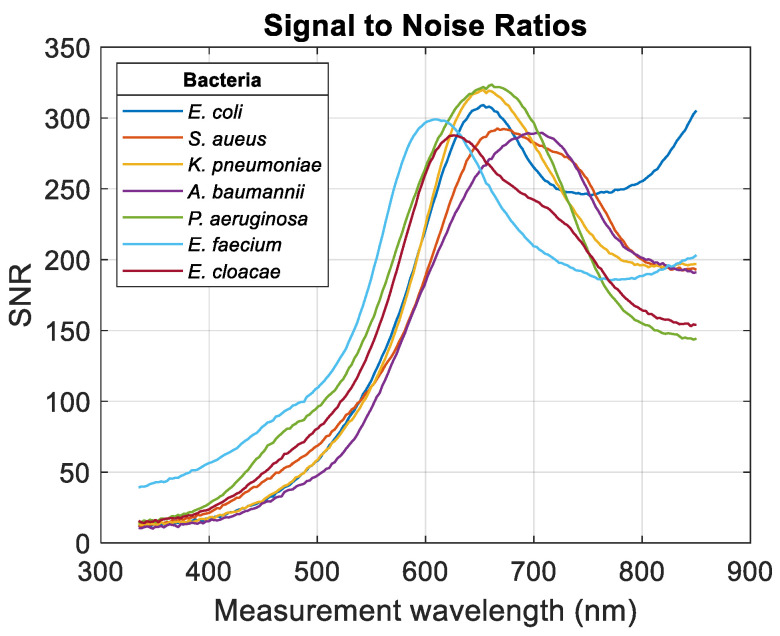
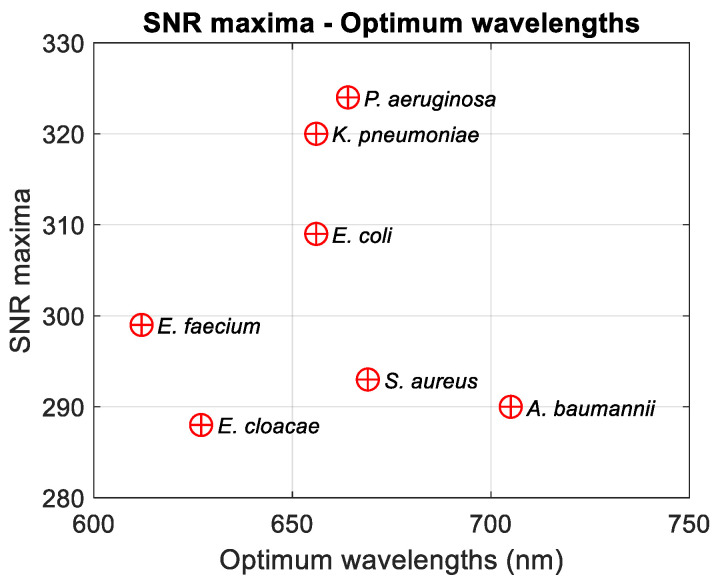
Optical density measurement has been used for decades to determine the microorganism concentration and more rarely for mammalian cells. Although this measurement can be carried out at any wavelength, studies report a limited number of measurement wavelengths, mainly around 600 nm, and no consensus seems to be emerging to propose an objective method for determining the optimum measurement wavelength for each microorganism. In this article, we propose a method for analyzing the absorbance spectra of ESKAPEE bacteria and determining the optimum measurement wavelength for each of them. The method is based on the analysis of the signal-to-noise ratio of the relationships between concentrations and optical densities when the measurement wavelength varies over the entire spectral range of the absorbance spectra measured for each bacterium. These optimum wavelengths range from 612 nm for Enterococcus faecium to 705 nm for Acinetobacter baumannii. The method can be directly applied to any bacteria, any culture method, and also to any biochemical substance with an absorbance spectrum without any particular feature such as an identified maximum.
Overview
The claims and statistics of this paper haven’t been checked yet.
Run the check — free, no account needed. It reads the open-access text and checks the sources it cites.
Integrity signals
Registry
Cites
Statistics
Figures
Verification
Claims the paper makes
The claims and statistics of this paper haven’t been checked yet.
Run the check — free, no account needed. It reads the open-access text and checks the sources it cites.
Claims other papers make about this one
Each is checked against this paper’s own text: does it say what the citing paper says it does?
The cited source doesn’t support the claim as written.
In the citing paper
“The data for 565 nm (in the green/yellow range) were chosen because this wavelength is commonly found to provide the optimum balance for detecting biomass while minimizing error from pigment variability”
From Quantitative Prediction of Spirulina platensis Biomass Using UV-Vis Spectrophotometry (2026) · cites this paper as Wacogne et al., 2024
Checked by a reasoning model — may be wrong.
Experimental — accuracy not yet measured
Self-check
Percentages, sums and reported differences re-computed from the paper’s own numbers.
The self-check needs the paper’s full text.
Citations
The citation lists are queued
They are fetched later and appear here then.
References 24 · Cited by 29
Research works printed but not linked: 24
- Keilin, 1925, On cytochrome, a respiratory pigment, common to animals, yeast, and higher plants, Proc. R. Soc. B, 98, 312
- Truong, 2021, Monitoring bacterial response to antibiotic and time growth using near-infrared spectroscopy combined with machine learning, Food Anal. Methods, 14, 1394, 10.1007/s12161-021-01994-6 · DOI
- Mager, 1956, Turbidity Changes in Bacterial Suspensions in relation to Osmotic Pressure, Microbiology, 14, 69
- Wacogne, B., Belinger-Podevin, M., Vaccari, N., Koubevi, C., Codjiova, C., Gutierrez, E., Bourgeois, P., Davoine, L., Robert-Nicoud, M., and Rouleau, A. (2023). Absorption/attenuation spectra description of ESKAPEE bacteria: Application to seeder-free culture monitoring, mammalian T-cell and bacteria mixture analysis and contamination description. Sensors, 23. · DOI
- Dalgaard, 1994, Estimation of bacterial growth rates from turbidimetric and viable count data, Int. J. Food Microbiol., 23, 391, 10.1016/0168-1605(94)90165-1 · DOI
- Lee, 2017, High-Speed “4D” Computational Microscopy of Bacterial Surface Motility, ACS Nano, 11, 9340, 10.1021/acsnano.7b04738 · DOI
- Shuler, M.L., and Kargi, F. (2002). Bioprocess Engineering: Basic Concepts, Prentice Hall PTR. [2nd ed.]. for example.
- Irwin, P., Martin, J., Nguyen, L.H., He, Y., Gerhing, A., and Chen, C.Y. (2010). Antimicrobial activity of spherical silver nanoparticles prepared using a biocompatible macromolecular capping agent: Evidence for induction of a greatly prolonged bacterial lag phase. J. Nanobiotechnol., 8. · DOI
- Praveen, P., Vaidya, A., Tutt, K., and Andrews, J. (2021). Assessing the potential of purple phototrophic microbial community for nitrogen recycling from ammonia-rich medium and anaerobic digestate. Bioresour. Technol., 320. · DOI
- Sari, 2019, Utilization of Rice Straw Hydrolysis Product of Penicillium sp. H9 as A Substrate of Biosurfactant Production by LII61 Hydrocarbonoclastic Bacteria, IOP Conf. Ser. Earth Environ. Sci., 217, 012028, 10.1088/1755-1315/217/1/012028 · DOI
- Kiani, 2023, Nitrogen and phosphate removal from dairy processing side-streams by monocultures or consortium of microalgae, J. Biotechnol., 361, 1, 10.1016/j.jbiotec.2022.11.011 · DOI
- Jacques, 2011, Fractal nature of light scattering in tissues, J. Innov. Opt. Health Sci., 4, 1, 10.1142/S1793545811001289 · DOI
- Yu, 2020, The alarming antimicrobial resistance in ESKAPEE pathogens: Can essential oils come to the rescue?, Fitoterapia, 140, 104433, 10.1016/j.fitote.2019.104433 · DOI
- Wacogne, B., Legrand, D., Pieralli, C., and Frelet-Barrand, A. (2020, January 24–26). Optical Spectroscopy for the Quality Control of ATMP fabrication: A new method to monitor cell expansion and to detect contaminations. Proceedings of the 13th International Joint Conference on Biomedical Engineering Systems and Technologies (BIOSTEC 2020)—BIODEVICES, Valletta, Malta. · DOI
- Wacogne, B., Vaccari, N., Koubevi, C., Belinger-Podevin, M., Robert-Nicoud, M., Rouleau, A., and Frelet-Barrand, A. (2022). Absorption Spectra Description for T-Cell Concentrations Determination and Simultaneous Measurements of Species during Co-Cultures. Sensors, 22. · DOI
- Kim, 2013, In vitro bactericidal effects of 625, 525, and 425 nm wavelength (red, green and blue) light-emitting diode irradiation, Photomed. Laser Surg., 31, 554, 10.1089/pho.2012.3343 · DOI
- Zhou, 2020, Detection of breast cancer-derived exosomes using the horseradish peroxidase-mimicking DNAzymes as an aptasensor, Analust, 145, 107, 10.1039/C9AN01653H · DOI
- Thorpe, 1990, BacT/Alert: An automated colorimetric microbial detection system, J. Clin. Microbiol., 28, 1608, 10.1128/jcm.28.7.1608-1612.1990 · DOI
- Kaya, 2021, Pathogen detection with electrochemical biosensors: Advantages, challenges and future perspectives, J. Electroanal. Chem., 882, 114989, 10.1016/j.jelechem.2021.114989 · DOI
- Khoshroo, 2022, Recent advances in electrochemical strategies for bacteria detection, Bioimpacts, 12, 567
- Ihssen, J., Jovanovic, N., Sirec, T., and Spitz, U. (2021). Real-time monitoring of extracellular ATP in bacterial cultures using thermostable luciferase. PLoS ONE, 16. · DOI
- Fricke, C., Harms, H., and Maskow, T. (2019). Rapid Calorimetric Detection of Bacterial Contamination: Influence of the Cultivation Technique. Front. Microbiol., 10. · DOI
- Karo, 2008, Bacteria detection by flow cytometry, Clin. Chem. Lab. Med., 46, 947, 10.1515/CCLM.2008.156 · DOI
- Allier, 2010, Bacteria detection with thin wetting film lensless imaging, Biomed. Opt. Express, 1, 762, 10.1364/BOE.1.000762 · DOI
Metadata
- Authors
- Wacogne, B., Belinger Podevin, M., Vaccari, N., Koubevi, C., Codjiová, C., Gutierrez, E., Davoine, L., Robert-Nicoud, M., Rouleau, A., & Frelet-Barrand, A.
- Affiliations
- Centre National de la Recherche Scientifique (FR)
- Institut FEMTO-ST, Université de Franche-Comté, CNRS, F-25000 Besançon, France
- Smaltis, Bioinnovation, Rue Charles Bried, 25030 Besançon, France
- Corresponding author
- Wacogne, Bruno
- Venue
- Sensors
- Publisher
- MDPI AG
- Published
- 2024-12-21
- Volume
- 24
- Issue
- 24
- Pages
- 8160
- ISSN
- 1424-8220 (ISSN-L)
- PMC
- PMC11679885
- OpenAlex
- W4405721350
- Cited by
- 29
- References
- 24
- Citations by year
- 2026: 18 · 2025: 11
- FWCI
- 7.85
- Type
- journal article
- Language
- en
- Open access
- gold
- doi.org
- Licence
- Locations
- Sensors (publishedVersion, cc-by)
- PubMed Central (publishedVersion, cc-by)
- PubMed (publishedVersion)
- HAL (submittedVersion, other-oa)
- DOAJ (DOAJ: Directory of Open Access Journals) (submittedVersion, cc-by-sa)
- Funders
- EU (DOS0060162/00, BFC000802)
- Topics
- Physical Sciences › Environmental Science › Waste Management and Disposal › Water Quality Monitoring and Analysis
- Life Sciences › Biochemistry, Genetics and Molecular Biology › Biophysics › Spectroscopy Techniques in Biomedical and Chemical Research
- Health Sciences › Medicine › Microbiology (medical) › Bacterial Identification and Susceptibility Testing
- Keywords
- optical density, optical absorption spectra, signal-to-noise ratio, bacterial concentration, Enterococcus faecium, Acinetobacter baumannii, spectrophotometry
- MeSH terms
- Bacteria, Enterococcus faecium, Acinetobacter baumannii, Signal-To-Noise Ratio
About these checks
Registry, retraction, Cites and statistics results are computed, not judged, with one exception: a printed reference that no index lists is read once by a model before it counts as a citation error. Claims are extracted by a model and kept only when their quote appears verbatim in the text; each cited source is then checked, with a model’s help, for whether it says what the claim relies on. Those verdicts can be wrong — read the claim’s quote and the cited source before relying on one.
Statistics and arithmetic are recomputed, not judged.
Confidence bands are shown only for fields calibrated on our annotated test set. None is calibrated yet, so no band is shown.
What counts as a claim ›How we measure confidence ›How we check this ›
Are you an author, or do you see a problem with this page? Request a review
How to cite
Cite CoChat for the checks on this page, and the paper for its own findings.
- This page
- CoChat. (2026). Citation check: Concentration vs. Optical Density of ESKAPEE Bacteria: A Method to Determine the Optimum Measurement Wavelength. https://app.cochat.ai/papers/10.3390/s24248160
- The paper
- Wacogne, B., Belinger Podevin, M., Vaccari, N., Koubevi, C., Codjiová, C., Gutierrez, E., Davoine, L., Robert-Nicoud, M., Rouleau, A., & Frelet-Barrand, A. (2024). Concentration vs. Optical Density of ESKAPEE Bacteria: A Method to Determine the Optimum Measurement Wavelength. Sensors. https://doi.org/10.3390/s24248160
