

The DOI matches its Crossref record; 65 of the 67 references it cites were found in a registry or an index.
Urban Heat Island’s Vulnerability Assessment by Integrating Urban Planning Policies: A Case Study of Montpellier Méditerranée Metropolitan Area, France
Open accessAbstract
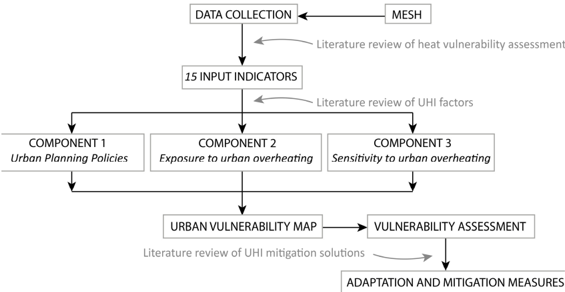
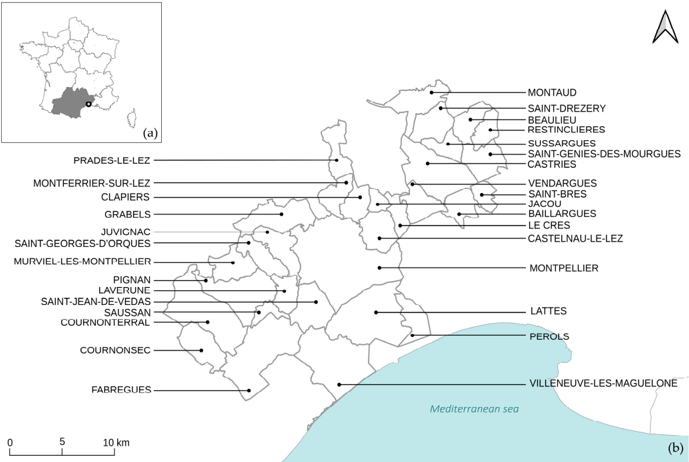
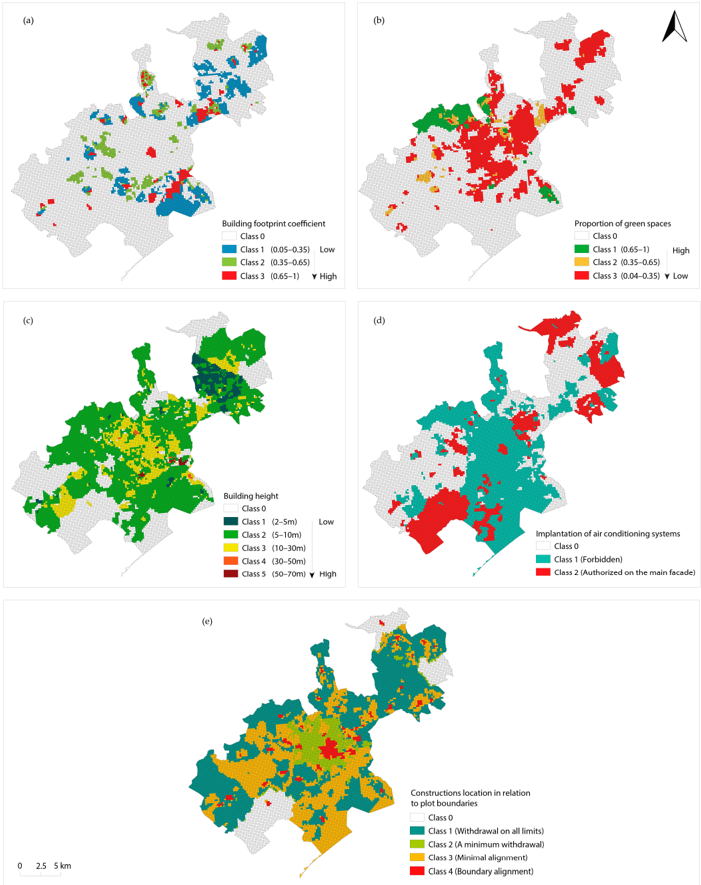
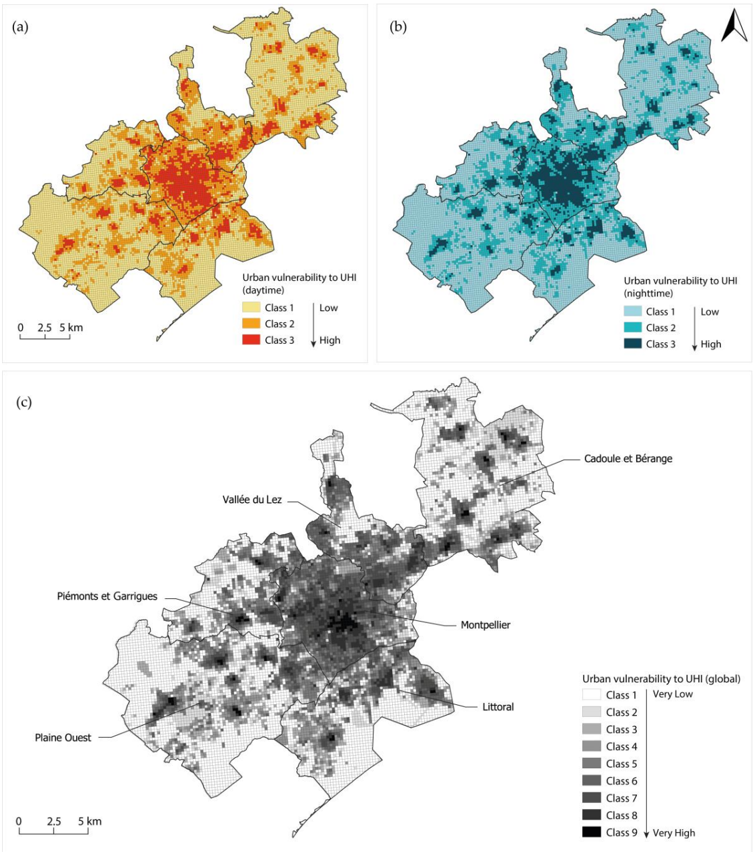
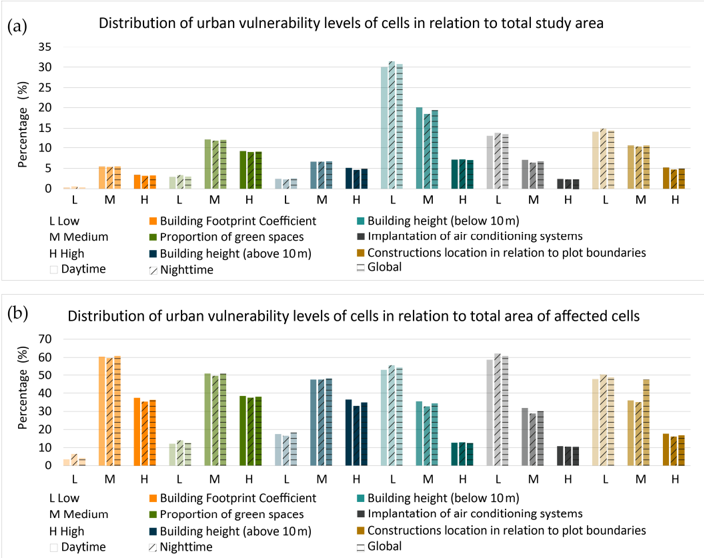
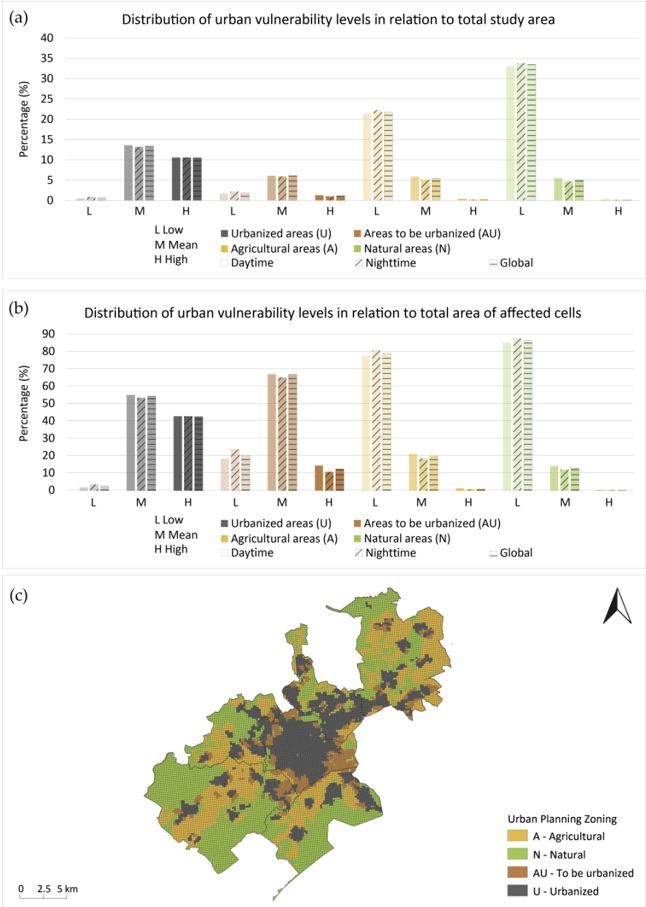
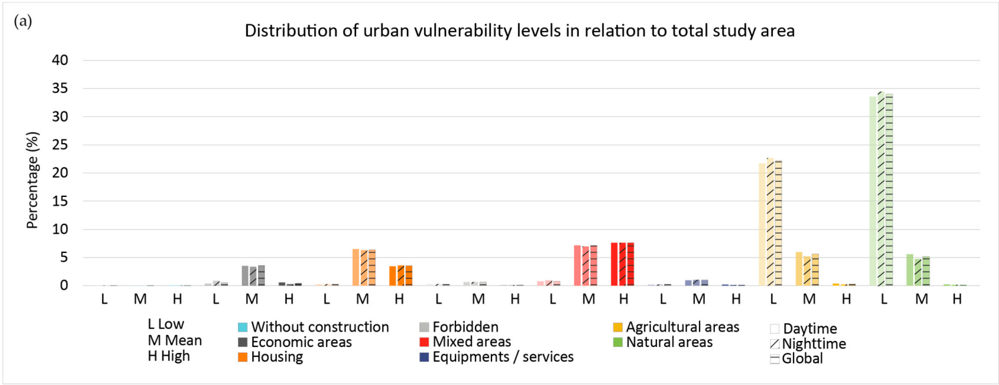
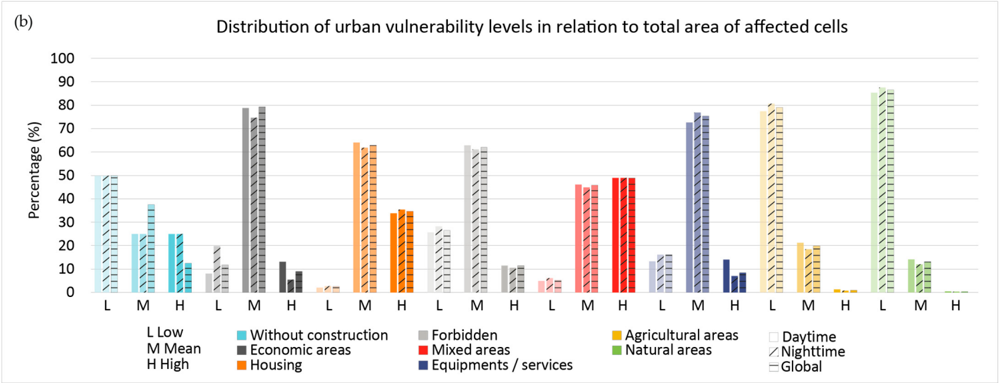
The energy balance differences between urban and rural areas give rise to a representative phenomenon of urban climate change called the urban heat island (UHI). The UHI phenomenon, which is exacerbated by global warming effects and urban expansion, exposes urban areas and populations to thermal stress and overheating. Therefore, measuring the intensity of UHI vulnerability is needed to mitigate its effects on health, comfort, energy consumption and infrastructure. Additionally, urban decision makers are looking for methodologies to identify the most vulnerable areas in urban planning. This research aims to investigate areas prone to urban overheating in Montpellier Mediterranean metropolitan area as a representative case study of the French urban planning context. The objective is to develop a methodology for assessing UHI vulnerability based on the interaction of exposure and sensitivity to urban planning policies. Accordingly, a set of fifteen indicators is developed to visualize urban planning policies, exposure and sensitivity to urban overheating. A statistical-based method is applied to determine the individual weights based on the indicators’ variance, which is calculated using principal component analysis (PCA). The spatial and urban planning distribution of vulnerability is then analyzed. The results indicate that the areas with the highest urban planning challenges are most vulnerable to UHI. In fact, the results reveal that these areas have urban planning characteristics likely to aggravate urban overheating. Therefore, this research proposes a methodology for integrating mitigation solutions into urban planning: increase in permeable and green areas; improvement of urban ventilation and heat exchange and decrease in anthropogenic heat generation. It demonstrates that combining urban planning policies with exposure and sensitivity is a new perspective for vulnerability studies. The findings of this study can be utilized by decision makers to better visualize areas susceptible to UHI and plan appropriate mitigation strategies.
Overview
The claims and statistics of this paper haven’t been checked yet.
Run the check — free, no account needed. It reads the open-access text and checks the sources it cites.
Integrity signals
Registry
Cites
Statistics
Figures
Verification
Claims the paper makes
The claims and statistics of this paper haven’t been checked yet.
Run the check — free, no account needed. It reads the open-access text and checks the sources it cites.
Claims other papers make about this one
Each is checked against this paper’s own text: does it say what the citing paper says it does?
In the citing paper
“Several recent studies have shown that vulnerability-oriented heat assessments benefit from integrating both social indicators and spatial characteristics of the urban fabric [34, 35].”
From GPU-Accelerated Deep Learning for Heatwave Prediction and Urban Heat Risk Assessment (2026) · cites this paper as [35]
In the citing paper
“In urban heat research, vulnerability is commonly associated with environmental, demographic, social, and urban-form characteristics that increase sensitivity or reduce coping capacity under hot conditions [33-35].”
From GPU-Accelerated Deep Learning for Heatwave Prediction and Urban Heat Risk Assessment (2026) · cites this paper as [35]
Self-check
Percentages, sums and reported differences re-computed from the paper’s own numbers.
The self-check needs the paper’s full text.
Citations
Cites
Climate Change 2014 Impacts, Adaptation, and Vulnerability
(IPCC), I. P. O. C. C. (2014) · Cambridge University Press eBooks · doi:10.1017/cbo9781107415379 · Cited by 14,964
Updated world map of the Köppen-Geiger climate classification
(2007) · doi:10.5194/hess-11-1633-2007 · Cited by 13,640
The energetic basis of the urban heat island
Oke, T. R. (1982) · Quarterly Journal of the Royal Meteorological Society · doi:10.1002/qj.49710845502 · Cited by 4,670
Local Climate Zones for Urban Temperature Studies
Stewart, I. D., & Oke, T. R. (2012) · Bulletin of the American Meteorological Society · doi:10.1175/bams-d-11-00019.1 · Cited by 4,548
A framework for vulnerability analysis in sustainability science
Turner, B. L., Kasperson, R. E., Matson, P. A., McCarthy, J. J., Corell, R. W., Christensen, L., Selin, N. E., Kasperson, J. X., Luers, A. L., Martello, M. L., et al. (2003) · Proceedings of the National Academy of Sciences · doi:10.1073/pnas.1231335100 · Cited by 4,378
Arnfield, A. J. (2003) · International Journal of Climatology · doi:10.1002/joc.859 · Cited by 3,543
Excess mortality related to the August 2003 heat wave in France
Fouillet, A., Rey, G., Laurent, F., Pavillon, G., Bellec, S., Guihenneuc-Jouyaux, C., Clavel, J., Jougla, E., & Hémon, D. (2006) · International Archives of Occupational and Environmental Health · doi:10.1007/s00420-006-0089-4 · Cited by 1,023
Santamouris, M. (2019) · Energy and Buildings · doi:10.1016/j.enbuild.2019.109482 · Cited by 1,016
Algorithm for Automated Mapping of Land Surface Temperature Using LANDSAT 8 Satellite Data
Avdan, U., & JOVANOVSKA, G. (2016) · Journal of Sensors · doi:10.1155/2016/1480307 · Cited by 858
Vegetation in the urban environment: microclimatic analysis and benefits
Dimoudi, A., & Nikolopoulou, M. (2002) · Energy and Buildings · doi:10.1016/s0378-7788(02)00081-6 · Cited by 721
Research works printed but not linked: 3
- Alonso, L. (2021). Intérêt de la Modélisation de la Température de l’air Associé à la Nécessité de la Caractérisation des Vulnérabilités Territoriales pour une Compréhension Systémique du Risque aux Fortes Chaleurs en Milieu Urbain sur Lyon et Tokyo. [Ph.D. Thesis, Jean Moulin Lyon III University].
- Athamena, K., Musy, M., and Bouyer, J. (2009, January 22–24). Proposal of indicators dedicated to the analysis of contribution of urban projects to urban Heat Island. Proceedings of the PLEA26—26th Conference on Passive and Low Energy Architecture, Quebec, QC, Canada.
- De Munck, C. (2013). Modélisation de la Végétation Urbaine et des Stratégies D’adaptation au Changement Climatique pour L’amélioration du Confort Climatique et de la Demande Energétique en Ville. [Ph.D. Thesis, Atmosphere and Continental Surface, Toulouse University].
Cited by
Sorted by citations
Assessing the effects of urban heat islands and air pollution on human quality of life
Cichowicz, R. A., & Bochenek, A. D. (2024) · Anthropocene · doi:10.1016/j.ancene.2024.100433 · Cited by 92
Combating urban heat: Systematic review of urban resilience and adaptation strategies
Fu, Q., Zheng, Z., Sarker, M. N. I., & Lv, Y. (2024) · Heliyon · doi:10.1016/j.heliyon.2024.e37001 · Cited by 80
Forceville, G., Lemonsu, A., Goria, S., Stempfelet, M., Host, S., Alessandrini, J.-M., Cordeau, E., & Pascal, M. (2023) · The Science of The Total Environment · doi:10.1016/j.scitotenv.2023.167476 · Cited by 44
Shen, P., Ji, Y., Li, Y., Wang, M., Cui, X., & Tong, H. (2025) · Energy and Buildings · doi:10.1016/j.enbuild.2025.115386 · Cited by 32
Muñoz-Pizza, D. M., Sánchez-Rodríguez, R., & Gonzalez-Manzano, E. (2023) · Urban Climate · doi:10.1016/j.uclim.2023.101674 · Cited by 29
Metadata
- Authors
- Técher, M., Ait Haddou, H., & Aguejdad, R.
- Affiliations
- École Nationale Supérieure d'Architecture Montpellier (FR)
- LIFAM Laboratory, High School of Architecture (ENSAM), 34090 Montpellier, France
- Centre National de la Recherche Scientifique (FR)
- Corresponding author
- Técher, Magalie
- ORCID
- Aguejdad, Rahim
- Venue
- Sustainability
- Publisher
- MDPI AG
- Published
- 2023-01-18
- Volume
- 15
- Issue
- 3
- Pages
- 1820
- ISSN
- 2071-1050 (ISSN-L)
- OpenAlex
- W4317423772
- Cited by
- 29
- References
- 67
- Citations by year
- 2026: 7 · 2025: 10 · 2024: 7 · 2023: 5
- FWCI
- 2.42
- Type
- journal article
- Language
- en
- Open access
- gold
- doi.org
- Licence
- Locations
- Sustainability (publishedVersion, cc-by)
- HAL (submittedVersion, cc-by)
- RePEc: Research Papers in Economics (submittedVersion)
- Funders
- ADEME
- Ecological Transition Agency
- French Ministry of Culture
- Topics
- Physical Sciences › Environmental Science › Environmental Engineering › Urban Heat Island Mitigation
- Physical Sciences › Environmental Science › Environmental Engineering › Wind and Air Flow Studies
- Physical Sciences › Environmental Science › Global and Planetary Change › Land Use and Ecosystem Services
- Keywords
- urban heat island, urban planning policy, exposure and sensitivity, vulnerability indicators, urban overheating, heat mitigation strategies, green spaces, urban ventilation, anthropogenic heat, urban climate change
About these checks
Registry, retraction, Cites and statistics results are computed, not judged, with one exception: a printed reference that no index lists is read once by a model before it counts as a citation error. Claims are extracted by a model and kept only when their quote appears verbatim in the text; each cited source is then checked, with a model’s help, for whether it says what the claim relies on. Those verdicts can be wrong — read the claim’s quote and the cited source before relying on one.
Statistics and arithmetic are recomputed, not judged.
Confidence bands are shown only for fields calibrated on our annotated test set. None is calibrated yet, so no band is shown.
What counts as a claim ›How we measure confidence ›How we check this ›
Are you an author, or do you see a problem with this page? Request a review
