

The DOI matches its Crossref record.
Hepatotoxicity of Pyrrolizidine Alkaloid Compound Intermedine: Comparison with Other Pyrrolizidine Alkaloids and Its Toxicological Mechanism
Abstract
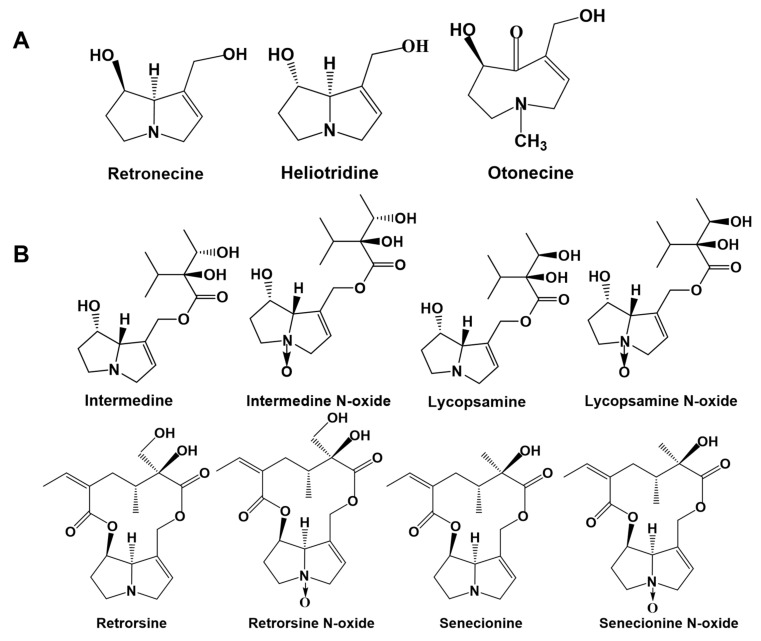
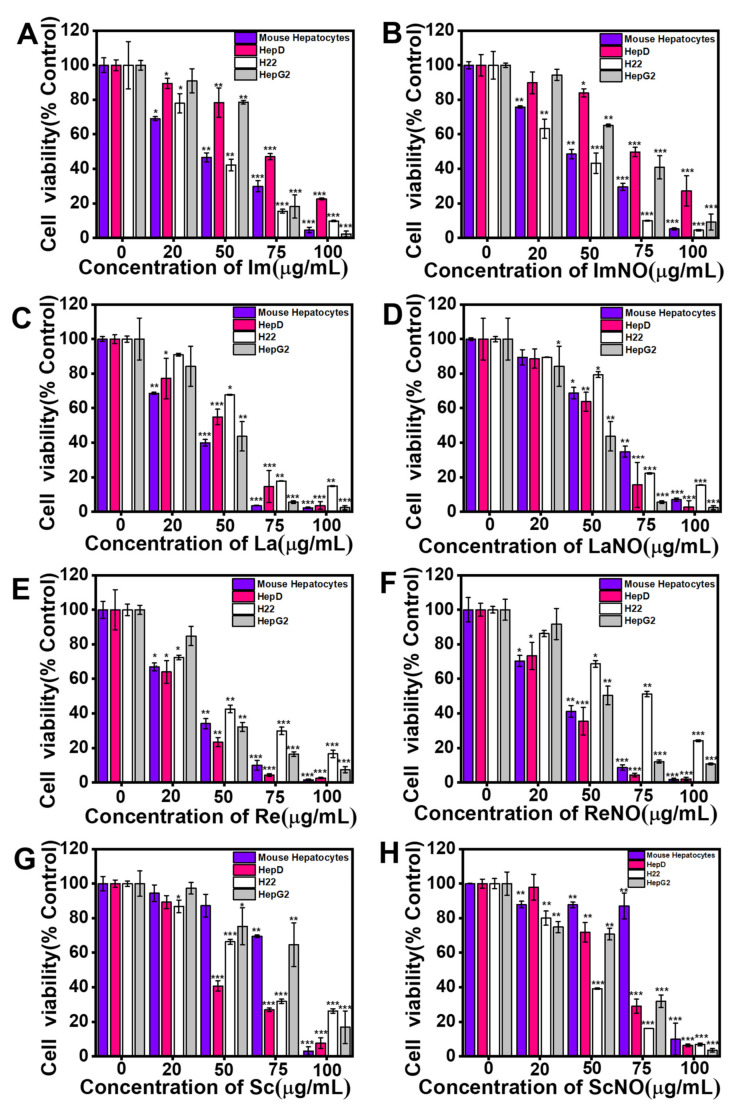
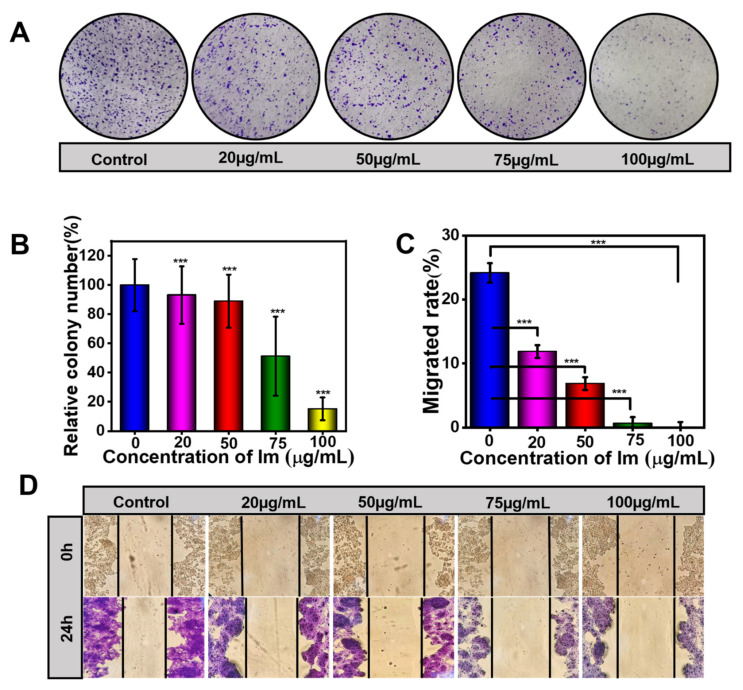
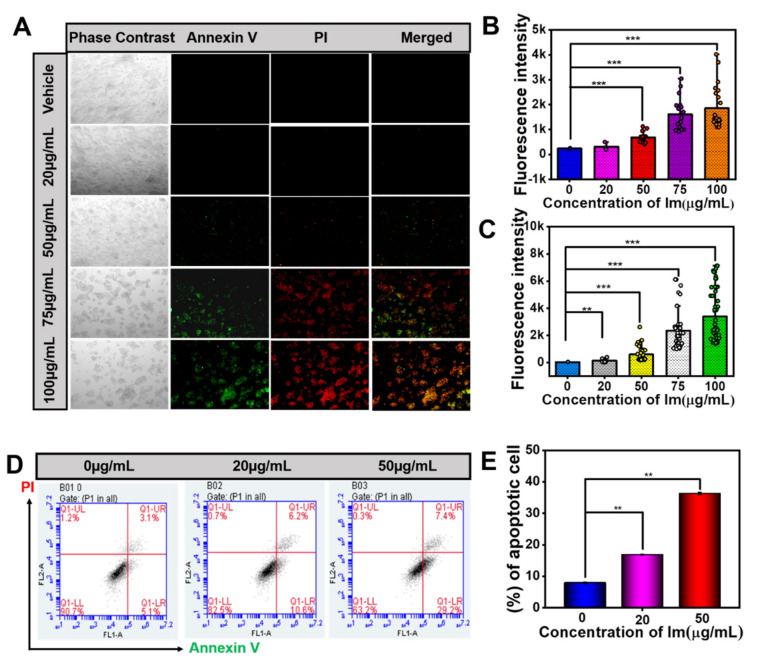
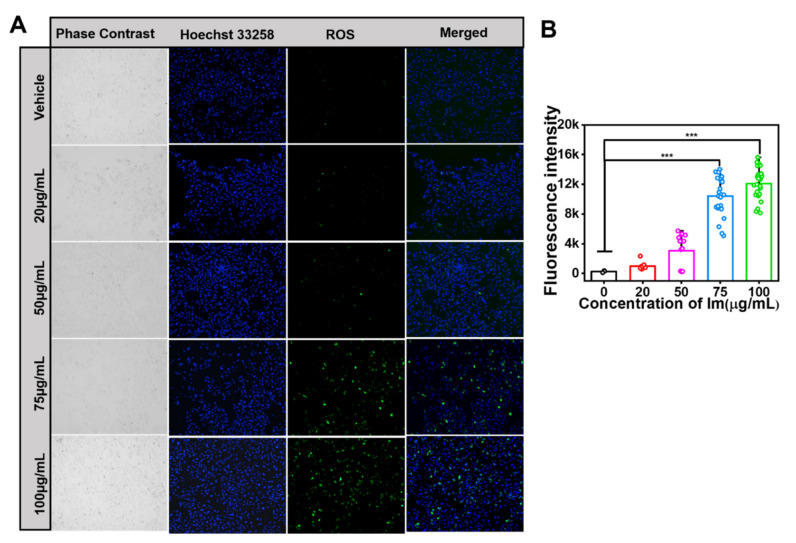
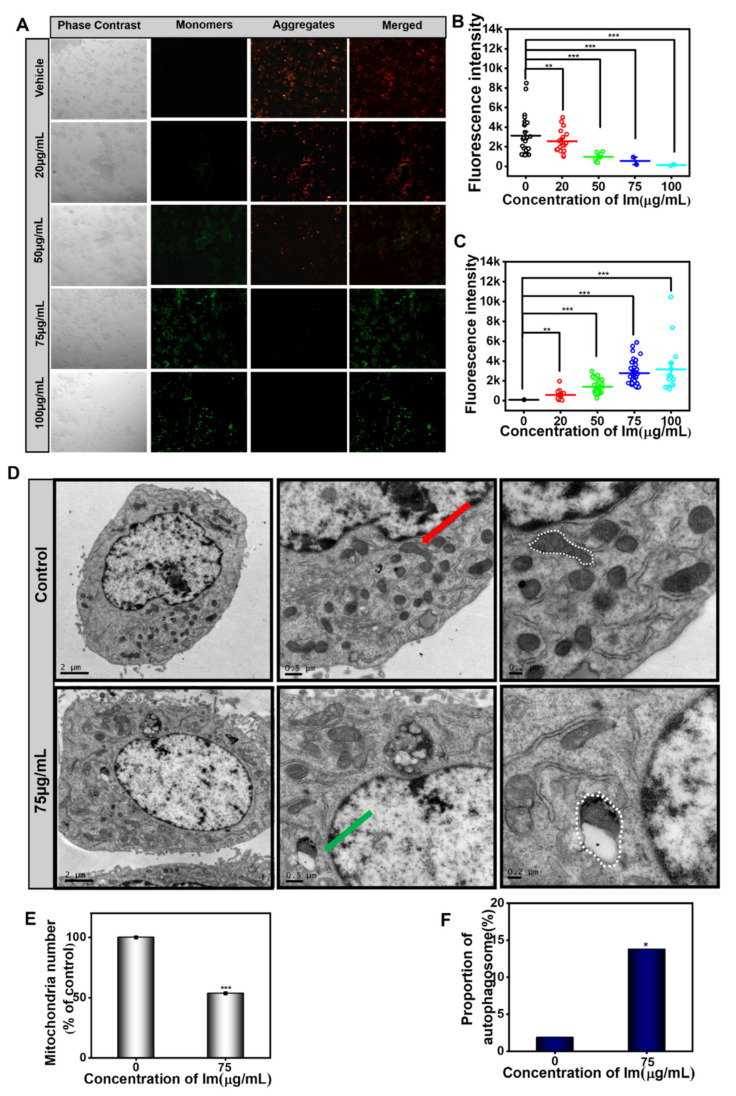
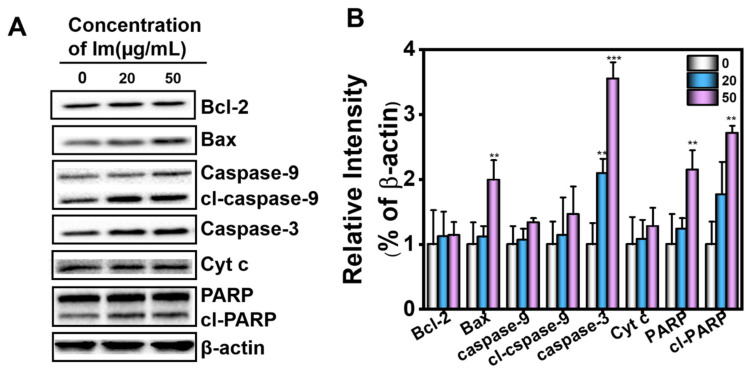
Pyrrolizidine alkaloids (PAs) are common secondary plant compounds with hepatotoxicity. The consumption of herbal medicines and herbal teas containing PAs is one of the main causes of hepatic sinusoidal obstruction syndrome (HSOS), a potentially life-threatening condition. The present study aimed to reveal the mechanism underlying the cytotoxicity of intermedine (Im), the main PA in Comfrey. We evaluated the toxicity of the retronecine-type PAs with different structures to cell lines derived from mammalian tissues, including primary mouse hepatocytes, human hepatocytes (HepD), mouse hepatoma-22 (H22) and human hepatocellular carcinoma (HepG2) cells. The cytotoxicity of Im to hepatocyte was evaluated by using cell counting kit-8 assay, colony formation experiment, wound healing assay and dead/live fluorescence imaging. In vitro characterization showed that these PAs were cytotoxic and induced cell apoptosis in a dose-dependent manner. We also demonstrated that Im induced cell apoptosis by generating excessive reactive oxygen species (ROS), changing the mitochondrial membrane potential and releasing cytochrome c (Cyt c) before activating the caspase-3 pathway. Importantly, we directly observed the destruction of the cell mitochondrial structure after Im treatment through transmission electron microscopy (TEM). This study provided the first direct evidence of Im inducing hepatotoxicity through mitochondria-mediated apoptosis. These results supplemented the basic toxicity data of PAs and facilitated the comprehensive and systematic evaluation of the toxicity caused by PA compounds.
Overview
The claims and statistics of this paper haven’t been checked yet.
Run the check — free, no account needed. It reads the open-access text and checks the sources it cites.
Integrity signals
Registry
Cites
Statistics
Figures
Verification
Claims the paper makes
The claims and statistics of this paper haven’t been checked yet.
Run the check — free, no account needed. It reads the open-access text and checks the sources it cites.
Claims other papers make about this one
Each is checked against this paper’s own text: does it say what the citing paper says it does?
In the citing paper
“Although the exact mechanism of PA-HSOS remains known, the destruction of hepatic sinusoidal endothelial cells in the liver acinus by toxic metabolites of PA and long persistence of PA metabolites especially pyrrole protein adducts in vivo may play an important role in the toxicity [86][87][88].”
From Chinese guideline for the diagnosis and treatment of drug-induced liver injury: an update (2024) · cites this paper as [86]
Self-check
Percentages, sums and reported differences re-computed from the paper’s own numbers.
The self-check needs the paper’s full text.
Citations
Cites
No references could be resolved yet.
Research works printed but not linked: 62
- Xu, 2019, Pyrrolizidine alkaloids: An update on their metabolism and hepatotoxicity mechanism, Liver Res., 3, 176, 10.1016/j.livres.2019.11.004 · DOI
- Yang, 2019, Pyrrolizidine alkaloids-induced hepatic sinusoidal obstruction syndrome: Pathogenesis, clinical manifestations, diagnosis, treatment, and outcomes, World J. Gastroenterol., 25, 3753, 10.3748/wjg.v25.i28.3753 · DOI · Paper page
- Helmy, 2006, Review article: Updates in the pathogenesis and therapy of hepatic sinusoidal obstruction syndrome, Aliment. Pharmacol. Ther., 23, 11, 10.1111/j.1365-2036.2006.02742.x · DOI
- Edgar, 2015, Pyrrolizidine Alkaloids: Potential Role in the Etiology of Cancers, Pulmonary Hypertension, Congenital Anomalies, and Liver Disease, Chem. Res. Toxicol., 28, 4, 10.1021/tx500403t · DOI
- Gunthardt, 2021, Retrospective HRMS Screening and Dedicated Target Analysis Reveal a Wide Exposure to Pyrrolizidine Alkaloids in Small Streams, Environ. Sci. Technol., 55, 1036, 10.1021/acs.est.0c06411 · DOI
- Yang, 2020, Absorption difference between hepatotoxic pyrrolizidine alkaloids and their N-oxides—Mechanism and its potential toxic impact, J. Ethnopharmacol., 249, 112421, 10.1016/j.jep.2019.112421 · DOI
- Hungerford, 2019, Pyrrolizidine Alkaloids of Blue Heliotrope (Heliotropium amplexicaule) and Their Presence in Australian Honey, J. Agric. Food Chem., 67, 7995, 10.1021/acs.jafc.9b02136 · DOI
- Fu, 2004, Pyrrolizidine Alkaloids—Genotoxicity, Metabolism Enzymes, Metabolic Activation, and Mechanisms, Drug Metab. Rev., 36, 1, 10.1081/DMR-120028426 · DOI
- Colegate, 2014, Profiling of Dehydropyrrolizidine Alkaloids and their N-Oxides in Herbarium-Preserved Specimens of Amsinckia Species Using HPLC-esi(+)MS, J. Agric. Food Chem., 62, 7382, 10.1021/jf500425v · DOI
- Hungerford, N., Carter, S., Anuj, S., Tan, B., Hnatko, D., Martin, C., Sharma, E., Yin, M., Nguyen, T., and Melksham, K. (2019). Analysis of Pyrrolizidine Alkaloids in Queensland Honey: Using Low Temperature Chromatography to Resolve Stereoisomers and Identify Botanical Sources by UHPLC-MS/MS. Toxins, 11. · DOI
- Han, 2022, Development, optimization, validation and application of ultra high performance liquid chromatography tandem mass spectrometry for the analysis of pyrrolizidine alkaloids and pyrrolizidine alkaloid N-oxides in teas and weeds, Food Control., 132, 108518, 10.1016/j.foodcont.2021.108518 · DOI
- Stegelmeier, B.L., Colegate, S.M., and Brown, A.W. (2016). Dehydropyrrolizidine Alkaloid Toxicity, Cytotoxicity, and Carcinogenicity. Toxins, 8. · DOI
- Wang, 2020, Seneciphylline, a main pyrrolizidine alkaloid in Gynura japonica, induces hepatotoxicity in mice and primary hepatocytes via activating mitochondria-mediated apoptosis, J. Appl. Toxicol., 40, 1534, 10.1002/jat.4004 · DOI
- Song, 2020, Pulmonary toxicity is a common phenomenon of toxic pyrrolizidine alkaloids, J. Environ. Sci. Health Part C, 38, 124, 10.1080/26896583.2020.1743608 · DOI
- Chou, 2003, Riddelliine N-oxide is a phytochemical and mammalian metabolite with genotoxic activity that is comparable to the parent pyrrolizidine alkaloid riddelliine, Toxicol. Lett., 145, 239, 10.1016/S0378-4274(03)00293-5 · DOI
- Liu, 2010, Pyrrolizidine alkaloid isoline-induced oxidative injury in various mouse tissues, Exp. Toxicol. Pathol., 62, 251, 10.1016/j.etp.2009.04.008 · DOI
- Yang, 2017, First evidence of pyrrolizidine alkaloid N-oxide-induced hepatic sinusoidal obstruction syndrome in humans, Arch. Toxicol., 91, 3913, 10.1007/s00204-017-2013-y · DOI
- Chen, L.H., Wang, J.C., Guo, Q.L., Qiao, Y., Wang, H.-J., Liao, Y.-H., Sun, D.-A., and Si, J.-Y. (2019). Simultaneous Determination and Risk Assessment of Pyrrolizidine Alkaloids in Artemisia capillaris Thunb. by UPLC-MS/MS Together with Chemometrics. Molecules, 24. · DOI
- Kerrie, 2004, Solid-Phase Extraction and LC−MS Analysis of Pyrrolizidine Alkaloids in Honeys, J. Agric. Food Chem., 52, 6664, 10.1021/jf049102p · DOI
- Waizenegger, 2018, Structure-dependent induction of apoptosis by hepatotoxic pyrrolizidine alkaloids in the human hepatoma cell line HepaRG: Single versus repeated exposure, Food Chem. Toxicol., 114, 215, 10.1016/j.fct.2018.02.036 · DOI
- Suparmi, 2020, Monocrotaline-induced liver toxicity in rat predicted by a combined in vitro physiologically based kinetic modeling approach, Arch. Toxicol., 94, 3281, 10.1007/s00204-020-02798-z · DOI
- Nakai, 2019, Pyruvate dehydrogenase activation precedes the down-regulation of fatty acid oxidation in monocrotaline-induced myocardial toxicity in mice, Hear. Vessel., 34, 545, 10.1007/s00380-018-1293-3 · DOI
- Dalefield, 2016, A 28-day oral toxicity study of echimidine and lasiocarpine in Wistar rats, Regul. Toxicol. Pharmacol., 81, 146, 10.1016/j.yrtph.2016.08.006 · DOI
- Ruan, 2014, Metabolic Activation of Pyrrolizidine Alkaloids: Insights into the Structural and Enzymatic Basis, Chem. Res. Toxicol., 27, 1030, 10.1021/tx500071q · DOI
- Gao, 2020, Structure-dependent hepato-cytotoxic potencies of selected pyrrolizidine alkaloids in primary rat hepatocyte culture, Food Chem. Toxicol., 135, 110923, 10.1016/j.fct.2019.110923 · DOI
- Rutz, 2020, Structure-dependent genotoxic potencies of selected pyrrolizidine alkaloids in metabolically competent HepG2 cells, Arch. Toxicol., 94, 4159, 10.1007/s00204-020-02895-z · DOI
- Geburek, 2020, In vitro biotransformation of pyrrolizidine alkaloids in different species: Part II—identification and quantitative assessment of the metabolite profile of six structurally different pyrrolizidine alkaloids, Arch. Toxicol., 94, 3759, 10.1007/s00204-020-02853-9 · DOI
- Ruan, 2015, Blood Pyrrole-Protein Adducts—A Biomarker of Pyrrolizidine Alkaloid-Induced Liver Injury in Humans, J. Environ. Sci. Health Part C, 33, 404, 10.1080/10590501.2015.1096882 · DOI
- Zheng, 2021, Toxic Prediction of Pyrrolizidine Alkaloids and Structure-Dependent Induction of Apoptosis in HepaRG Cells, Oxid. Med. Cell. Longev., 2021, 1, 10.1155/2021/8822304 · DOI
- Xiong, 2020, Protein cross-linking in primary cultured mouse hepatocytes by dehydropyrrolizidine alkaloids: Structure–toxicity relationship, Toxicon, 186, 4, 10.1016/j.toxicon.2020.07.015 · DOI
- Lu, 2018, The role of formation of pyrrole–ATP synthase subunit beta adduct in pyrrolizidine alkaloid-induced hepatotoxicity, Arch. Toxicol., 92, 3403, 10.1007/s00204-018-2309-6 · DOI
- Waizenegger, J., Glück, J., Henricsson, M., Luckert, C., Braeuning, A., and Hessel-Pras, S. (2021). Pyrrolizidine Alkaloids Disturb Bile Acid Homeostasis in the Human Hepatoma Cell Line HepaRG. Foods, 10. · DOI
- Brown, 2016, The comparative toxicity of a reduced, crude comfrey (Symphytum officinale) alkaloid extract and the pure, comfrey-derived pyrrolizidine alkaloids, lycopsamine and intermedine in chicks (Gallus gallus domesticus), J. Appl. Toxicol., 36, 716, 10.1002/jat.3205 · DOI
- Colegate, 2015, Pro-toxic dehydropyrrolizidine alkaloids in the traditional Andean herbal medicine “asmachilca”, J. Ethnopharmacol., 172, 179, 10.1016/j.jep.2015.06.012 · DOI
- Colegate, 2018, Potentially toxic pyrrolizidine alkaloids in Eupatorium perfoliatum and three related species. Implications for herbal use as boneset, Phytochem. Anal., 29, 613, 10.1002/pca.2775 · DOI
- Izcara, S., Casado, N., Morante-Zarcero, S., and Sierra, I. (2020). A Miniaturized QuEChERS Method Combined with Ultrahigh Liquid Chromatography Coupled to Tandem Mass Spectrometry for the Analysis of Pyrrolizidine Alkaloids in Oregano Samples. Foods, 9. · DOI
- Mei, 2010, Metabolism, Genotoxicity, and Carcinogenicity of Comfrey, J. Toxicol. Environ. Health Part B, 13, 509, 10.1080/10937404.2010.509013 · DOI
- European Food Safety Authority (2016). Dietary exposure assessment to pyrrolizidine alkaloids in the European population. EFSA J., 14, e04572. · DOI
- Huybrechts, 2015, Pyrrolizidine alkaloids in food and feed on the Belgian market, Food Addit. Contam. Part A, 32, 1939, 10.1080/19440049.2015.1086821 · DOI
- Liu, 2021, MicroRNA-26a inhibits cell proliferation and invasion by targeting FAM98A in breast cancer, Oncol. Lett., 21, 367, 10.3892/ol.2021.12628 · DOI
- Gluck, J., Waizenegger, J., Braeuning, A., and Hessel-Pras, S. (2020). Pyrrolizidine Alkaloids Induce Cell Death in Human HepaRG Cells in a Structure-Dependent Manner. Int. J. Mol. Sci., 22. · DOI
- Allemang, 2018, Relative potency of fifteen pyrrolizidine alkaloids to induce DNA damage as measured by micronucleus induction in HepaRG human liver cells, Food Chem Toxicol., 121, 72, 10.1016/j.fct.2018.08.003 · DOI
- Xie, 2007, Autophagosome formation: Core machinery and adaptations, Nat. Cell Biol., 9, 1102, 10.1038/ncb1007-1102 · DOI
- Klionsky, 2007, Autophagy: From phenomenology to molecular understanding in less than a decade, Nat. Rev. Mol. Cell Biol., 8, 931, 10.1038/nrm2245 · DOI
- Lu, 2013, Regulation and function of mitophagy in development and cancer, Autophagy, 9, 1720, 10.4161/auto.26550 · DOI
- Mathew, 2011, Autophagy in tumorigenesis and energy metabolism: Friend by day, foe by night, Curr. Opin. Genet. Dev., 21, 113, 10.1016/j.gde.2010.12.008 · DOI
- Yu, 2006, Autophagic programmed cell death by selective catalase degradation, Proc. Natl. Acad. Sci. USA, 103, 4952, 10.1073/pnas.0511288103 · DOI
- Gump, 2011, Autophagy and Apoptosis: What is the connection?, Trends Cell Biol., 21, 387, 10.1016/j.tcb.2011.03.007 · DOI
- Kolrep, 2018, In vitro biotransformation of pyrrolizidine alkaloids in different species. Part I: Microsomal degradation, Arch. Toxicol., 92, 1089, 10.1007/s00204-017-2114-7 · DOI
- Pan, 1993, Strain differences in the response of Fischer 344 and Sprague-Dawley rats to monocrotaline induced pulmonary vascular disease, Toxicol., 79, 21, 10.1016/0300-483X(93)90203-5 · DOI
- Ji, 2010, Pyrrolizidine alkaloid clivorine induced oxidative injury on primary cultured rat hepatocytes, Hum. Exp. Toxicol., 29, 303, 10.1177/0960327110361757 · DOI
- Godin, 2006, Species Differences in the in Vitro Metabolism of Deltamethrin and Esfenvalerate: Differential Oxidative and Hydrolytic Metabolism by Humans and Rats, Drug Metab. Dispos., 34, 1764, 10.1124/dmd.106.010058 · DOI
- Zhang, 2018, The Precise Diagnosis of Cancer Invasion/Metastasis via 2D Laser Ablation Mass Mapping of Metalloproteinase in Primary Cancer Tissue, ACS Nano, 12, 11139, 10.1021/acsnano.8b05584 · DOI
- Zhang, P., Yan, Y., Wang, J., Dong, X., Zhang, G., Zeng, Y., and Liu, Z. (2020). An Anti-Cancer Peptide LVTX-8 Inhibits the Proliferation and Migration of Lung Tumor Cells by Regulating Causal Genes’ Expression in p53-Related Pathways. Toxins, 12. · DOI
- Yang, 2016, Cytotoxicity of pyrrolizidine alkaloid in human hepatic parenchymal and sinusoidal endothelial cells: Firm evidence for the reactive metabolites mediated pyrrolizidine alkaloid-induced hepatotoxicity, Chem. Interact., 243, 119, 10.1016/j.cbi.2015.09.011 · DOI
- Begriche, 2011, Drug-induced toxicity on mitochondria and lipid metabolism: Mechanistic diversity and deleterious consequences for the liver, J. Hepatol., 54, 773, 10.1016/j.jhep.2010.11.006 · DOI
- Liu, J., Liu, Q., Han, J., Feng, J., Guo, T., Li, Z., Min, F., Jin, R., and Peng, X. (2021). N-Acetylcysteine Inhibits Patulin-Induced Apoptosis by Affecting ROS-Mediated Oxidative Damage Pathway. Toxins, 13. · DOI
- Onishi, 2021, Mitochondrial clearance: Mechanisms and roles in cellular fitness, FEBS Lett., 595, 1239, 10.1002/1873-3468.14060 · DOI
- Taylor, 2008, Apoptosis: Controlled demolition at the cellular level, Nat. Rev. Mol. Cell Biol., 9, 231, 10.1038/nrm2312 · DOI
- Lee, S.M., Kim, N.H., Jeong, E.J., and Rho, J.R. (2020). Cytotoxic 4-Hydroxyprorocentrolide and Prorocentrolide C from Cultured Dinoflagellate Prorocentrum lima Induce Human Cancer Cell Death through Apoptosis and Cell Cycle Arrest. Toxins, 12. · DOI
- Seglen, 1976, Chapter 4 Preparation of Isolated Rat Liver Cells, Methods Cell Biol., 13, 29, 10.1016/S0091-679X(08)61797-5 · DOI
- Yan, 2016, The inducing differentiation effect of two dimethyl sulfoxide (DMSO) on human hepatocellular carcinoma HepG2 cells in vitro, Mod. Oncol., 24, 2525
Cited by
Sorted by citations
Chinese guideline for the diagnosis and treatment of drug-induced liver injury: an update
Mao, Y., Ma, S., Liu, C., Liu, X., Su, M., Li, D., Li, Y., Chen, G., Chen, J., Chen, J., et al. (2024) · Hepatology International · doi:10.1007/s12072-023-10633-7 · Cited by 62
Metadata
- Authors
- Wang, Z., Han, H., Wang, C., Zheng, Q., Chen, H., Zhang, X., & Hou, R.
- Venue
- Toxins
- Publisher
- MDPI AG
- Published
- 2021-11-28
- Volume
- 13
- Issue
- 12
- Pages
- 849
- ISSN
- 2072-6651
- PMC
- PMC8709407
- Cited by
- 36
- References
- 0
- Language
- en
About these checks
Registry, retraction, Cites and statistics results are computed, not judged, with one exception: a printed reference that no index lists is read once by a model before it counts as a citation error. Claims are extracted by a model and kept only when their quote appears verbatim in the text; each cited source is then checked, with a model’s help, for whether it says what the claim relies on. Those verdicts can be wrong — read the claim’s quote and the cited source before relying on one.
Statistics and arithmetic are recomputed, not judged.
Confidence bands are shown only for fields calibrated on our annotated test set. None is calibrated yet, so no band is shown.
What counts as a claim ›How we measure confidence ›How we check this ›
Are you an author, or do you see a problem with this page? Request a review
