

The DOI matches its Crossref record; 71 of the 71 references it cites were found in a registry or an index.
EWI-2 Inhibits Cell–Cell Fusion at the HIV-1 Virological Presynapse
Open accessPublished version of a preprint
Abstract
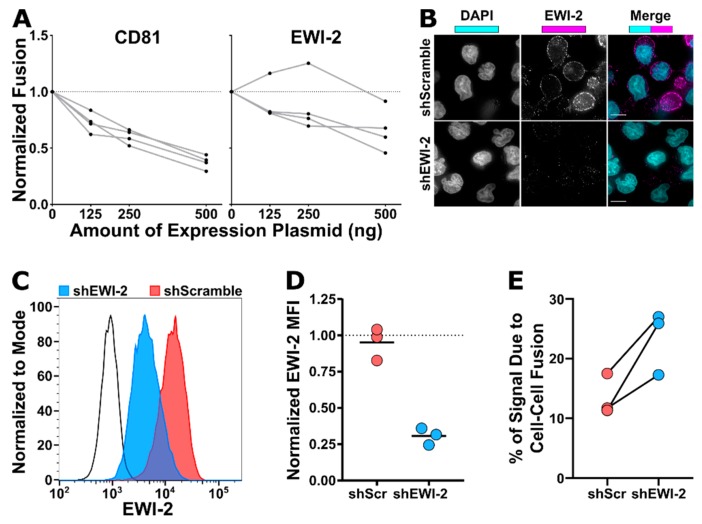
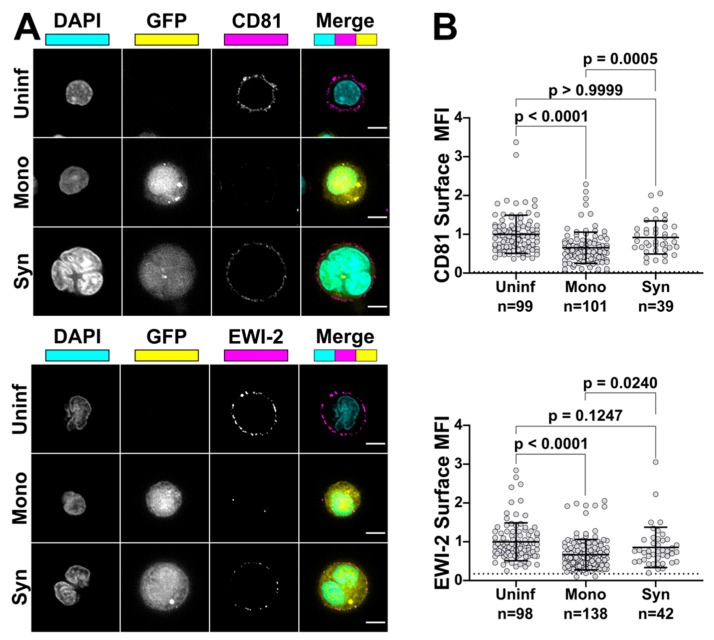
Abstract Cell-to-cell transfer of virus particles through the virological synapse (VS) is a highly efficient mode of HIV-1 transmission. Formation of the VS, a transient multiform adhesion structure, is mediated through an interaction between the HIV-1 envelope glycoprotein (Env) and the viral receptor CD4 on the surface of infected cell and target cell, respectively. Given that Env, unlike many other viral fusogens, can mediate the merger of membranes at neutral pH, the close encounter of infected and uninfected cells would seem prone to result in cell-cell fusion and thus the formation of syncytia. However, while it is being recognized now that small, T cell-based syncytia are indeed a defining feature of the natural history of HIV-1, the majority of VSs nevertheless resolve without fusion, thus securing continued virus spread. Gag, the main viral structural component, is partially responsible for restraining Env and preventing it from becoming fusogenic before being incorporated into particles. In addition, a few cellular factors, including tetraspanins and ezrin, have also been shown to inhibit Env’s activity while this fusogen is still part of the producer cell. Here, we identify EWI-2, a protein that was previously shown to associate with the tetraspanins CD9 and CD81 and also with ezrin, as a host factor that contributes to the inhibition of Envmediated cell-cell fusion. Using fluorescence microscopy, flow cytometry, and TZM-bl fusion assays, we show that EWI-2, comparable to tetraspanins, while overall being downregulated upon HIV-1 infection, accumulates at the producer cell side of the VS (i.e. the presynapse), where it contributes to the fusion-preventing activities of the other viral and cellular components.
Overview
The claims and statistics of this paper haven’t been checked yet.
Run the check — free, no account needed. It reads the open-access text and checks the sources it cites.
Integrity signals
Registry
Cites
Statistics
Figures
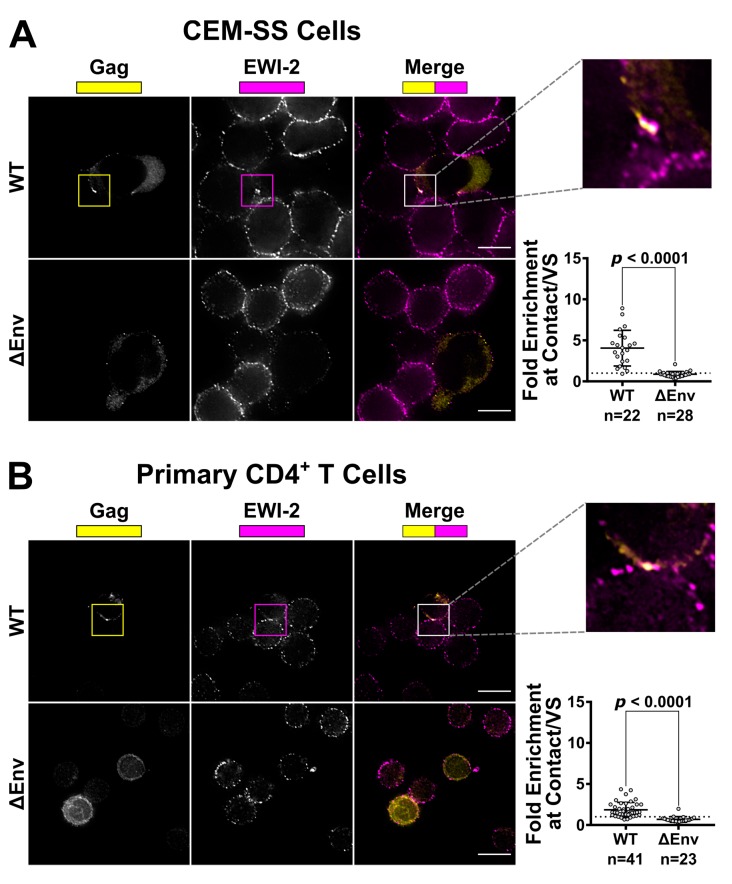
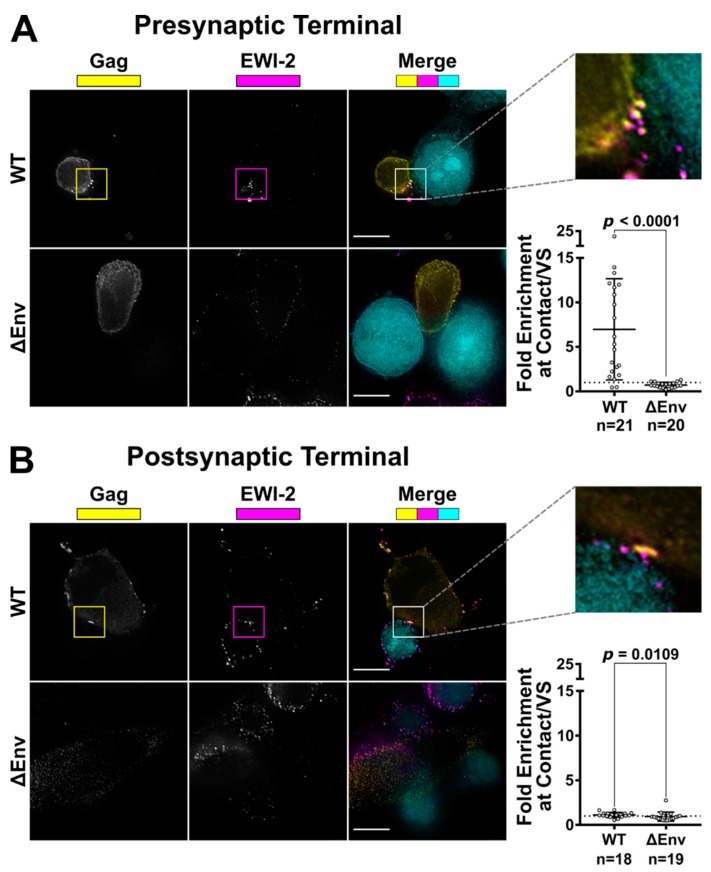
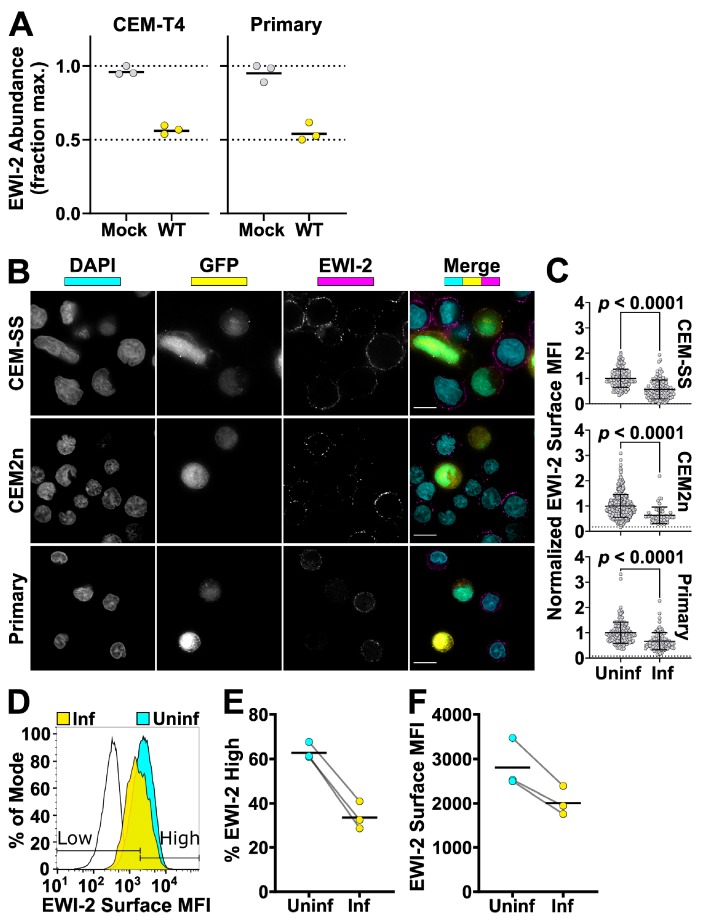
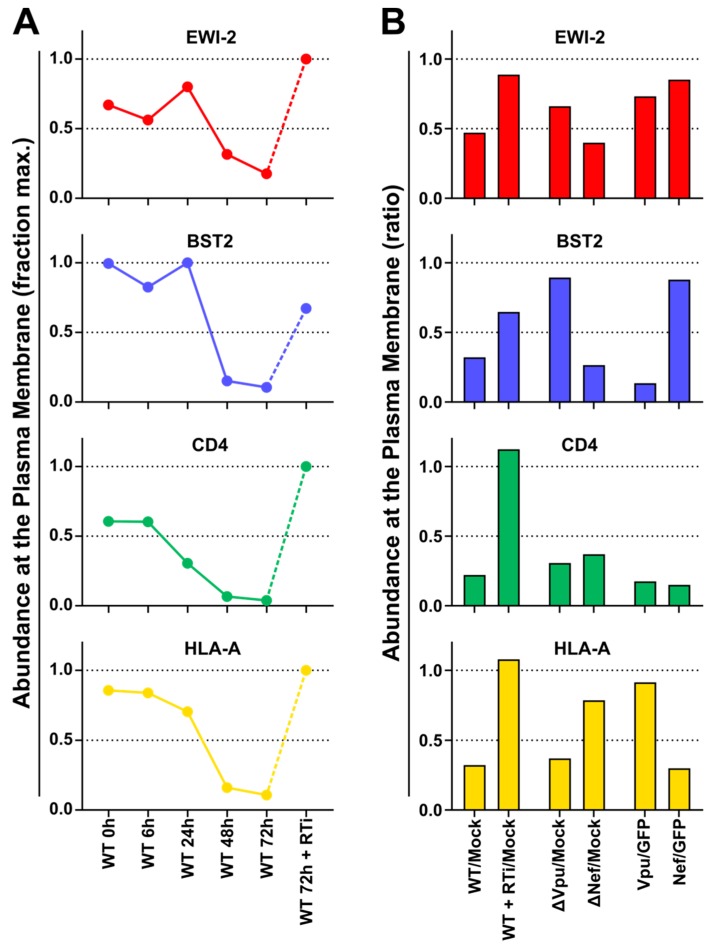
Verification
Claims the paper makes
The claims and statistics of this paper haven’t been checked yet.
Run the check — free, no account needed. It reads the open-access text and checks the sources it cites.
Claims other papers make about this one
Each is checked against this paper’s own text: does it say what the citing paper says it does?
The cited source says what the claim attributes to it.
In the citing paper
“However, during cell-to-cell transmission, this process is inhibited by cell membrane proteins that accumulate at the VS zone: tetraspanins [46], ezrin [47], and Ewi-2 [48].”
From HIV-1 and HTLV-1 Transmission Modes: Mechanisms and Importance for Virus Spread (2022) · cites this paper as [48]
Self-check
Percentages, sums and reported differences re-computed from the paper’s own numbers.
The self-check needs the paper’s full text.
Citations
Cites
Fiji: an open-source platform for biological-image analysis
Schindelin, J., Arganda-Carreras, I., Frise, E., Kaynig, V., Longair, M., Pietzsch, T., Preibisch, S., Rueden, C., Saalfeld, S., Schmid, B., et al. (2012) · Nature Methods · doi:10.1038/nmeth.2019 · Cited by 66,890
The T4 gene encodes the AIDS virus receptor and is expressed in the immune system and the brain
Maddon, P. J., Dalgleish, A. G., McDougal, J. S., Clapham, P. R., Weiss, R. A., & Axel, R. (1986) · Cell · doi:10.1016/0092-8674(86)90590-8 · Cited by 2,003
Wei, X., Decker, J. M., Liu, H., Zhang, Z., Arani, R. B., Kilby, J. M., Saag, M. S., Wu, X., Shaw, G. M., & Kappes, J. C. (2002) · Antimicrobial Agents and Chemotherapy · doi:10.1128/aac.46.6.1896-1905.2002 · Cited by 1,569
Platt, E. J., Wehrly, K., Kuhmann, S. E., Chesebro, B. W., & Kabat, D. (1998) · Journal of Virology · doi:10.1128/jvi.72.4.2855-2864.1998 · Cited by 1,223
Continuous culture of human lymphoblasts from peripheral blood of a child with acute leukemia
Foley, G. E., Lazarus, H., Farber, S., Geren, B. B., Boone, B. A., & McCarthy, R. E. (1965) · Cancer · doi:10.1002/1097-0142(196504)18:4 · Cited by 1,166
Derdeyn, C. A., Decker, J. M., Sfakianos, J. N., Wu, X., O’Brien, W. A., Ratner, L., Kappes, J. C., Shaw, G. M., & Hunter, E. (2000) · Journal of Virology · doi:10.1128/jvi.74.18.8358-8367.2000 · Cited by 743
Qin, F. X.-F., An, D. S., Chen, I. S. Y., & Baltimore, D. (2002) · Proceedings of the National Academy of Sciences · doi:10.1073/pnas.232688199 · Cited by 701
HIV-1 Cell to Cell Transfer across an Env-induced, Actin-dependent Synapse
Jolly, C., Kashefi, K., Hollinshead, M., & Sattentau, Q. J. (2004) · The Journal of Experimental Medicine · doi:10.1084/jem.20030648 · Cited by 623
Quantitative 3D Video Microscopy of HIV Transfer Across T Cell Virological Synapses
Hübner, W., McNerney, G. P., Chen, P., Dale, B. M., Gordon, R. E., Chuang, F. Y. S., Li, X.-D., Asmuth, D. M., Huser, T., & Chen, B. K. (2009) · Science · doi:10.1126/science.1167525 · Cited by 486
Transcriptional and Posttranscriptional Regulation of HIV-1 Gene Expression
Karn, J., & Stoltzfus, C. M. (2012) · Cold Spring Harbor Perspectives in Medicine · doi:10.1101/cshperspect.a006916 · Cited by 437
Cited by
Sorted by citations
Fan, Y., Pionneau, C., Cocozza, F., Boëlle, P., Chardonnet, S., Charrin, S., Théry, C., Zimmermann, P., & Rubinstein, E. (2023) · Journal of Extracellular Vesicles · doi:10.1002/jev2.12352 · Cited by 156
HIV-1 and HTLV-1 Transmission Modes: Mechanisms and Importance for Virus Spread
Kalinichenko, S., Komkov, D., & Mazurov, D. (2022) · Viruses · doi:10.3390/v14010152 · Cited by 68
Productive HIV-1 infection of tissue macrophages by fusion with infected CD4+ T cells
Mascarau, R., Woottum, M., Fromont, L., Gence, R., Cantaloube-Ferrieu, V., Vahlas, Z., Lévêque, K., Bertrand, F., Beunon, T., Métais, A., et al. (2023) · The Journal of Cell Biology · doi:10.1083/jcb.202205103 · Cited by 41
HIV-1 Activates T Cell Signaling Independently of Antigen to Drive Viral Spread
Len, A. C. L., Starling, S., Shivkumar, M., & Jolly, C. L. (2017) · Cell Reports · doi:10.1016/j.celrep.2016.12.057 · Cited by 41
Bailly, C., & Thuru, X. (2023) · Cancers · doi:10.3390/cancers15072186 · Cited by 40
Proteomic landscape of tunneling nanotubes reveals CD9 and CD81 tetraspanins as key regulators
Manzano, R. N., Chaze, T., Rubinstein, E., Pénard, E., Matondo, M., Zurzolo, C., & Brou, C. (2024) · eLife · doi:10.7554/elife.99172 · Cited by 27
Small but Highly Versatile: The Viral Accessory Protein Vpu
Volčič, M., Wiesmüller, L., & Kirchhoff, F. (2023) · Annual Review of Virology · doi:10.1146/annurev-virology-111821-100816 · Cited by 15
HIV Infection: Shaping the Complex, Dynamic, and Interconnected Network of the Cytoskeleton
Cabrera-Rodríguez, R., Pérez-Yanes, S., Lorenzo-Sánchez, I., Trujillo‐González, R., Estévez‐Herrera, J., García-Luis, J., & Valenzuela-Fernández, A. (2023) · International Journal of Molecular Sciences · doi:10.3390/ijms241713104 · Cited by 14
Moesin controls cell–cell fusion and osteoclast function
Dufrançais, O., Plozza, M., Juzans, M., Métais, A., Monard, S., Bordignon, P., Verdys, P., Sanchez, T., Bergert, M., Halper, J., et al. (2025) · The Journal of Cell Biology · doi:10.1083/jcb.202409169 · Cited by 12
Fernandez, M. V., & Freed, E. O. (2018) · Viruses · doi:10.3390/v10110613 · Cited by 9
Calcineurin phosphatase activity regulates Varicella-Zoster Virus induced cell-cell fusion
Zhou, M., Kamarshi, V., Arvin, A. M., & Oliver, S. L. (2020) · PLoS Pathogens · doi:10.1371/journal.ppat.1009022 · Cited by 6
Building the bridges: molecular mechanisms of tunneling nanotube formation
Brou, C., & Zurzolo, C. (2026) · Cellular and Molecular Life Sciences · doi:10.1007/s00018-026-06097-1 · Cited by 5
Xu, W., Hou, Y., Zhang, J., Cao, T., Dai, G., Wang, W., Tian, N., Liu, D., Chu, H., Sun, H., et al. (2025) · Microorganisms · doi:10.3390/microorganisms13071524 · Cited by 4
Ruiz-Rivera, M. B., Gómez-Icazbalceta, G., Lamoyi, E., & Huerta, L. (2021) · Current Opinion in Pharmacology · doi:10.1016/j.coph.2021.07.005 · Cited by 2
Proteomic landscape of tunneling nanotubes reveals CD9 and CD81 tetraspanins as key regulatorsPreprint
Manzano, R. N., Chaze, T., Rubinstein, E., Pénard, E., Matondo, M., Zurzolo, C., & Brou, C. (2024) · eLife · doi:10.7554/elife.99172.1
Manzano, R. N., Chaze, T., Rubinstein, E., Pénard, E., Matondo, M., Zurzolo, C., & Brou, C. (2024) · eLife · doi:10.7554/elife.99172.1.sa4
Etude de la transmission intercellulaire du VIH-1 vers les macrophages par fusion cellule-cellule
Mascarau, R. (2022) · theses.fr (ABES) · doi:10.70675/2e3aacaazcd4fz49a5zb350zcd4933447d78
Roles of Ezrin, Radixin and Moesin (ERM) in macrophage migration
Verdys, P. (2023) · theses.fr (ABES) · doi:10.70675/9e64e2daz8e8az4b41z8034zaa5bd7328568
Manzano, R. N. (2022) · theses.fr (ABES) · doi:10.70675/8f71254bz5af6z4fdbz8550z05cb2822e327
Cantaloube-Ferrieu, V. (2023) · theses.fr (ABES) · doi:10.70675/e7422723z7cb9z4feczba3bz407046e4c995
Woottum, M. (2024) · theses.fr (ABES) · doi:10.70675/eb8f1671z3537z4850z9985z60ac5ec92890
Mathematical Modeling of Cell-Cell Fusion Assays to Characterize Virus-Mediated Cell Fusion
Dobrovolny, H. M. (2026) · Advances in experimental medicine and biology · doi:10.1007/978-3-032-22637-2_17
HIV-1-induced small T cell syncytia: susceptibility to direct NK cell killingPreprint
Girard, J. P., Whitacker, E. E., Frandina, C. P., Veljkovic, P., Carr, M. K., Symeonides, M., & Thali, M. (2026) · bioRxiv (Cold Spring Harbor Laboratory) · doi:10.64898/2026.06.14.732158
Self-citationAn Aurora Kinase-Dependent Role for Vif in Regulating HIV-1-Induced Cell-Cell FusionPreprint
Tafrate, S., Littell, B., Girard, J. P., Mynar, E. R., Carr, M. K., Thali, M., & Symeonides, M. (2026) · bioRxiv (Cold Spring Harbor Laboratory) · doi:10.64898/2026.06.15.732372
Self-citation
Metadata
- Authors
- Whitaker, E. E., Matheson, N. J., Perlee, S., Munson, P. B., Symeonides, M., & Thali, M.
- Affiliations
- University of Vermont (US)
- University of Cambridge (GB)
- Corresponding author
- Thali, Markus
- ORCID
- Venue
- Viruses
- Publisher
- MDPI AG
- Published
- 2019-11-20
- Volume
- 11
- Issue
- 12
- Pages
- 1082
- ISSN
- 1999-4915 (ISSN-L)
- PMC
- PMC6950393
- OpenAlex
- W2990116699
- Cited by
- 27
- References
- 71
- Citations by year
- 2026: 3 · 2025: 2 · 2024: 8 · 2023: 5 · 2022: 5 · 2021: 1 · 2020: 1
- FWCI
- 0.98
- Type
- journal article
- Language
- en
- Open access
- gold
- dx.doi.org
- Licence
- Locations
- Viruses (publishedVersion, cc-by)
- bioRxiv (Cold Spring Harbor Laboratory) (acceptedVersion, cc-by-nc)
- Europe PMC (PubMed Central) (publishedVersion, cc-by)
- PubMed Central (publishedVersion, cc-by)
- PubMed (publishedVersion)
- DOAJ (DOAJ: Directory of Open Access Journals) (submittedVersion, cc-by-sa)
- Apollo (University of Cambridge) (submittedVersion, cc-by)
- Apollo (cc-by)
- Funders
- National Institutes of Health (R01-GM117839, P30-RR032135, P30-GM103498)
- University of Vermont Larner College of Medicine (Bridge Support Grant)
- University of Vermont Department of Microbiology & Molecular Genetics (Nicole J. Ferland Award)
- Medical Research Council (CSF MR/P008801/1)
- NHS Blood and Transplant (WPA15-02)
- NIHR Cambridge BRC (N/A)
- Wellcome Trust (Strategic Award)
- Topics
- Life Sciences › Immunology and Microbiology › Virology › HIV Research and Treatment
- Life Sciences › Immunology and Microbiology › Immunology › T-cell and Retrovirus Studies
- Health Sciences › Medicine › Infectious Diseases › HIV/AIDS drug development and treatment
- Keywords
- HIV-1, cell-cell fusion, virological synapse, syncytia, tetraspanins, CD81, Vpu, fusion inhibition, HIV-1 transmission, host factors, ezrin
- MeSH terms
- Cell Fusion, Cell Line, Humans, Membrane Proteins, T-Lymphocytes, Virion, HIV-1, Down-Regulation, HIV Infections, Antigens, CD, Giant Cells, Presynaptic Terminals, RNA, Small Interfering
About these checks
Registry, retraction, Cites and statistics results are computed, not judged, with one exception: a printed reference that no index lists is read once by a model before it counts as a citation error. Claims are extracted by a model and kept only when their quote appears verbatim in the text; each cited source is then checked, with a model’s help, for whether it says what the claim relies on. Those verdicts can be wrong — read the claim’s quote and the cited source before relying on one.
Statistics and arithmetic are recomputed, not judged.
Confidence bands are shown only for fields calibrated on our annotated test set. None is calibrated yet, so no band is shown.
What counts as a claim ›How we measure confidence ›How we check this ›
Are you an author, or do you see a problem with this page? Request a review
