

The DOI matches its Crossref record.
Spatio-Temporal Variations and Source Apportionment of Water Pollution in Danjiangkou Reservoir Basin, Central China
Abstract
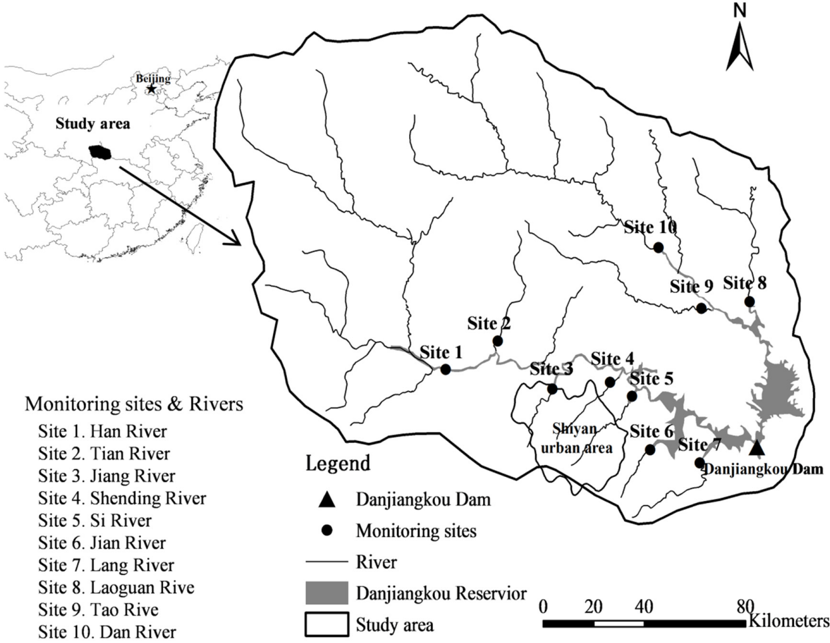
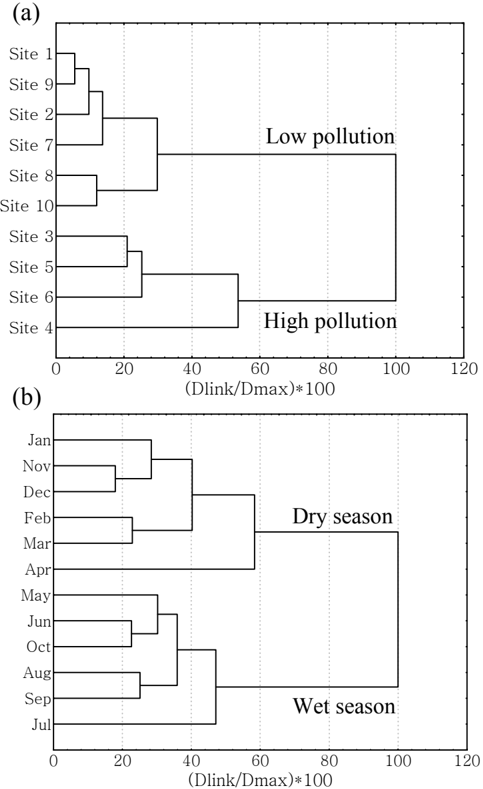
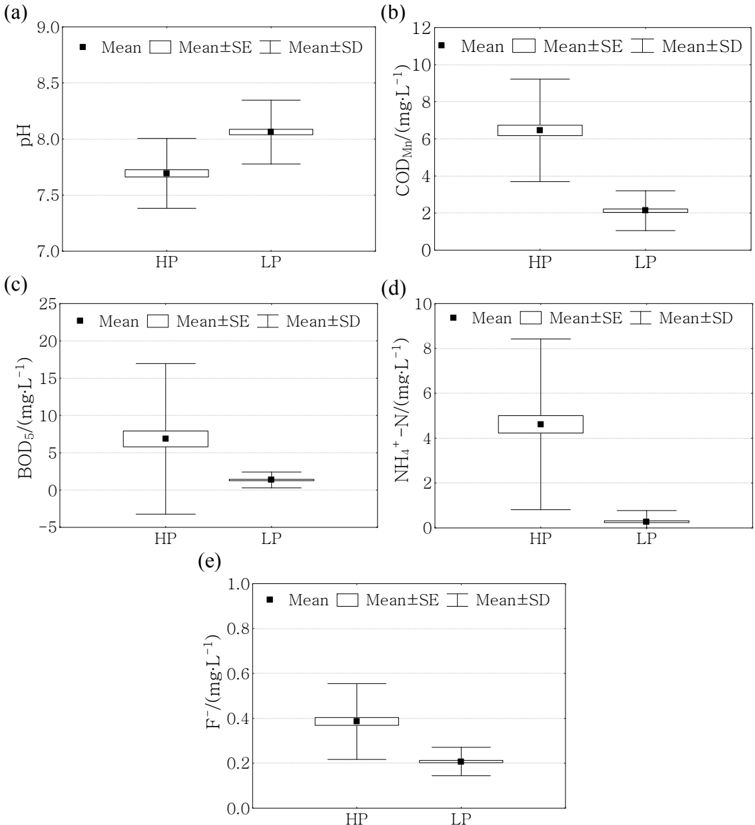
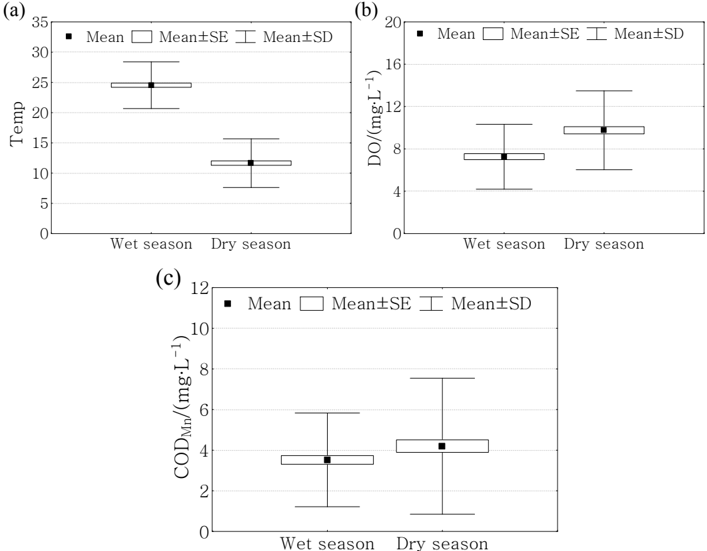
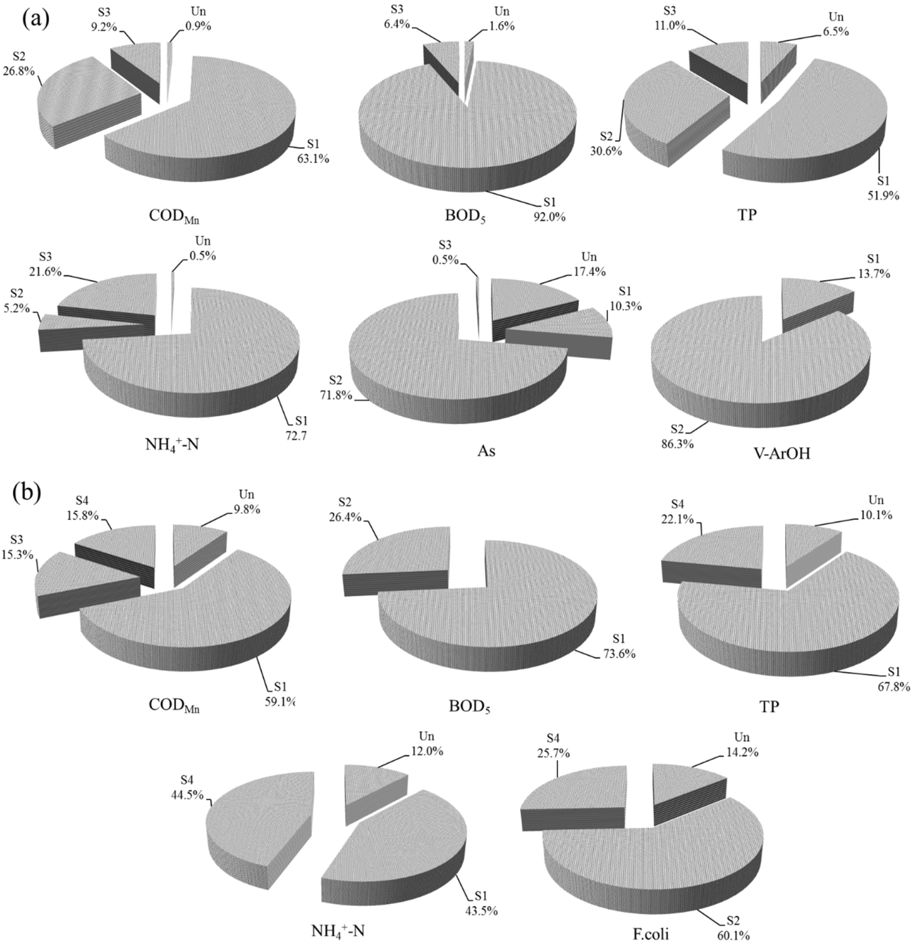
Understanding the spatio-temporal variation and the potential source of water pollution could greatly improve our knowledge of human impacts on the environment. In this work, data of 11 water quality indices were collected during 2012–2014 at 10 monitoring sites in the mainstream and major tributaries of the Danjiangkou Reservoir Basin, Central China. The fuzzy comprehensive assessment (FCA), the cluster analysis (CA) and the discriminant analysis (DA) were used to assess the water pollution status and analyze its spatio-temporal variation. Ten sites were classified by the high pollution (HP) region and the low pollution (LP) region, while 12 months were divided into the wet season and the dry season. It was found that the HP region was mainly in the small tributaries with small drainage areas and low average annual discharges, and it was also found that most of these rivers went through urban areas with industrial and domestic sewages input into the water body. Principal component analysis/factor analysis (PCA/FA) was applied to reveal potential pollution sources, whereas absolute principal component score-multiple linear regression (APCS-MLR) was used to identify their contributions to each water quality variable. The study area was found as being generally affected by industrial and domestic sewage. Furthermore, the HP region was polluted by chemical industries, and the LP region was influenced by agricultural and livestock sewage.
Overview
The claims and statistics of this paper haven’t been checked yet.
Run the check — free, no account needed. It reads the open-access text and checks the sources it cites.
Integrity signals
Registry
Cites
Statistics
Figures
Verification
Claims the paper makes
The claims and statistics of this paper haven’t been checked yet.
Run the check — free, no account needed. It reads the open-access text and checks the sources it cites.
Claims other papers make about this one
Each is checked against this paper’s own text: does it say what the citing paper says it does?
The source backs part of the claim, not all of it — or backs it for a different population, condition or comparison.
In the citing paper
“the accelerating industrialization, unregulated urbanization, and poorly executed development plans have resulted in severe environmental degradation of the rivers.”
From Multivariate analysis of water quality in the Dhaleshwari River, Bangladesh: identifying pollution sources and environmental implications (2024) · cites this paper as [13]
Experimental — accuracy not yet measured
Self-check
Percentages, sums and reported differences re-computed from the paper’s own numbers.
The self-check needs the paper’s full text.
Citations
Cites
No references could be resolved yet.
Research works printed but not linked: 44
- Iscen, 2008, Application of multivariate statistical techniques in the assessment of surface water quality in Uluabat Lake, Turkey, Environ. Monit. Assess., 144, 269, 10.1007/s10661-007-9989-3 · DOI
- Almeida, 2014, Assessment of the water self-purification capacity on a river affected by organic pollution: Application of chemometrics in spatial and temporal variations, Environ. Sci. Pollut. Res., 21, 10583, 10.1007/s11356-014-3098-y · DOI
- Bhaduri, 2001, Long-term hydrologic impact of urbanization: A table of two models, J. Water Res. Plan. Man., 127, 13, 10.1061/(ASCE)0733-9496(2001)127:1(13) · DOI
- Trevilato, 2013, Water quality of the Ribeirão Preto Stream, a watercourse under anthropogenic influence in the southeast of Brazil, Environ. Monit. Assess., 185, 1151, 10.1007/s10661-012-2622-0 · DOI
- Salve, 2011, Source identification and variation in the chemical composition of rainwater at coastal and industrial areas of India, J. Atmos. Chem., 68, 183, 10.1007/s10874-012-9217-6 · DOI
- Mustapha, 2014, Statistical approach in determining the spatial changes of surface water quality at the upper course of Kano River, Nigeria, Water Qual. Expo. Health, 6, 127, 10.1007/s12403-014-0117-7 · DOI
- Shrestha, 2007, Assessment of surface water quality using multivariate statistical techniques: A case study of the Fuji river basin, Japan, Environ. Modell. Softw., 22, 464, 10.1016/j.envsoft.2006.02.001 · DOI
- Mustapha, 2013, River water quality assessment using environmentric techniques: Case study of Jakara River Basin, Environ. Sci. Pollut. Res., 20, 5630, 10.1007/s11356-013-1542-z · DOI
- Kazi, 2009, Assessment of water quality of polluted lake using multivariate statistical techniques: A case study, Ecotox. Environ. Safe., 72, 301, 10.1016/j.ecoenv.2008.02.024 · DOI
- Liou, 2005, A fuzzy index model for trophic status evaluation of reservoir waters, Water Res., 39, 1415, 10.1016/j.watres.2005.01.014 · DOI
- Lu, 1999, Analysis of reservoir water quality using fuzzy synthetic evaluation, Stoch. Environ. Res. Risk Assess., 13, 327, 10.1007/s004770050054 · DOI
- Dahiya, 2007, Analysis of groundwater quality using fuzzy synthetic evaluation, J. Hazard. Mater., 147, 938, 10.1016/j.jhazmat.2007.01.119 · DOI
- Huang, 2010, Spatial variation and source apportionment of water Pollution in Qiantang River (China) using statistical techniques, Water Res., 44, 1562, 10.1016/j.watres.2009.11.003 · DOI
- Varol, 2013, Dissolved heavy metal concentrations of the Kralkizi, Dicle and Batman dam reservoirs in the Tigris River Basin, Turkey, Chemosphere, 93, 954, 10.1016/j.chemosphere.2013.05.061 · DOI
- Yang, 2010, Analysis of spatial and temporal water pollution patterns in Lake Dianchi using multivariate statistical methods, Environ. Monit. Assess., 170, 407, 10.1007/s10661-009-1242-9 · DOI
- Gridharan, 2009, Assessment of water quality using chemometric tools: A case study of river Cooum, south, India, Arch. Environ. Contam. Toxicol., 56, 654, 10.1007/s00244-009-9310-2 · DOI
- Papaioannou, 2010, Application of multivariate statistical methods for groundwater physicochemical and biological quality assessment in the context of public health, Environ. Monit. Assess., 170, 87, 10.1007/s10661-009-1217-x · DOI
- Singh, 2005, Water quality assessment and apportionment of pollution sources of Gomti river (India) using multivariate statistical techniques—A case study, Anal. Chim. Acta, 538, 355, 10.1016/j.aca.2005.02.006 · DOI
- Zhang, 2011, Application of multivariate statistical techniques in the assessment of water quality in the Southwest New Territories and Kowloon, Hong Kong, Environ. Monit. Assess., 173, 17, 10.1007/s10661-010-1366-y · DOI
- Lim, 2013, Application of the chemometric approach to evaluate the spatial variation of water chemistry and the identification of the sources of pollution in Langat River, Malaysia, Arab. J. Geosic., 6, 4891, 10.1007/s12517-012-0756-6 · DOI
- Alp, 2010, Assessment of surface water quality of the Ceyhan River basin, Turkey, Environ. Monit. Assess., 167, 175, 10.1007/s10661-009-1040-4 · DOI
- Jha, 2014, Multivariate statistical approach to identify significant sources influencing the physico-chemical variables in Aerial Bay, North Andaman, India, Mar. Pollut. Bull., 85, 261, 10.1016/j.marpolbul.2014.06.007 · DOI
- Pekey, 2004, Source apportionment of trace metals in surface waters of a polluted stream using multivariate statistical analyses, Mar. Pollut. Bull., 49, 809, 10.1016/j.marpolbul.2004.06.029 · DOI
- Miller, 2002, Source apportionment of exposures to volatile organic compounds. I. Evaluation of receptor models using simulated exposure data, Atmos. Environ., 36, 3629, 10.1016/S1352-2310(02)00279-0 · DOI
- Yang, 2013, Spatial distribution and source apportionment of water pollution in different administrative zones of Wen-Rui-Tang (WRT) river watershed, China, Environ. Sci. Pollut. Res., 20, 5341, 10.1007/s11356-013-1536-x · DOI
- Su, 2011, Temporal trend and source apportionment of water pollution in different functional zones of Qiantang River, China, Water Res., 45, 1781, 10.1016/j.watres.2010.11.030 · DOI
- Mavukkandy, 2014, Assessment and rationalization of water quality monitoring network: A multivariate statistical approach to the Kabbini River (India), Environ. Sci. Pollut. Res., 21, 10045, 10.1007/s11356-014-3000-y · DOI
- Palma, 2010, Assessment of anthropogenic sources of water pollution using multivariate statistical techniques: A case study of the Alqueva’s reservoir, Portugal, Environ. Monit. Assess., 165, 539, 10.1007/s10661-009-0965-y · DOI
- Li, 2008, Water quality in relation to the land use and land cover in the Upper Han River basin, China, Catena, 75, 216, 10.1016/j.catena.2008.06.005 · DOI
- Li, 2009, Spatial and temporal patterns of the water quality in the Danjiangkou Reservoir, China, Hydrolog. Sci. J., 54, 124, 10.1623/hysj.54.1.124 · DOI
- Vega, 1998, Assessment of seasonal and polluting effects on the quality of river water by exploratory data analysis, Water Res., 32, 3581, 10.1016/S0043-1354(98)00138-9 · DOI · Paper page
- Osman, 2012, Chemometric application in identifying sources of organic contaminants in Langat river basin, Environ. Monit. Assess., 184, 1001, 10.1007/s10661-011-2016-8 · DOI
- Simeonov, 2003, Assessment of the surface water quality in Northern Greece, Water Res., 37, 4119, 10.1016/S0043-1354(03)00398-1 · DOI
- Alberto, 2001, Pattern recognition techniques for the evaluation of spatial and temporal variation in water quality. A case study: Suquia river basin (Cordoba Argentina), Water Res., 35, 2881, 10.1016/S0043-1354(00)00592-3 · DOI
- Liu, 2003, Application of factor analysis in the assessment of groundwater quality in a blackfoot disease area in Taiwan, Sci. Total Environ., 313, 77, 10.1016/S0048-9697(02)00683-6 · DOI
- Singh, 2008, Receptor modeling for source apportionment of polycyclic aromatic hydrocarbons in urban atmosphere, Environ. Monit. Assess., 136, 183, 10.1007/s10661-007-9674-6 · DOI
- Kowalkowski, 2006, Application of chemometrics in river water classification, Water Res., 40, 744, 10.1016/j.watres.2005.11.042 · DOI
- Varol, 2012, Spatial and temporal variations in surface water quality of the dam reservoirs in the Tigris River Basin, Turkey, Catena, 92, 11, 10.1016/j.catena.2011.11.013 · DOI
- Zilberbran, 2001, Impact of urbanization on hydrochemical evolution of groundwater and on unsaturated-zone gas composition in the coastal city of Tel Aviv, Israel, J. Contam. Hydrol., 50, 175, 10.1016/S0169-7722(01)00118-8 · DOI
- Jain, 2002, A hydro-chemical study of a mountainous watershed: The Ganga, India, Water Res., 36, 1262, 10.1016/S0043-1354(01)00327-X · DOI
- Juahir, 2011, Spatial water quality assessment of Langat River Basin (Malaysia) using environmetric techniques, Environ. Monit. Assess., 173, 625, 10.1007/s10661-010-1411-x · DOI
- Kannel, 2008, Assessment of spatial-temporal patterns of surface and ground water qualities and factors influencing management strategy of groundwater system in an urban river corridor of Nepal, J. Environ. Manag., 86, 595, 10.1016/j.jenvman.2006.12.021 · DOI
- Phillips, 1990, Arsenic in aquatic organisms: A review, emphasizing chemical speciation, Aquat. Toxicol., 16, 151, 10.1016/0166-445X(90)90036-O · DOI
- Zhang, 2009, Water quality assessment and source identification of Daliao River Basin using multivariate statistical methods, Environ. Monit. Assess., 152, 105, 10.1007/s10661-008-0300-z · DOI
Cited by
Sorted by citations
Ali, M. S., Begum, S., Rabbi, F. M., Sumaia, Hasan, M. K., Rahman, M. A., Rahman, M. M., & Rahaman, M. H. (2024) · Water Practice & Technology · doi:10.2166/wpt.2024.251 · Cited by 13
Metadata
- Authors
- Chen, P., Li, L., & Zhang, H.
- Venue
- Water
- Publisher
- MDPI AG
- Published
- 2015-05-27
- Volume
- 7
- Issue
- 6
- Pages
- 2591-2611
- ISSN
- 2073-4441
- Cited by
- 54
- References
- 0
- Language
- en
- Funders
- “948 Project” of the Ministry of Water Resources of China (Grant No. 201434)
About these checks
Registry, retraction, Cites and statistics results are computed, not judged, with one exception: a printed reference that no index lists is read once by a model before it counts as a citation error. Claims are extracted by a model and kept only when their quote appears verbatim in the text; each cited source is then checked, with a model’s help, for whether it says what the claim relies on. Those verdicts can be wrong — read the claim’s quote and the cited source before relying on one.
Statistics and arithmetic are recomputed, not judged.
Confidence bands are shown only for fields calibrated on our annotated test set. None is calibrated yet, so no band is shown.
What counts as a claim ›How we measure confidence ›How we check this ›
Are you an author, or do you see a problem with this page? Request a review
How to cite
Cite CoChat for the checks on this page, and the paper for its own findings.
- This page
- CoChat. (2026). Citation check: Spatio-Temporal Variations and Source Apportionment of Water Pollution in Danjiangkou Reservoir Basin, Central China. https://app.cochat.ai/papers/10.3390/w7062591
- The paper
- Chen, P., Li, L., & Zhang, H. (2015). Spatio-Temporal Variations and Source Apportionment of Water Pollution in Danjiangkou Reservoir Basin, Central China. Water. https://doi.org/10.3390/w7062591
