

Enhancing Electoral Transparency in Sierra Leone through Data Visualization and Mapping
Open accessThe DOI matches its Crossref record; 4 of the 4 references it cites were found in a registry or an index; none of the 12 sources its claims cite is checked for support yet.
Abstract
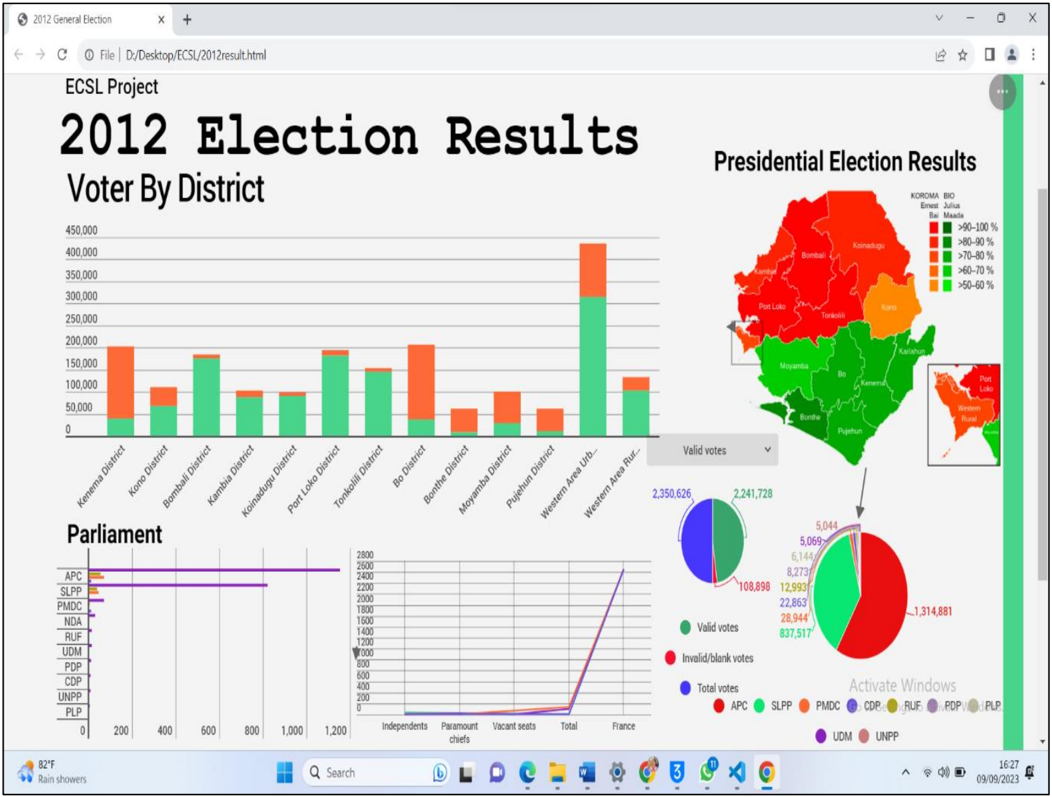
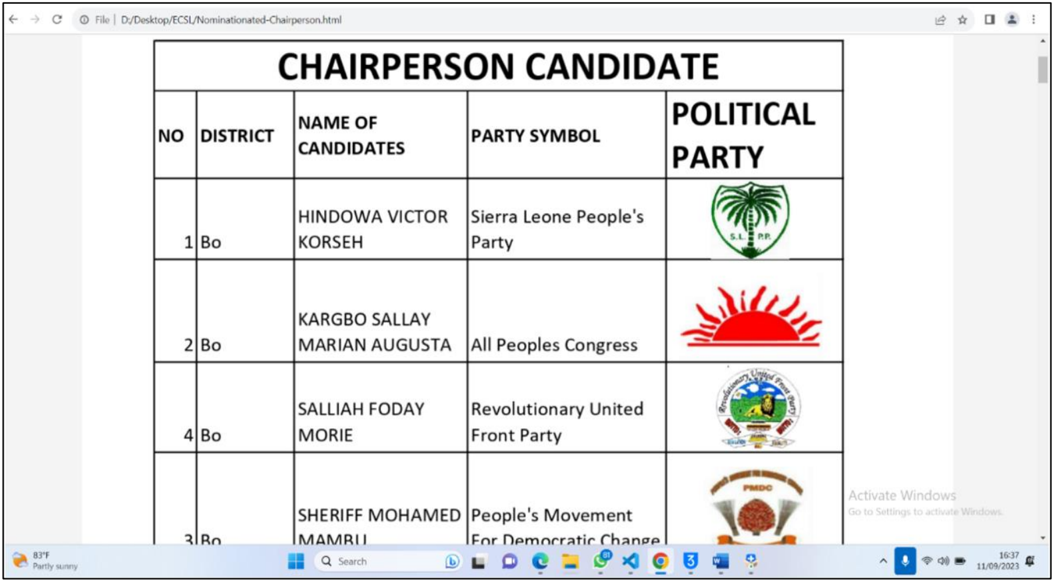
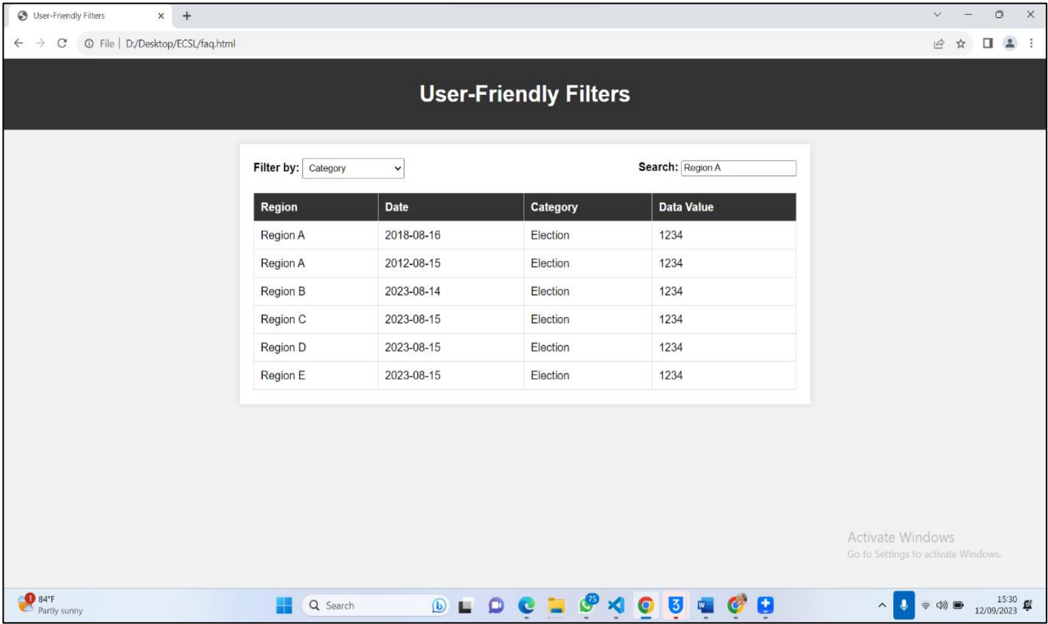
This study investigates the transformative potential of data visualization and geographic information systems (GIS) in enhancing electoral transparency, civic empowerment, and democratic resilience within the context of Sierra Leonea nation navigating post-conflict reconstruction and democratic consolidation. Despite commendable progress in institutional reform, electoral processes in Sierra Leone remain constrained by limited transparency, inadequate access to real-time information, low levels of voter education, and growing public skepticism regarding electoral credibility. As digital technologies become increasingly integral to governance worldwide, their integration into electoral systems emerges as both a strategic imperative and a tool for democratic renewal. To address these challenges, this research proposes and critically examines the development of an interactive, web-based election analysis platform that leverages data visualization and spatial mapping to present complex electoral data in intuitive, accessible formats. Utilizing a Design Science Research (DSR) methodology, the study combines empirical data collection through stakeholder interviews, usability testing, and field observations with iterative prototype development. The platform features dynamic dashboards, choropleth maps, candidate profiles, and real-time reporting functionalities designed to engage a broad spectrum of users, including policymakers, civil society actors, journalists, researchers, and the general public. Grounded in interdisciplinary literature on digital democracy, information asymmetry, and participatory governance, this paper situates Sierra Leone democratic trajectory within the evolving global discourse on e-governance and civic technology. The findings reveal that interactive visual tools not only enhance electoral transparency but also foster greater inclusivity by engaging marginalized and low-literacy populations. Moreover, the system functions as a safeguard against misinformation, providing a centralized, verifiable source of electoral data that can inform media reporting and academic research. Ultimately, this study contributes a replicable, context-sensitive framework for integrating digital innovation into fragile electoral environments. The proposed model offers a scalable blueprint for electoral reform that extends beyond Sierra Leone, serving as a reference point for other emerging democracies seeking to harness technology in the service of electoral integrity, civic engagement, and institutional accountability.
Overview
CoChat Summary
TL;DR
This paper proposes and evaluates a web-based election analysis platform for Sierra Leone that uses data visualization and GIS to improve electoral transparency, accessibility, and civic engagement. In usability testing, the prototype scored an average SUS of 82.1, and 91% of users said the maps and dashboards improved their understanding of voting patterns.
Key findings
- In usability testing, 91% of users said the choropleth maps and interactive dashboards significantly improved their ability to understand voting patterns.
- 87% of users reported that the platform increased their trust in electoral outcomes, citing enhanced data visibility, multiple data sources, and drill-down charts/downloadable datasets.
- 78% said they were very likely to use the platform during future elections.
- The System Usability Scale (SUS) averaged 82.1, which the paper describes as an "excellent" usability category.
Methods
- The study used a mixed-methods design embedded in Design Science Research (DSR) to develop, implement, and evaluate an electoral analysis platform (EAP-SL/EAW-SL).
- It began with document analysis of official reports, election observation findings, media content, civic society publications, and public feedback from the 2012, 2018, and 2023 general elections; it also conducted semi-structured interviews with 30 stakeholders and later usability testing with 25 end users in workshops, plus a larger feedback sample of 70 respondents.
- Analysis included thematic analysis of interview transcripts using NVivo, plus usability evaluation using the System Usability Scale, scenario-based navigation tasks, post-session surveys, and focus groups.
Limitations
- The paper states implementation challenges: institutional inertia, budgetary constraints, digital literacy gaps, and data governance/privacy concerns.
- It also notes a desire for real-time features and says the prototype was especially evaluated on static and historical data visualizations; this suggests the current version is not yet a full live-election system, which is evident from the text.
- The evidence is based on prototype testing and stakeholder feedback, not on deployment in an actual national election; this is evident from the text.
Model-written summary. Check it against the paper before relying on it.
Integrity signals
Registry
Cites
Statistics
Figures


Verification
Claims the paper makes
0 Valid · 3 Not valid · 12 Not checked · 42 Own results and interpretations
A result the paper states — it cites no source for it, so there is none to check. The quote shows it is in the paper.
In the paper
“The findings reveal that interactive visual tools not only enhance electoral transparency but also foster greater inclusivity by engaging marginalized and low-literacy populations.”
plainstates a cause- Asserted: passes — The authors put it forward as true.
- Checkable: passes — It can be checked against evidence.
- Load-bearing: passes — The paper’s conclusions depend on it.
- Based: passes — The paper gives a reason why it holds.
The paper states this without a source or data behind it here, so there is nothing to check it against. The quote shows it is in the paper.
In the paper
“The findings reveal that interactive visual tools not only enhance electoral transparency but also foster greater inclusivity by engaging marginalized and low-literacy populations.”
plainstates a cause- Asserted: passes — The authors put it forward as true.
- Checkable: passes — It can be checked against evidence.
- Load-bearing: passes — The paper’s conclusions depend on it.
- Based: unclear — It is unclear why the paper says it holds.
A result the paper reports from its own data — it cites no other source for it, so there is none to check. The quote shows it is in the paper.
In the paper
“Respondents, particularly those from rural and low-literacy backgrounds, emphasized the importance of localized features.”
plain- Asserted: passes — The authors put it forward as true.
- Checkable: passes — It can be checked against evidence.
- Load-bearing: unclear — It is unclear whether the paper’s conclusions depend on it.
- Based: passes — The paper gives a reason why it holds.
A result the paper reports from its own data — it cites no other source for it, so there is none to check. The quote shows it is in the paper.
In the paper
“91% of users reported that the choropleth maps and interactive dashboards significantly improved their ability to understand voting patterns, especially in identifying regional political strongholds and demographic voting trends.”
plainstates a cause- Asserted: passes — The authors put it forward as true.
- Checkable: passes — It can be checked against evidence.
- Load-bearing: passes — The paper’s conclusions depend on it.
- Based: passes — The paper gives a reason why it holds.
A result the paper reports from its own data — it cites no other source for it, so there is none to check. The quote shows it is in the paper.
In the paper
“Users operating on 3G networks reported seamless access to visualizations and map interfaces, even in bandwidth-constrained environments.”
plain- Asserted: passes — The authors put it forward as true.
- Checkable: passes — It can be checked against evidence.
- Load-bearing: unclear — It is unclear whether the paper’s conclusions depend on it.
- Based: passes — The paper gives a reason why it holds.
10 more claims
Create a free account to see all 57 claims and every source verdict.
- Probably not a substantial claim. 29
- It may state two separate claims as one. 23
- The quote only partly states this claim. 1
Self-check
Percentages, sums and reported differences re-computed from the paper’s own numbers.
Each contradiction between two passages listed here was confirmed by an independent check.
Rated minor: it would not touch a result — a value no result rests on, a p-value that stays on the same side of the significance level, or a conflict that is clerical, resolved elsewhere in the paper, or outside its own findings.
In the paper
§ System Design
“a responsive web-based prototype of the Electoral Analysis Platform for Sierra Leone (EAP-SL) was developed.”
§ VII. FINDINGS AND USER FEEDBACK
“The evaluation phase of the Electoral Analysis Website for Sierra Leone (EAW-SL) involved structured usability testing and feedback collection from a purposive sample of 70 respondents , drawn from key stakeholder groups, including civil society organizations, journalists, university students, ECSL staff, and grassroots community leaders.”
Citations
Cites
Design Science in Information Systems Research1
Hevner, A. R., March, S. T., Park, J., & Ram, S. (2004) · MIS Quarterly · doi:10.2307/25148625 · Cited by 10,707
Bøås, M., & Dunn, K. (2013) · Zed Books · doi:10.5040/9781350221802 · Cited by 130
Vokes, R. (2003) · African Affairs · doi:10.1093/afraf/adg020 · Cited by 1
Research works printed but not linked: 2
- Mansilla, L., & Abascal, E. (2020). Electoral visualization: The visualization of electoral results. In L. LeDuc, R. G. Niemi, & P. Norris (Eds.), Handbook of electoral behaviour (pp. 389–408). Routledge.
- Norris, P., & Frank, M. (2018). Why elections fail. Cambridge University Press. https://doi.org/10.1017/9781139680727 · doi:10.1017/9781139680727
Metadata
- Authors
- Kargbo, H. A., & Turay, A.
- Affiliations
- Freetown Polytechnic (SL)
- University of Sierra Leone (SL)
- Venue
- International Journal of Innovative Science and Research Technology
- Published
- 2025-05-13
- Pages
- 3303-3314
- OpenAlex
- W4410322716
- Semantic Scholar
- e48cae07dd7fc145fc032b104b735d5930ea3877
- Cited by
- 0
- References
- 3
- FWCI
- 0.00
- Type
- journal article
- Language
- en
- Open access
- gold
- doi.org
- Licence
- cc-by-nc
- Topics
- Social Sciences › Political Science and International Relations › E-Government and Public Services
- Social Sciences › Political Science and International Relations › Electoral Systems and Political Participation
- Physical Sciences › Computer Science › Computer Graphics and Computer-Aided Design › Data Visualization and Analytics
- Keywords
- election transparency, data visualization, geographic information systems, digital democracy, digital governance, civic technology, voter education, electoral integrity, post-conflict reconstruction, democratic consolidation, misinformation, choropleth maps, interactive dashboard, participatory governance
About these checks
Registry, retraction, Cites and statistics results are computed, not judged, with one exception: a printed reference that no index lists is read once by a model before it counts as a citation error. Claims are extracted by a model and kept only when their quote appears verbatim in the text; each cited source is then checked, with a model’s help, for whether it says what the claim relies on. Those verdicts can be wrong — read the claim’s quote and the cited source before relying on one.
A language model drew the claims from the paper on 2026-10-10, under version 3 of the claim definition (model deepseek-v4.1-flash, prompt extract-v3).
A second model labelled each claim on 2026-10-10 (model jev-1.13-20260917, definition revision gold-guideline-v0.2).
Statistics and arithmetic are recomputed, not judged.
Confidence bands are shown only for fields calibrated on our annotated test set. None is calibrated yet, so no band is shown.
What counts as a claim ›How we measure confidence ›How we check this ›
Are you an author, or do you see a problem with this page? Request a review
How to cite
Cite CoChat for the checks on this page, and the paper for its own findings.
- This page
- CoChat. (2026). Citation check: Enhancing Electoral Transparency in Sierra Leone through Data Visualization and Mapping. https://app.cochat.ai/papers/10.38124/ijisrt/25apr1970
- The paper
- Kargbo, H. A., & Turay, A. (2025). Enhancing Electoral Transparency in Sierra Leone through Data Visualization and Mapping. International Journal of Innovative Science and Research Technology. https://doi.org/10.38124/ijisrt/25apr1970
Data sources
Bibliographic data: Semantic Scholar, OpenAlex, Crossref.
Contains information from the Semantic Scholar Academic Graph Datasets, made available under the ODC Attribution License (ODC-BY 1.0).
Semantic Scholar’s data is described in: Kinney, R., et al. (2023). The Semantic Scholar Open Data Platform. arXiv:2301.10140.
