

The DOI matches its Crossref record; 47 of the 50 references it cites were found in a registry or an index.
Association of serum levels of deoxyribose 1‑phosphate and S‑lactoylglutathione with neoadjuvant chemotherapy sensitivity in patients with gastric cancer: A metabolomics study
Open accessAbstract
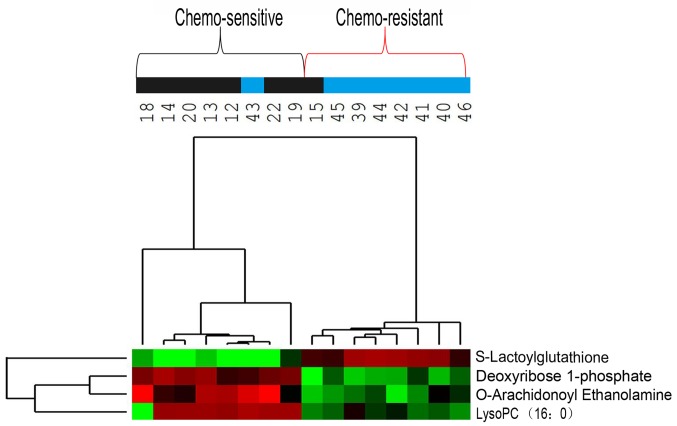
The present study screened serum samples from patients with advanced-stage gastric cancer and known sensitivities to neoadjuvant chemotherapy, in order to identify metabolites that may serve as potential biomarkers for chemotherapy sensitivity. A total of 47 patients with stage III (T4b) or IV gastric cancer, including 31 in the training group and 16 in a validation group, were classified based on their responses to conversion therapy consisting of oxaliplatin, tegafur and continuous hyperthermic peritoneal perfusion with cisplatin. Serum samples were analyzed by liquid chromatography-mass spectrometry to obtain a metabolite profile of each patient. Patients who were responsive and non-responsive to neoadjuvant chemotherapy exhibited significant differences in serum levels of deoxyribose 1-phosphate, S-lactoylglutathione, lysophosphatidylcholine (16:0) and O-arachidonoyl ethanolamine. Logistic regression analysis indicated that deoxyribose 1-phosphate and S-lactoylglutathione were independently associated with chemosensitivity. Serum levels of deoxyribose 1-phosphate and S-lactoylglutathione were independently associated with the sensitivity of gastric cancer to neoadjuvant chemotherapy, therefore, serving as potential predictors of patient response.
Overview
The claims and statistics of this paper haven’t been checked yet.
Run the check — free, no account needed. It reads the open-access text and checks the sources it cites.
Integrity signals
Registry
Cites
Statistics
Figures
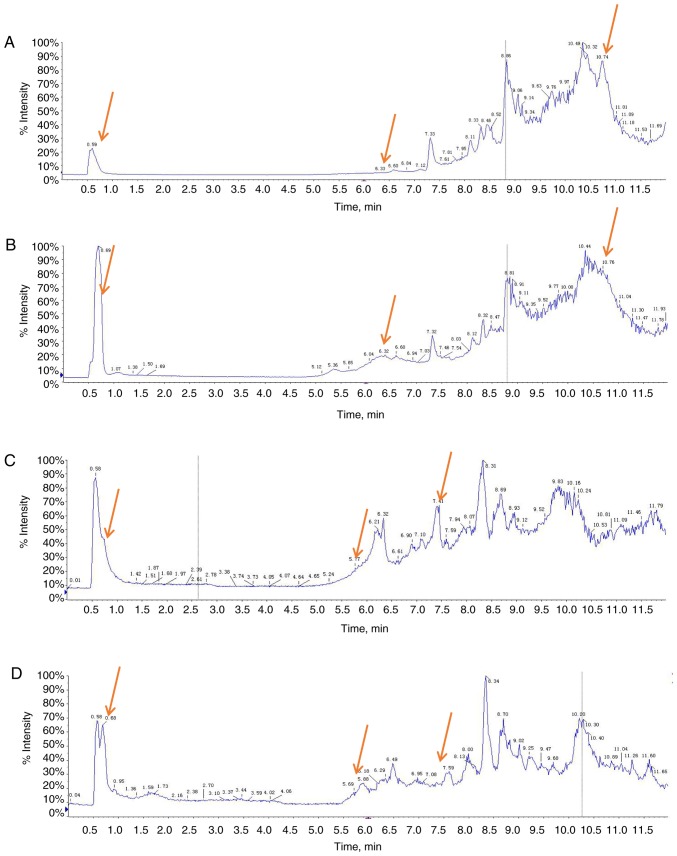
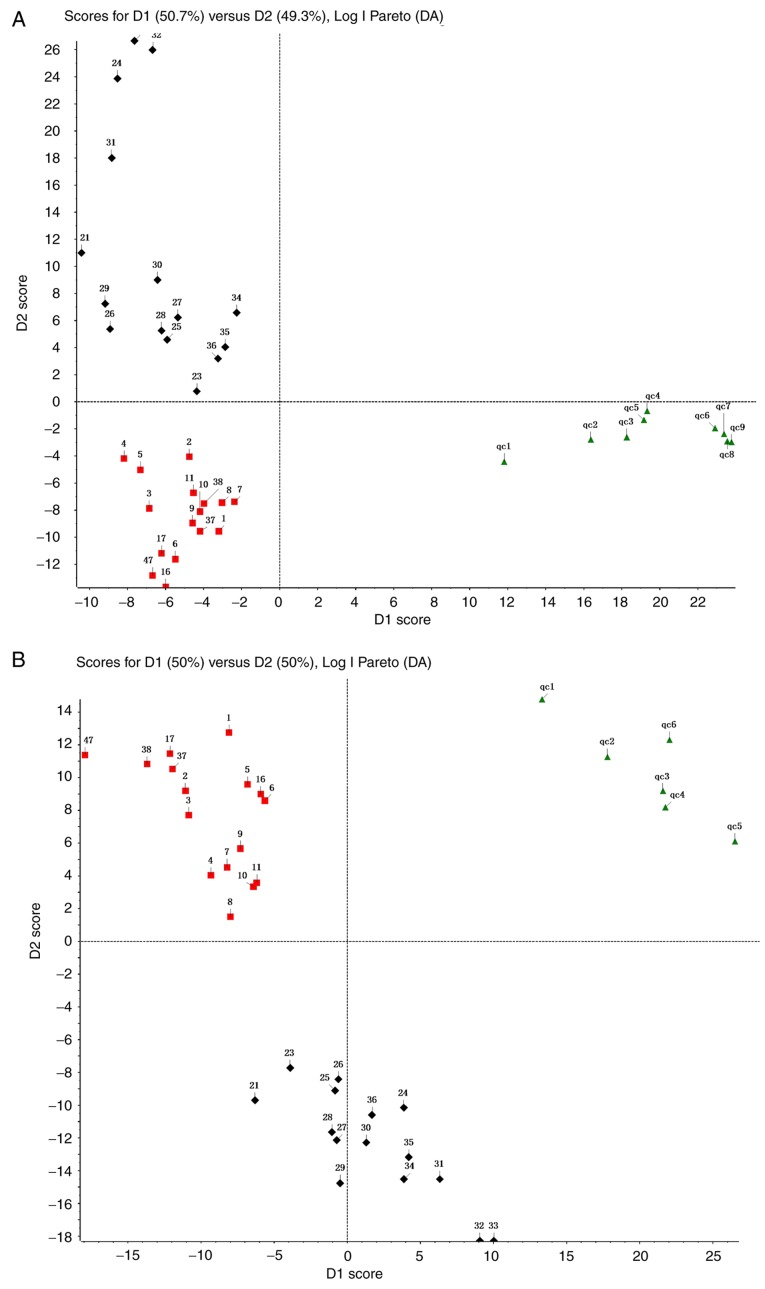
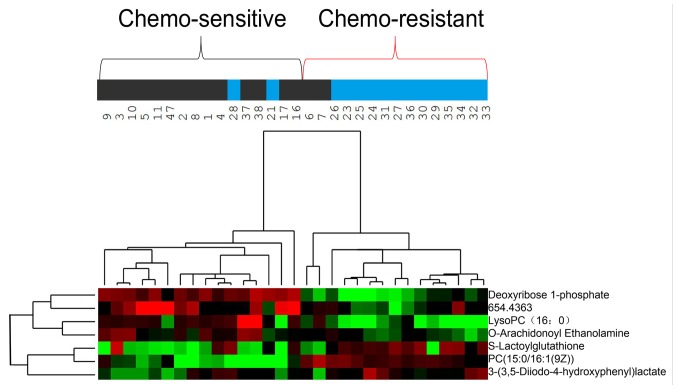
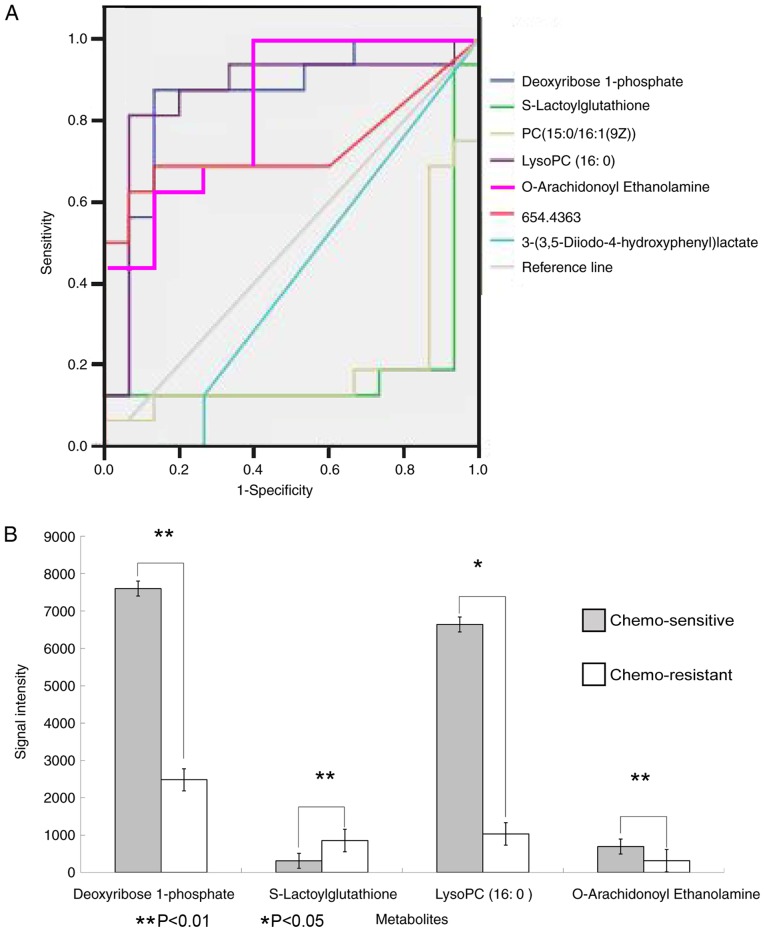
Verification
Claims the paper makes
The claims and statistics of this paper haven’t been checked yet.
Run the check — free, no account needed. It reads the open-access text and checks the sources it cites.
Claims other papers make about this one
Each is checked against this paper’s own text: does it say what the citing paper says it does?
The cited source says what the claim attributes to it.
In the citing paper
“Besides, deoxyribose 1-phosphate and S-lactoylglutathione were independently correlated with chemosensitivity by multivariate regression analysis.”
From Bioinformatics Analysis and Validation of Potential Markers Associated with Prediction and Prognosis of Gastric Cancer (2024) · cites this paper as [76]
The cited source says what the claim attributes to it.
In the citing paper
“LC-MS analysis found that four serum metabolites (Deoxyribose 1-phosphate, S-lactoylglutathione, lysoPC (16:0), and O-arachidonoyl ethanolamine) revealed potent divergences in patients with chemo-sensitive and chemo-resistant tumors with a sensitivity and specificity of 82.5%.”
From Bioinformatics Analysis and Validation of Potential Markers Associated with Prediction and Prognosis of Gastric Cancer (2024) · cites this paper as [76]
Self-check
Percentages, sums and reported differences re-computed from the paper’s own numbers.
The self-check needs the paper’s full text.
Citations
Cites
Bray, F., Ferlay, J., Soerjomataram, I., Siegel, R. L., Torre, L. A., & Jemal, A. (2018) · CA: A Cancer Journal for Clinicians · doi:10.3322/caac.21492 · Cited by 84,109
New response evaluation criteria in solid tumours: revised RECIST guideline (version 1.1)
Eisenhauer, E. A., Therasse, P., Bogaerts, J., Schwartz, L. H., Sargent, D., Ford, R., Dancey, J., Arbuck, S., Gwyther, S., Mooney, M., et al. (2009) · European Journal of Cancer · doi:10.1016/j.ejca.2008.10.026 · Cited by 29,534
Global cancer statistics, 2012
Torre, L. A., Bray, F., Siegel, R. L., Ferlay, J., Lortet‐Tieulent, J., & Jemal, A. (2015) · CA A Cancer Journal for Clinicians · doi:10.3322/caac.21262 · Cited by 27,243
Estimates of worldwide burden of cancer in 2008: GLOBOCAN 2008
Ferlay, J., Shin, H., Bray, F., Forman, D., Mathers, C. D., & Parkin, D. M. (2010) · International Journal of Cancer · doi:10.1002/ijc.25516 · Cited by 21,468
Global Cancer Statistics, 2002
Parkin, D. M., Bray, F., Ferlay, J., & Pisani, P. (2005) · CA A Cancer Journal for Clinicians · doi:10.3322/canjclin.55.2.74 · Cited by 18,711
Perioperative Chemotherapy versus Surgery Alone for Resectable Gastroesophageal Cancer
Cunningham, D., Allum, W., Stenning, S. P., Thompson, J. N., van de Velde, C. J. �., Nicolson, M. C., Scarffe, J. H., Lofts, F. J., Falk, S. J., Iveson, T. J., et al. (2006) · New England Journal of Medicine · doi:10.1056/nejmoa055531 · Cited by 6,341
Systematic Review and Meta-analysis
Garg, A. X., Hackam, D. G., & Tonelli, M. A. (2008) · Clinical Journal of the American Society of Nephrology · doi:10.2215/cjn.01430307 · Cited by 2,293
Ychou, M., Boige, V., Pignon, J., Conroy, T., Bouché, O., Lebreton, G., Ducourtieux, M., Bedenne, L., Fabre, J.-M., Saint‐Aubert, B., et al. (2011) · Journal of Clinical Oncology · doi:10.1200/jco.2010.33.0597 · Cited by 2,127
Regulation of pyruvate metabolism and human disease
Gray, L. R., Tompkins, S. C., & Taylor, E. B. (2013) · Cellular and Molecular Life Sciences · doi:10.1007/s00018-013-1539-2 · Cited by 990
Gastric Cancer, Version 3.2016, NCCN Clinical Practice Guidelines in Oncology
Ajani, J. A., D’Amico, T. A., Almhanna, K., Bentrem, D. J., Chao, J., Das, P., Denlinger, C. S., Fanta, P. T., Farjah, F., Fuchs, C. S., et al. (2016) · Journal of the National Comprehensive Cancer Network · doi:10.6004/jnccn.2016.0137 · Cited by 931
Research works printed but not linked: 1
- [37]Salway JG Metabolism at a Glance 3rd Wiley-Blackwell Oxford p128 2013
Cited by
Gmeiner, W. H., & Okechukwu, C. C. (2023) · Cancer Drug Resistance · doi:10.20517/cdr.2022.136 · Cited by 123
Matsuoka, T., & Yashiro, M. (2024) · International Journal of Molecular Sciences · doi:10.3390/ijms25115880 · Cited by 83
“Recently, a study examined the role of metabolite profiles in sensitivity to neoadjuvant chemotherapy in GC [76].”
BackgroundMetabolomics and metabolites in cancer diagnosis and treatment
Cai, M., Liu, H., Shao, C., Li, T., Jin, J., Liang, Y., Wang, J., Cao, J., Yang, B. K., He, Q., et al. (2025) · Molecular Biomedicine · doi:10.1186/s43556-025-00362-8 · Cited by 33
Metabolic Shades of S-D-Lactoylglutathione
Kalapos, M. P., Antognelli, C., & Lidia de, B. A. R. I. (2022) · Antioxidants · doi:10.3390/antiox11051005 · Cited by 20
Defining the landscape of metabolic dysregulations in cancer metastasis
Kader, S. A., Dib, S. S., Achkar, I. W., Thareja, G., Suhre, K., Rafii, A., & Halama, A. (2021) · Clinical & Experimental Metastasis · doi:10.1007/s10585-021-10140-9 · Cited by 23
Metadata
- Authors
- Wang, D., Li, W., Yin, L., Du, Y., Zhang, S., & Suo, J.
- Affiliations
- First Hospital of Jilin University (CN)
- Department of Gastrointestinal Surgery, First Hospital of Jilin University, Changchun, Jilin 130021, P.R. China
- Corresponding author
- Zhang, Shaopeng
- Suo, Jian
- Venue
- Oncology Letters
- Publisher
- Spandidos Publications
- Published
- 2020-01-24
- Volume
- 19
- Issue
- 3
- Pages
- 2231-2242
- ISSN
- 1792-1074 (ISSN-L)
- 1792-1082
- PMC
- PMC7039117
- OpenAlex
- W3002528560
- Cited by
- 12
- References
- 50
- Citations by year
- 2025: 3 · 2024: 3 · 2023: 2 · 2022: 2 · 2021: 2
- FWCI
- 0.85
- Type
- journal article
- Language
- en
- Open access
- diamond
- doi.org
- Licence
- cc-by-nc-nd
- Locations
- Oncology Letters (publishedVersion, cc-by-nc-nd)
- PubMed Central (publishedVersion, cc-by-nc-nd)
- PubMed (publishedVersion)
- Funders
- Jilin Scientific and Technological Development Program
- Topics
- Health Sciences › Medicine › Oncology › Gastric Cancer Management and Outcomes
- Life Sciences › Biochemistry, Genetics and Molecular Biology › Molecular Biology › Metabolomics and Mass Spectrometry Studies
- Life Sciences › Biochemistry, Genetics and Molecular Biology › Cancer Research › Cancer, Hypoxia, and Metabolism
- Keywords
- gastric cancer, neoadjuvant chemotherapy, chemosensitivity, serum metabolites, predictive biomarkers, oxaliplatin, tegafur, continuous hyperthermic peritoneal perfusion, cisplatin, lysophosphatidylcholine, metabolomics
About these checks
Registry, retraction, Cites and statistics results are computed, not judged, with one exception: a printed reference that no index lists is read once by a model before it counts as a citation error. Claims are extracted by a model and kept only when their quote appears verbatim in the text; each cited source is then checked, with a model’s help, for whether it says what the claim relies on. Those verdicts can be wrong — read the claim’s quote and the cited source before relying on one.
Statistics and arithmetic are recomputed, not judged.
Confidence bands are shown only for fields calibrated on our annotated test set. None is calibrated yet, so no band is shown.
What counts as a claim ›How we measure confidence ›How we check this ›
Are you an author, or do you see a problem with this page? Request a review
How to cite
Cite CoChat for the checks on this page, and the paper for its own findings.
- This page
- CoChat. (2026). Citation check: Association of serum levels of deoxyribose 1‑phosphate and S‑lactoylglutathione with neoadjuvant chemotherapy sensitivity in patients with gastric cancer: A metabolomics study. https://app.cochat.ai/papers/10.3892/ol.2020.11350
- The paper
- Wang, D., Li, W., Yin, L., Du, Y., Zhang, S., & Suo, J. (2020). Association of serum levels of deoxyribose 1‑phosphate and S‑lactoylglutathione with neoadjuvant chemotherapy sensitivity in patients with gastric cancer: A metabolomics study. Oncology Letters. https://doi.org/10.3892/ol.2020.11350
