

The DOI matches its Crossref record; 30 of the 30 references it cites were found in a registry or an index; none of the 36 sources its claims cite is checked for support yet.
Imaging of the pituitary: Recent advances
Open accessAbstract
Glucagon-like peptide–1 (GLP-1) is an intestinal incretin hormone released from the endocrine L-cells of the hind gut which augments glucose-mediated insulin release from the beta cells of the pancreas. Native human GLP-1 is a transcriptional product of the proglucagon gene. This gene is secreted in response to food intake and contains 30 amino acids.[1] The biologically active forms of GLP-1 are GLP-1 (7-37) and GLP-1 (7-36) both of which exert their action by binding to the GLP-1 receptor which is a G-protein coupled receptor. In addition, GLP-1 hormone also suppresses glucagon secretion from the pancreas which in turn reduces hepatic glucose production, and GLP-1 also slows down gastric emptying.[2] A second incretin called glucose-dependent insulinotropic polypeptide (GIP) is produced by the K cells in the duodenum and jejunum. Like GLP-1, GIP is released in response to nutrients and is quickly degraded by dipeptidyl peptidase-4 (DPP4) enzyme. The primary difference between GLP-1 and GIP is in its effect on the alfa cells in the production of glucagon. In the presence of hyperglycemia, GIP has a glucagonostatic affect like GLP-1 but in the presence of normoglycemia or hypoglycemia GIP has a glucagonotropic effect unlike GLP-1. The differential effects of both these incretins are given in Figure 1.Figure 1: Cartoon showing the similarities and differences between the actions of glucagon like peptide-1 receptor agonism and glucose dependent insulinotropic polypeptide receptor agonismNative GLP-1 is considered unsuitable for clinical use because of its short half-life of <2 min. The half-life is extremely short because of two major reasons. First, both endogenous and exogenous GLP-1 are rapidly degraded and inactivated by the removal of a dipeptide at N-terminus by a circulating enzyme named DPP-4. Second because of the small size of the peptide, it is quickly eliminated by the process of filtration from the kidneys.[3] The development of clinically useful longer acting GLP-1 receptor agonists has been an area of intense and incremental successes in peptide engineering. The initial strategies used included the use of naturally occurring DPP-4 resistant GLP-1 agonists (e.g., Exendin-4), substitution of the second amino acid in native GLP-1 with another amino acid which is not recognized by DPP-4 enzyme (e.g., albiglutide containing glycine in the second position), conjugation of GLP-1 with larger molecules which shield them from DPP-4 cleavage (e.g., liraglutide containing a C16 fatty acid). A further increase in half-life was made possible when these DPP-4 resistant analogs are conjugated with larger moieties which prevented renal loss in the glomerular filtrate (e.g., liraglutide with C16 fatty acid, albiglutide with human albumin, and dulaglutide with modified Fc fraction of human immunoglobulin G). A third strategy has been to incorporate resistant GLP-1 analogs into polymers and other substances which enable sustained release (e.g., Exenatide LAR).[4] In the last few years, we have seen two additional marvels of peptide engineering in the space of GLP-1 analog pharmacotherapy. First, it is the design of peptides capable of activating more than one target receptor. The most advanced of these agents is tirzepatide which is capable of being a GIP receptor (GIP-R) and a GLP-1 receptor (GLP-1-R) agonist at the same time. Combined activation of both these incretin receptors leads to synergy and additive benefits both in terms of glucose control and weight reduction. These added incremental benefits can be explained by three mechanisms. First, dual agonism of the incretin receptors in the brain leads to enhanced appetite suppression and greater degree of weight loss. Second, the dual agonism on the beta cells of the pancreas leads to greater glucose control because of an increase in glucose-dependent insulin secretion. Third, it is proposed that GIP-R agonism leads to improved white adipose tissue functions and increased lipid buffering capacity which in turn protects the vasculature and liver from “spillover” of postprandial lipids.[5] In this issue of the journal, Dutta et al. bring out an early metanalysis of the therapeutic benefits of once weekly subcutaneous tirzepatide when compared with active controls. They included six randomized control trials (RCT) with 3484 patients to conclude better HbA1c lowering (0.7%) with better odds of getting to an Hba1c <6.5% (OR-4.3) and better weight reduction (8.6 kg) when compared to active controls which included potent active agents such as dulaglutide, weekly semaglutide, and basal insulins. There was no significant difference in adverse events or serious adverse events in these studies between tirzepatide and active controls. Tirzepatide is an imbalanced dual agonist with more GIP-R activity compared to GLP-1-R activity. This may explain the exceptionally better glucose and weight control when compared to standard GLP-1-R agonists. In direct comparison with GLP-1
Overview
CoChat Summary
TL;DR
This narrative review argues that MRI is the examination of choice for hypothalamic-pituitary disease and surveys advanced techniques (dynamic contrast-enhanced MRI, 3T MRI, magnetization transfer, DWI, MR spectroscopy, FDG-PET, SPECT, intraoperative MRI and ultrasonography) for differentiating sellar and parasellar lesions. It concludes that DWI should become part of routine macroadenoma assessment for surgical planning.
Key findings
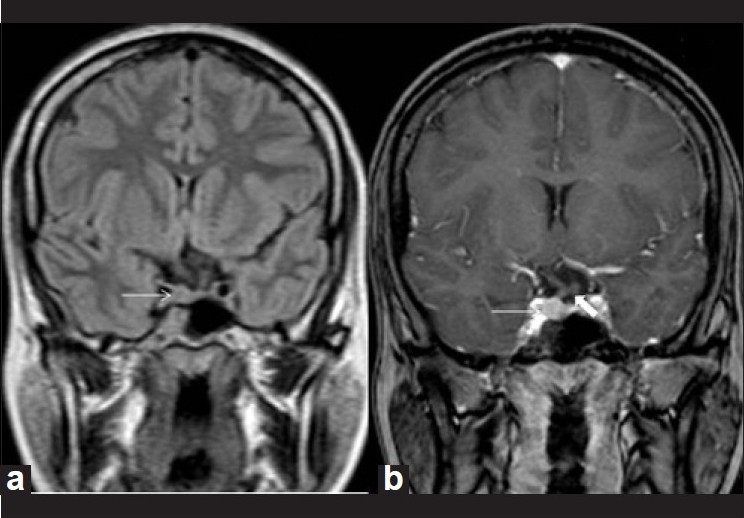
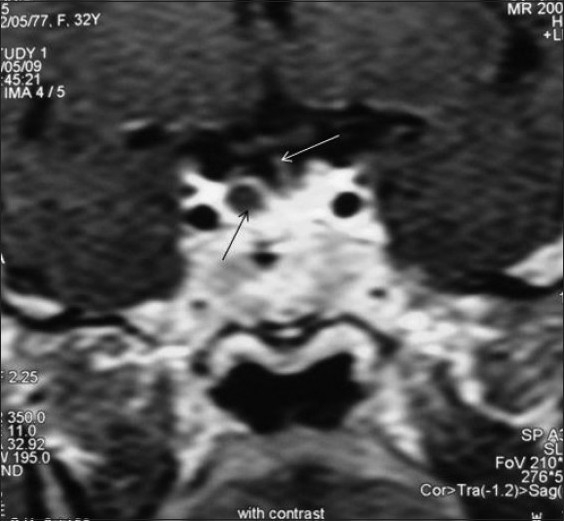
- Dynamic contrast-enhanced MRI is described as the best imaging tool for pituitary adenomas: after a 0.05 mmol/kg gadolinium bolus, six sets of three coronal images are acquired every 10 seconds; maximum contrast between normal gland and microadenoma occurs ~30–60 seconds post-injection, with microadenomas appearing as nonenhancing (dark) lesions, and peak adenoma enhancement at 60–200 seconds.
- Magnetization transfer ratio (MTR) distinguishes adenoma subtypes: prolactin-secreting adenomas have significantly higher MTR than normal gland (high signal on MT images), while nonsecreting adenomas have lower MTR — relevant because prolactinomas are treated medically and nonsecreting adenomas surgically.
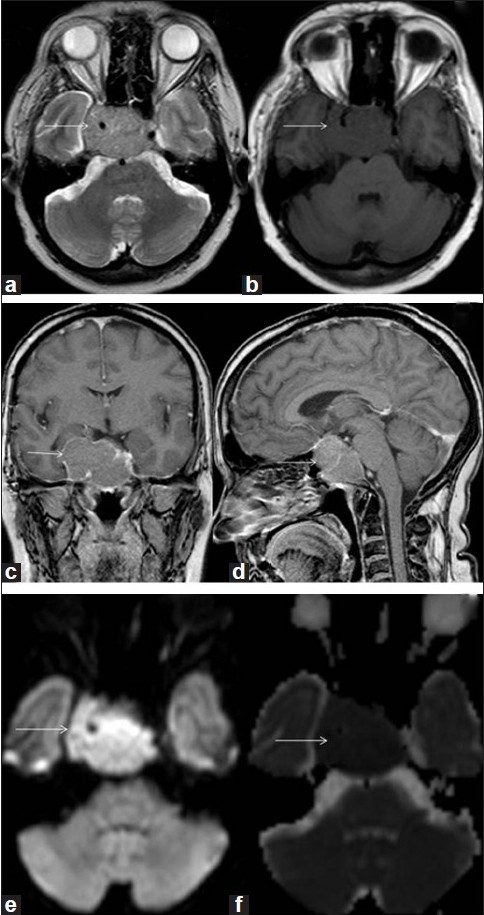
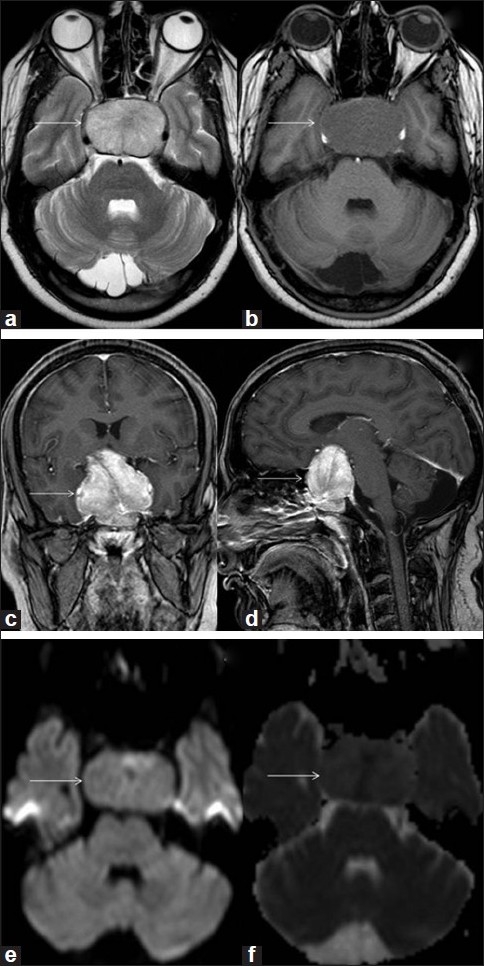
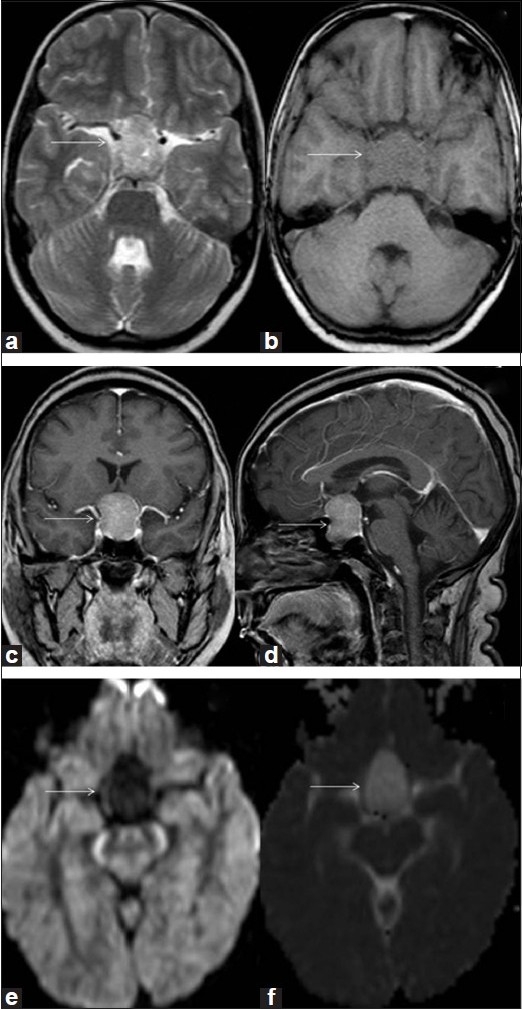
- DWI/ADC characterizes macroadenoma consistency: soft adenomas had ADC (0.663±0.109)×10⁻³ mm²/sec, intermediate (0.842±0.081)×10⁻³ mm²/sec, and hard (1.363±0.259)×10⁻³ mm²/sec; about 10% of macroadenomas are hard/fibrotic and difficult to remove endoscopically. Figure captions report illustrative values of (0.566±0.109), (0.872±0.138) and (1.412±0.125)×10⁻³ mm²/sec for soft, intermediate and hard lesions respectively.
- IBZM-SPECT had poor sensitivity for visualizing prolactin- and growth hormone-secreting macroadenomas in a study of 15 patients with pituitary tumors; FDG-PET showed highest uptake in nonfunctional adenomas and can distinguish residual/recurrent tumor (increased uptake) from postoperative or radiation change (decreased uptake).
Methods
- Narrative review of pituitary imaging modalities; no primary data collection or systematic search strategy is described.
- Synthesizes normal anatomy and physiology (Elster's rule of 6, 8, 10, 12 mm for gland height by age; normal stalk thickness 2 mm, not exceeding 4 mm or the width of the basilar artery) with published literature on CT, MRI and advanced MR techniques, PET, SPECT and intraoperative imaging.
- Cited primary evidence includes Wolfsberger et al.'s 3T MRI study of cavernous sinus invasion in 42 patients and a 15-patient IBZM-SPECT study.
Limitations
- Stated: the role of 3T MRI is "under an evolutionary stage" and needs further refinement with newer sequences to confirm microadenomas lacking contour abnormalities and to identify their number and location; Wolfsberger et al. did not compare 3T with 1.5T MRI for a specific tumor type.
- Stated: no single radiological feature is characteristic of lymphocytic hypophysitis, and until a specific antibody or characteristic MR feature is identified, diagnosis must rely on histologic study.
- Evident from the text: this is a narrative review without a described search strategy, quality appraisal, or primary imaging data of its own; some quantitative ADC and enhancement figures come from figure captions rather than a stated prospective cohort, so the supporting evidence base is not fully characterized.
Model-written summary. Check it against the paper before relying on it.
Integrity signals
Registry
Cites
Statistics
Figures
Verification
Claims the paper makes
0 Valid · 0 Not valid · 29 Not checked · 4 Own results and interpretations
In the paper
“Dynamic contrast MRI has been proven to be the best imaging tool in the evaluation of pituitary adenomas.”
§ Imaging of the pituitary: Recent advances > IMAGING MODALITIES
What the sources say
- Not checked yetcites [13] Cheemum L Walter K Walter JM Laurence EB The sella turcica and parasellar region Magnetic resonance imaging of the brain and spine 2002 2 Philadelphia WW Lippincott Co 1283 362
boosted- Asserted: passes — The authors put it forward as true.
- Checkable: passes — It can be checked against evidence.
- Load-bearing: passes — The paper’s conclusions depend on it.
- Based: passes — The paper gives a reason why it holds.
In the paper
“Uptake of FDG is highest in nonfunctional adenomas.”
§ Imaging of the pituitary: Recent advances > IMAGING MODALITIES
What the sources say
- Not checked yetcites [18] Gao R Isoda H Tanaka T Inagawa S Takeda H Takehara Y Dynamic gadolinium enhanced MR imaging of pituitary adenomas: Usefulness of sequential sagittal and coronal plane images Eur J Radiol 2001 39 139 46 11566239
plainstates an association- Asserted: passes — The authors put it forward as true.
- Checkable: passes — It can be checked against evidence.
- Load-bearing: unclear — It is unclear whether the paper’s conclusions depend on it.
- Based: passes — The paper gives a reason why it holds.
In the paper
“The maximum image contrast between the normal pituitary tissue and microadenomas is attained about 30-60 seconds after the bolus injection of the intravenous contrast.”
§ Imaging of the pituitary: Recent advances > IMAGING MODALITIES
What the sources say
- Not checked yetcites [13] Cheemum L Walter K Walter JM Laurence EB The sella turcica and parasellar region Magnetic resonance imaging of the brain and spine 2002 2 Philadelphia WW Lippincott Co 1283 362
plainstates an association- Asserted: passes — The authors put it forward as true.
- Checkable: passes — It can be checked against evidence.
- Load-bearing: unclear — It is unclear whether the paper’s conclusions depend on it.
- Based: passes — The paper gives a reason why it holds.
In the paper
“Increased MTR values are highly suggestive of persistent adenomatous tissue.”
§ Imaging of the pituitary: Recent advances > IMAGING MODALITIES
What the sources say
- Not checked yetcites [25] Maria IA Dimitrios NK Magnetization transfer imaging of the pituitary gland Hormones 2003 2 98 102 17003008
boostedstates an association- Asserted: passes — The authors put it forward as true.
- Checkable: passes — It can be checked against evidence.
- Load-bearing: unclear — It is unclear whether the paper’s conclusions depend on it.
- Based: passes — The paper gives a reason why it holds.
None of the sources cited for this claim have been checked yet.
In the paper
“Proton MR spectroscopy can be helpful in differentiating various types of lesions involving pituitary-hypothalamic axis.”
§ Imaging of the pituitary: Recent advances > IMAGING MODALITIES
What the sources say
- Not checked yetcites [27] Sutton LN Wang ZJ Wehrli SL Marwaha S Molloy P Phillips PC Proton spectroscopy of suprasellar tumors in pediatric patients Neurosurgery 1997 41 388 94 9257306
- Not checked yetcites [28] Kendi TK Caglar S Huvaj S Bademci G Kendi M Alparslan S Suprasellar germ cell tumor with subarachnoid seeding MR and MR spectroscopy findings Clin Imaging 2004 28 404 7 15531139
plainstates a possible cause- Asserted: passes — The authors put it forward as true.
- Checkable: passes — It can be checked against evidence.
- Load-bearing: unclear — It is unclear whether the paper’s conclusions depend on it.
- Based: passes — The paper gives a reason why it holds.
10 more claims
Create a free account to see all 33 claims and to verify the 36 references still open.
- Probably not a substantial claim. 1
- It may state two separate claims as one. 17
Self-check
Percentages, sums and reported differences re-computed from the paper’s own numbers.
Each contradiction between two passages listed here was confirmed by an independent check.
Rated minor: it would not touch a result — a value no result rests on, a p-value that stays on the same side of the significance level, or a conflict that is clerical, resolved elsewhere in the paper, or outside its own findings.
In the paper
§ Imaging of the pituitary: Recent advances > IMAGING MODALITIES
“Note that the lesion is more conspicuous on dynamic contrast scan compared to the routine contrast scan (seen in figure 5b).”
§ Imaging of the pituitary: Recent advances > IMAGING MODALITIES
“Figure: Figure 5 Pituitary macroadenoma with hard consistency. Axial T1W (a) and T2W (b) images demonstrat a large inhomogeneous, T1-hypointense, T2- hyperintense pituitary mass (arrow)”
Citations
Cites
Modern imaging of the pituitary.
Elster, A. D. (1993) · Radiology · doi:10.1148/radiology.187.1.8451394 · Cited by 322
Posterior pituitary gland: appearance on MR images in normal and pathologic states.
Colombo, N., Berry, I., Kucharczyk, J. R., Kucharczyk, W., de Groot, J., Larson, T. C., III, Norman, D. M., & Newton, T. H. (1987) · Radiology · doi:10.1148/radiology.165.2.3659370 · Cited by 174
Gutenberg, A., Larsen, J., Lupi, I., Rohde, V., & Caturegli, P. (2009) · American Journal of Neuroradiology · doi:10.3174/ajnr.a1714 · Cited by 164
Pierallini, A., Caramia, F., Falcone, C., Tinelli, E., Paonessa, A., Ciddio, A. B., Fiorelli, M., Bianco, F., Natalizi, S., Ferrante, L., et al. (2006) · Radiology · doi:10.1148/radiol.2383042204 · Cited by 162
MR imaging of cavernous sinus involvement by pituitary adenomas
Scotti, G., Yu, C., Dillon, W. P., Norman, D. M., Colombo, N., Newton, T. H., Groot, J. D., & Wilson, C. B. (1988) · American Journal of Roentgenology · doi:10.2214/ajr.151.4.799 · Cited by 162
Dwyer, A. J., Frank, J. A., Doppman, J. L., Oldfield, E. H., Hickey, A. M., Cutler, G. B., Loriaux, D. L., & Schiable, T. F. (1987) · Radiology · doi:10.1148/radiology.163.2.3562821 · Cited by 160
MR imaging of the sellar and juxtasellar regions.
Johnsen, D., Woodruff, W. W., Allen, I. S., J, P., Funkhouser, G., & Coleman, L. (1991) · Radiographics · doi:10.1148/radiographics.11.5.1947311 · Cited by 142
Endoscopic Transsphenoidal Pituitary Surgery with Intraoperative Magnetic Resonance Imaging
Schwartz, T. H., Stieg, P. E., & Anand, V. K. (2006) · Operative Neurosurgery · doi:10.1227/01.neu.0000193927.49862.b6 · Cited by 139
Normal and abnormal pituitary glands: gadopentetate dimeglumine-enhanced MR imaging.
Sakamoto, Y., Takahashi, M., Korogi, Y., BUSSAKA, H., & Ushio, Y. (1991) · Radiology · doi:10.1148/radiology.178.2.1987606 · Cited by 131
Application of three-tesla magnetic resonance imaging for diagnosis and surgery of sellar lesions
Wolfsberger, S., Ba‐Ssalamah, A., Pinker, K., Mlynárik, V., Czech, T., Knosp, E., & Trattnig, S. (2004) · Journal of neurosurgery · doi:10.3171/jns.2004.100.2.0278 · Cited by 117
Research works printed but not linked: 2
- [12]Latchaw RE Roppole HM Radiographic evaluation of the normal sella turcica and the pituitary gland Radiological Diagnosis Imaging Intervention 1986 3 Philadelphia JB Lippincott Co 1 7
- [13]Cheemum L Walter K Walter JM Laurence EB The sella turcica and parasellar region Magnetic resonance imaging of the brain and spine 2002 2 Philadelphia WW Lippincott Co 1283 362
Cited by
Items 101–106 of 106
Amalina, F. A. B., Kurniasari, N., Susilo, R. I., & Novida, H. (2025) · Magna Scientia Advanced Research and Reviews · doi:10.30574/msarr.2025.15.2.0152
Tumeurs sécrétantes et hyperfonctionnements surrénaliens
Meziane, Y., Othmani, W., Kabas, R. M., Bomba, B., Ngom, K., Morland, D., & Hoeffel, C. C. (2026) · EMC - Radiologie et imagerie médicale - Génito-urinaire - Gynéco-obstétricale - Mammaire · doi:10.1016/s1879-8543(25)61407-8
Pre-operative imaging assessment of pituitary adenomas: What the radiologist needs to know
Madhavan, S., Ang, B.-T., Lim, D. S. T., Kheok, S. W., Ling, C. L., Pong, W. C., & Chen, R. C. (2026) · World Neurosurgery X · doi:10.1016/j.wnsx.2026.100601
Kommaraju, J. S. (2025) · Archives of Medical Reports · doi:10.26524/amr.2025.2.3
Postoperative Pituitary MRI Findings in Acromegaly: A Pictorial Review
Daskareh, M., Abbasi, F., Zadeh, N. E., Shahmaei, V., & Ghorbani, M. (2026) · Diagnostics · doi:10.3390/diagnostics16162582
The Pituitary Gland's Size and Volume in Relation to Age and Gender: MRI Study
Hatgaonkar, A. M., & Hatgaonkar, K. (2017) · International Journal of Pharmaceutical and Biological Science Archive
Metadata
- Authors
- Chaudhary, V., & Bano, S.
- Affiliations
- Maulana Azad Medical College (IN)
- Venue
- Indian Journal of Endocrinology and Metabolism
- Published
- 2011
- Volume
- 15
- Issue
- 7
- Pages
- 216
- ISSN
- 2230-8210 (ISSN-L)
- PMC
- PMC3183511
- OpenAlex
- W2123986057
- Semantic Scholar
- 2dd57a353424c201164d7a625949a474822b4b96
- Cited by
- 106
- References
- 30
- Citations by year
- 2026: 6 · 2025: 12 · 2024: 6 · 2023: 12 · 2022: 6 · 2021: 8 · 2020: 6 · 2019: 11 · 2018: 6 · 2017: 11 · 2016: 6 · 2015: 4 · 2014: 3 · 2013: 6 · 2012: 2
- FWCI
- 2.44
- Type
- journal article
- Language
- en
- Open access
- diamond
- doi.org
- Licence
- cc-by-nc-sa
- Locations
- Indian Journal of Endocrinology and Metabolism (publishedVersion, cc-by-nc-sa)
- PubMed Central (publishedVersion, cc-by-nc-sa)
- Europe PMC (PubMed Central) (publishedVersion, cc-by-nc-sa)
- PubMed (publishedVersion)
- DOAJ (DOAJ: Directory of Open Access Journals) (submittedVersion, cc-by-sa)
- Topics
- Health Sciences › Medicine › Endocrinology, Diabetes and Metabolism › Pituitary Gland Disorders and Treatments
- Health Sciences › Medicine › Endocrinology, Diabetes and Metabolism › Diabetes Treatment and Management
- Health Sciences › Medicine › Endocrinology, Diabetes and Metabolism › Pancreatic function and diabetes
- Keywords
- pituitary imaging, GLP-1 receptor agonists, glucose-dependent insulinotropic polypeptide, incretins, dipeptidyl peptidase IV, GLP-1 receptor, GIP receptor, peptide engineering, exendin-4, GLP-1 analogues, GLP-1 receptor antagonists
About these checks
Registry, retraction, Cites and statistics results are computed, not judged, with one exception: a printed reference that no index lists is read once by a model before it counts as a citation error. Claims are extracted by a model and kept only when their quote appears verbatim in the text; each cited source is then checked, with a model’s help, for whether it says what the claim relies on. Those verdicts can be wrong — read the claim’s quote and the cited source before relying on one.
A language model drew the claims from the paper on 2026-11-14, under version 3 of the claim definition (model deepseek-v4.1-flash, prompt extract-v3).
A second model labelled each claim on 2026-11-14 (model jev-1.13-20260917, definition revision gold-guideline-v0.2).
Statistics and arithmetic are recomputed, not judged.
Confidence bands are shown only for fields calibrated on our annotated test set. None is calibrated yet, so no band is shown.
What counts as a claim ›How we measure confidence ›How we check this ›
Are you an author, or do you see a problem with this page? Request a review
Data sources
Bibliographic data: Semantic Scholar, OpenAlex, Crossref.
Contains information from the Semantic Scholar Academic Graph Datasets, made available under the ODC Attribution License (ODC-BY 1.0).
Semantic Scholar’s data is described in: Kinney, R., et al. (2023). The Semantic Scholar Open Data Platform. arXiv:2301.10140.
