

The DOI matches its Crossref record; 52 of the 52 references it cites were found in a registry or an index.
Maintenance of Head and Neck Tumor On-Chip: Gateway to Personalized Treatment?
Open accessAbstract
AIM: Head and neck squamous cell carcinomas (HNSCC) are solid tumors with low overall survival (40-60%). In a move toward personalized medicine, maintenance of tumor biopsies in microfluidic tissue culture devices is being developed. METHODOLOGY/RESULTS: HNSCC (n = 15) was dissected (5-10 mg) and either analyzed immediately or cultured in a microfluidic device (37°C) for 48 h. No difference was observed in morphology between pre- and postculture specimens. Dissociated samples were analyzed using trypan blue exclusion (viability), propidium iodide flow cytometry (death) and MTS assay (proliferation) with no significant difference observed highlighting tissue maintenance. Computational fluid dynamics showed laminar flow within the system. CONCLUSION: The microfluidic culture system successfully maintained HNSCC for 48 h, the culture system will allow testing of different treatment modalities with response monitoring.
Overview
The claims and statistics of this paper haven’t been checked yet.
Run the check — free, no account needed. It reads the open-access text and checks the sources it cites.
Integrity signals
Registry
Cites
Statistics
Figures
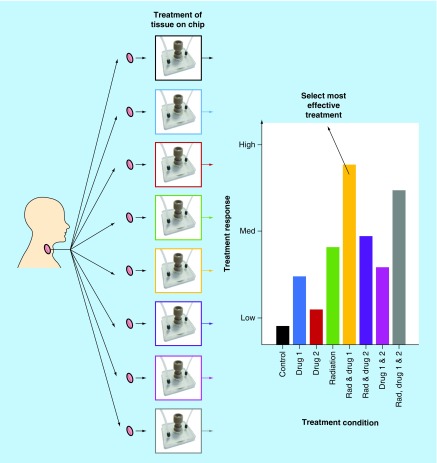
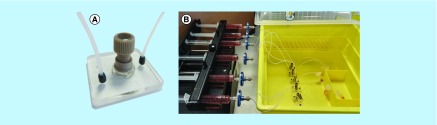
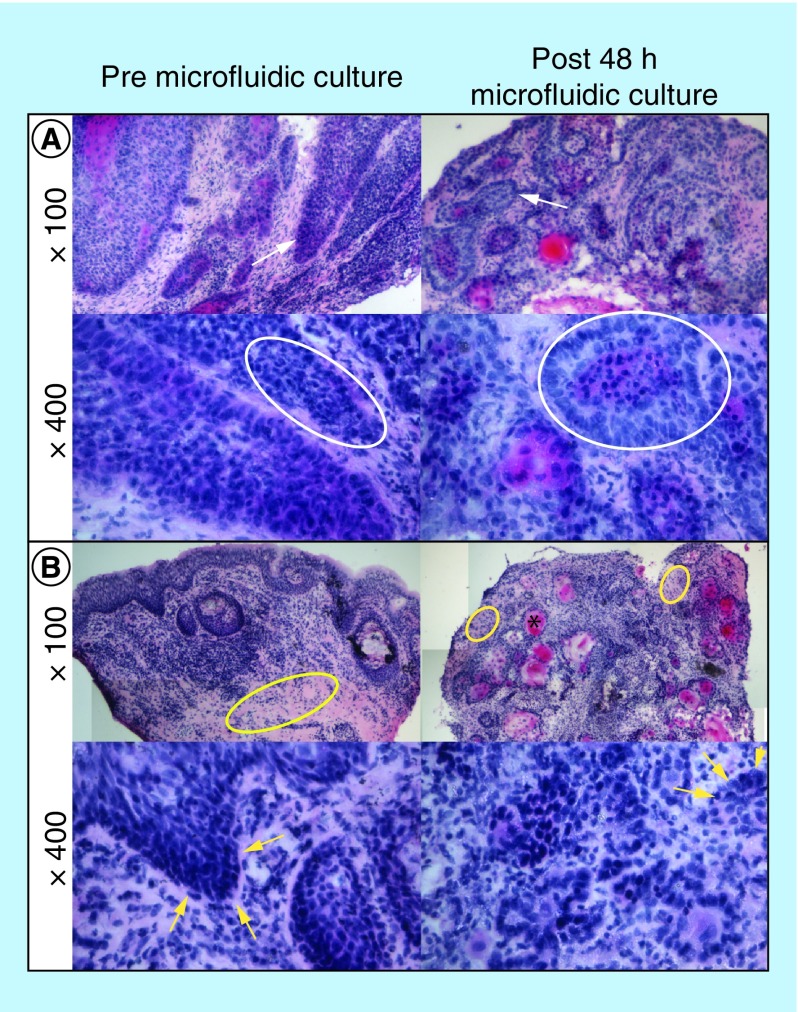
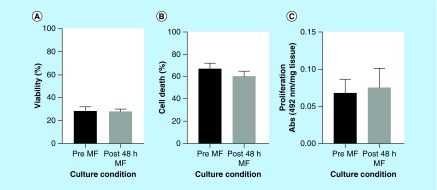
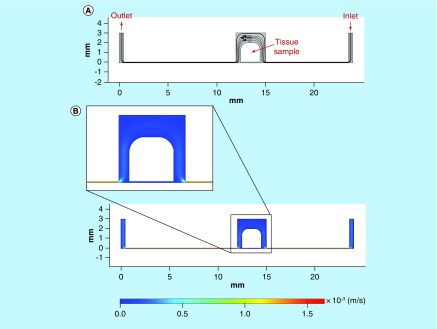
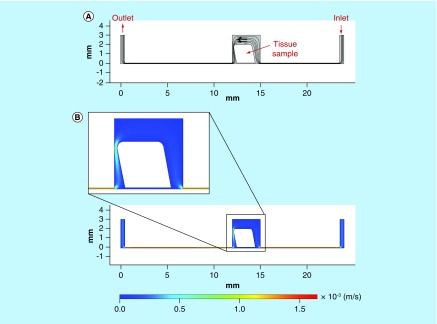
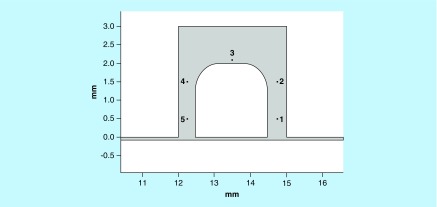
Verification
Claims the paper makes
The claims and statistics of this paper haven’t been checked yet.
Run the check — free, no account needed. It reads the open-access text and checks the sources it cites.
Claims other papers make about this one
Each is checked against this paper’s own text: does it say what the citing paper says it does?
The cited source says what the claim attributes to it.
In the citing paper
“For instance, Bower et al. have described an experiment in which they were able to sustain the viability of head and neck cancerous tissue for 48 h in a simple microfluidic chamber [197].”
From The Tumor-on-Chip: Recent Advances in the Development of Microfluidic Systems to Recapitulate the Physiology of Solid Tumors (2019) · cites this paper as [197]
Self-check
Percentages, sums and reported differences re-computed from the paper’s own numbers.
The self-check needs the paper’s full text.
Citations
Cites
The origins and the future of microfluidics
Whitesides, G. M. (2006) · Nature · doi:10.1038/nature05058 · Cited by 9,687
Radiotherapy plus Cetuximab for Squamous-Cell Carcinoma of the Head and Neck
Bonner, J. A., Harari, P. M., Giralt, J., Azarnia, N., Shin, D. M., Cohen, R. B., Jones, C. U., Sur, R. K., Raben, D., Jassem, J., et al. (2006) · New England Journal of Medicine · doi:10.1056/nejmoa053422 · Cited by 5,109
The causes and consequences of genetic heterogeneity in cancer evolution
Burrell, R. A., McGranahan, N., Bartek, J., & Swanton, C. (2013) · Nature · doi:10.1038/nature12625 · Cited by 2,262
(2005) · Research Explorer (The University of Manchester) · Cited by 1,981
Head and Neck Squamous Cell Carcinoma: Update on Epidemiology, Diagnosis, and Treatment
Marur, S., & Forastiere, A. A. (2016) · Mayo Clinic Proceedings · doi:10.1016/j.mayocp.2015.12.017 · Cited by 1,188
Gut-on-a-Chip microenvironment induces human intestinal cells to undergo villus differentiation
Kim, H. J., & Ingber, D. E. (2013) · Integrative Biology · doi:10.1039/c3ib40126j · Cited by 750
The Onset of Turbulence in Pipe Flow
Avila, K., Moxey, D., de Lózar, A., Avila, M., Barkley, D., & Hof, B. (2011) · Science · doi:10.1126/science.1203223 · Cited by 640
Biotechnology at low Reynolds numbers
Brody, J. P., Yager, P., Goldstein, R. E., & Austin, R. H. (1996) · Biophysical Journal · doi:10.1016/s0006-3495(96)79538-3 · Cited by 517
Hickman, J. A., Graeser, R., Hoogt, R. D., Vidic, S., Brito, C., Gutekunst, M., & van der Kuip, H. (2014) · Biotechnology Journal · doi:10.1002/biot.201300492 · Cited by 405
Epidemiology of head and neck cancer: Magnitude of the problem
D�br�ssy, L. (2005) · Cancer and Metastasis Reviews · doi:10.1007/s10555-005-5044-4 · Cited by 322
Research works printed but not linked: 1
- Dawson A, Green V, Bower R, Greenman J. Microfluidics: towards personalised medicine in cancer therapy. Drug Target Rev. 3, 12–17 (2016).
Cited by
Sorted by citations
Trujillo-de Santiago, G., Flores-Garza, B. G., Tavares-Negrete, J. A., Lara-Mayorga, I. M., González-Gamboa, I., Zhang, Y. S., Rojas-Martínez, A., Ortiz-López, R., & Álvarez, M. M. (2019) · Materials · doi:10.3390/ma12182945 · Cited by 184
“have described an experiment in which they were able to sustain the viability of head and neck cancerous tissue for 48 h in a simple microfluidic chamber [197].”
BackgroundMachiels, J., Tao, Y., Burtness, B. A., Tahara, M., Licitra, L. F., Rischin, D., Waldron, J. N., Simon, C., Grégoire, V., Harrington, K. J., et al. (2020) · Future Oncology · doi:10.2217/fon-2020-0184 · Cited by 59
Kennedy, R., Kuvshinov, D., Sdrolia, A., Kuvshinova, E., Hilton, K., Crank, S., Beavis, A. W., Green, V., & Greenman, J. (2019) · Scientific Reports · doi:10.1038/s41598-019-42745-2 · Cited by 53
Self-citationRiley, A., Green, V., Cheah, R., McKenzie, G., Karsai, L., England, J. A., & Greenman, J. (2019) · BMC Cancer · doi:10.1186/s12885-019-5465-z · Cited by 50
Self-citationMicrofluidics for interrogating live intact tissues
Horowitz, L. F., Rodriguez, A. D., Ray, T. R., & Folch, A. (2020) · Microsystems & Nanoengineering · doi:10.1038/s41378-020-0164-0 · Cited by 43
Olubajo, F., Achawal, S., & Greenman, J. (2019) · Translational Oncology · doi:10.1016/j.tranon.2019.09.002 · Cited by 35
Self-citationDynamic Physiological Culture of Ex Vivo Human Tissue: A Systematic Review
Hughes, D. L., Hughes, A., Soonawalla, Z. F., Mukherjee, S., & O’Neill, E. (2021) · Cancers · doi:10.3390/cancers13122870 · Cited by 39
An Interphase Microfluidic Culture System for the Study of Ex Vivo Intestinal Tissue
Baydoun, M., Treizeibré, A., Follet, J., Benamrouz-Vanneste, S., Creusy, C., Dercourt, L., Delaire, B., Mouray, A., Viscogliosi, É., Certad, G., et al. (2020) · Micromachines · doi:10.3390/mi11020150 · Cited by 33
Affolter, A., Lammert, A., Kern, J., Scherl, C., & Rotter, N. (2021) · Frontiers in Cell and Developmental Biology · doi:10.3389/fcell.2021.666515 · Cited by 34
In vitro models for head and neck cancer: Current status and future perspective
Moya‐Garcia, C. R., Okuyama, H., Sadeghi, N., Li, J., Tabrizian, M., & Li‐Jessen, N. Y. K. (2022) · Frontiers in Oncology · doi:10.3389/fonc.2022.960340 · Cited by 28
Abdolahinia, E. D., & Han, X. (2023) · Cancers · doi:10.3390/cancers15174266 · Cited by 29
Technological Advances in Tumor-On-Chip Technology: From Bench to Bedside
Bērziņa, S., Harrison, A., Taly, V., & Xiao, W. (2021) · Cancers · doi:10.3390/cancers13164192 · Cited by 26
Pillai, S., Kwan, J. C., Yaziji, F., Yu, H., & Tran, S. D. (2023) · Cancers · doi:10.3390/cancers15153894 · Cited by 23
In Vitro Models of Head and Neck Cancer: From Primitive to Most Advanced
Arutyunyan, I. V., Jumaniyazova, E. D., Макаров, А. В., & Fatkhudinov, T. (2023) · Journal of Personalized Medicine · doi:10.3390/jpm13111575 · Cited by 23
A Microfluidic Organ-On-A-Chip: Into the Next Decade of Bone Tissue Engineering Applied in Dentistry
Syahruddin, M. H., Anggraeni, R., & Ana, I. D. (2023) · Future Science OA · doi:10.2144/fsoa-2023-0061 · Cited by 20
Rismanian, M., Saidi, M. S., & Kashaninejad, N. (2020) · Journal of Flow Chemistry · doi:10.1007/s41981-020-00104-7 · Cited by 17
Khalil, A. A., & Jameson, M. J. (2018) · Hormones and Cancer · doi:10.1007/s12672-018-0352-7 · Cited by 15
Gallegos-Martínez, S., Buentello, D. C., Pérez-Álvarez, K. A., Lara-Mayorga, I. M., Aceves-Colin, A. E., Zhang, Y. S., Santiago, G. T., & Álvarez, M. M. (2024) · Biofabrication · doi:10.1088/1758-5090/ad5765 · Cited by 15
Haigh, T., Beattie, H., Wade, M., England, J. A., Kuvshinov, D., Karsai, L., Greenman, J., & Green, V. (2023) · International Journal of Molecular Sciences · doi:10.3390/ijms25010071 · Cited by 11
Self-citationAdvancements in Microfluidic Organ-on-a-chip for Oral Medicine
Fan, S., Ge, Y., Li, B., Liu, P., & Liu, X. (2025) · International Dental Journal · doi:10.1016/j.identj.2025.100925 · Cited by 9
Looking to the Future of Organs-on-Chip
Greenman, J. (2017) · Future Science OA · doi:10.4155/fsoa-2017-0040 · Cited by 7
Self-citationExploring Mechanical Features of 3D Head and Neck Cancer Models
Evangelista, A., Scocozza, F., Conti, M., Auricchio, F., Conti, B., Dorati, R., Genta, I., Benazzo, M., & Pisani, S. (2025) · Journal of Functional Biomaterials · doi:10.3390/jfb16030074 · Cited by 7
Recent advances on cancer-on-chip models: Development of 3D tumors and tumor microenvironment
Moghimi, N., Hosseini, S. A., Poudineh, M., & Kohandel, M. (2022) · Bioprinting · doi:10.1016/j.bprint.2022.e00238 · Cited by 6
Foster, H., Wade, M., England, J. A., Greenman, J., & Green, V. (2021) · Organs-on-a-Chip · doi:10.1016/j.ooc.2021.100011 · Cited by 5
Self-citationBarry, A., Samuel, S. F., Hosni, I., Moursi, A., Feugere, L., Sennett, C., Deepak, S., Achawal, S., Rajaraman, C., Iles, A., et al. (2023) · Lab on a Chip · doi:10.1039/d3lc00204g · Cited by 7
Self-citationThree-dimensional in vitro models in head and neck cancer: current trends and applications
Amiri, M., Tabatabai, T. S., Seifi, Z., Rostaminasab, G., Mikaeili, A., Hosseini, F., & Rezakhani, L. (2025) · Medical Oncology · doi:10.1007/s12032-025-02737-x · Cited by 4
Green, V., Baldwin, L., England, J. A., Marshall, G. B., Frost, L. R., Moore, C. S., & Greenman, J. (2023) · Cancers · doi:10.3390/cancers15184575 · Cited by 3
Self-citationTaute, F., Homs-Corbera, A., & Gaudriault, P. (2021) · Open Research Europe · doi:10.12688/openreseurope.13335.1 · Cited by 2
A Microfludic Platform as An In Vitro Model for Biomedical Experimentation - A Cell Migration Study
Milivojević, N. N., Caballero, D., Carvalho, M. R., Kokanović, M., Živanović, M., Filipović, N., Reis, R. L., & Oliveira, J. M. (2021) · IEEE International Conference on Bioinformatics and Bioengineering (BIBE) · doi:10.1109/bibe52308.2021.9635498 · Cited by 2
Microfluidic Technologies for Head and Neck Cancer: From Single-Cell Analysis to Tumor-on-a-Chip
Yang, Y., & Wang, H. (2021) · Springer eBooks · doi:10.1007/978-3-030-69859-1_3 · Cited by 1
Development of a dual flow microfluidic device for the study of barrier systems
Baldwin, L. (2020) · Repository@Hull (Worktribe) (University of Hull) · Cited by 1
Pignataro, A. M., Schwarz, C. C., Wiecheć, E., Cordiale, A., Sasikumar, S., Jenssen, A. N., Ariyaberg, T., Khare, L. P., Apu, E. H., Roberg, K. B., et al. (2026) · Proceedings of the National Academy of Sciences · doi:10.64898/2026.01.16.699893
Development of Microfluidic Lab-on-Chip System for Cultivation of Cells and Tissues
Milivojević, N. N., Nikolić, D. D., Šeklić, D., Pešić, Ž. J., Živanović, M., & Filipović, N. (2021) · World Congress on Medical Physics and Biomedical Engineering, September 7 - 12, 2009, Munich, Germany · doi:10.1007/978-3-030-73909-6_81
Preclinical Cancer Models for the Evaluation of Immunotherapies: From Cell Lines to Animal Models
Pezeshki, P. S., & Rezaei, N. (2022) · Springer eBooks · doi:10.1007/978-3-030-80962-1_206-1
Preclinical Cancer Models for the Evaluation of Immunotherapies: From Cell Lines to Animal Models
Pezeshki, P. S., & Rezaei, N. (2025) · Springer eBooks · doi:10.1007/978-3-032-00767-4_206
In vitro head and neck cancer models for photodynamic and photothermal therapies
Egloff‐Juras, C., Meyer, M., Bezdetnaya, L., Phulpin, B., Dolivet, G., & Lassalle, H. (2026) · SLAS TECHNOLOGY · doi:10.1016/j.slast.2026.100435
Head and neck cancer and thyroid diseases-on-a-chip
Green, V. L., Greenman, J. H., England, J. A., & Greenman, J. (2026) · Elsevier eBooks · doi:10.1016/b978-0-443-16110-0.00028-5
Self-citation
Metadata
- Authors
- Bower, R., Green, V. L., Kuvshinova, E., Kuvshinov, D., Karsai, L., Crank, S. T., Stafford, N. D., & Greenman, J.
- Affiliations
- University of Hull (GB)
- University of Sheffield (GB)
- Hull Royal Infirmary (GB)
- Corresponding author
- Bower, Ruth
- Venue
- Future Science OA
- Publisher
- Informa UK Limited
- Published
- 2017-03-07
- Volume
- 3
- Issue
- 2
- Pages
- FSO174-FSO174
- ISSN
- 2056-5623 (ISSN-L)
- PMC
- PMC5481812
- OpenAlex
- W2593991334
- Cited by
- 38
- References
- 52
- Citations by year
- 2026: 4 · 2025: 4 · 2024: 1 · 2023: 7 · 2022: 3 · 2021: 8 · 2020: 5 · 2019: 4 · 2018: 1 · 2017: 1
- FWCI
- 1.35
- Type
- journal article
- Language
- en
- Open access
- gold
- doi.org
- Licence
- Locations
- Future Science OA (publishedVersion, cc-by)
- PubMed Central (publishedVersion, cc-by)
- PubMed (publishedVersion)
- Repository@Hull (Worktribe) (University of Hull) (acceptedVersion, other-oa)
- Repository@Hull (Worktribe) (University of Hull) (submittedVersion, cc-by)
- Funders
- University of Hull
- National Centre for the Replacement, Refinement and Reduction of Animals in Research (G1100600/1)
- Topics
- Physical Sciences › Engineering › Biomedical Engineering › 3D Printing in Biomedical Research
- Physical Sciences › Engineering › Biomedical Engineering › Microfluidic and Capillary Electrophoresis Applications
- Health Sciences › Medicine › Oncology › Cancer Cells and Metastasis
- Keywords
- head and neck squamous cell carcinoma, personalized medicine, drug response monitoring, tumor viability, computational fluid dynamics
About these checks
Registry, retraction, Cites and statistics results are computed, not judged, with one exception: a printed reference that no index lists is read once by a model before it counts as a citation error. Claims are extracted by a model and kept only when their quote appears verbatim in the text; each cited source is then checked, with a model’s help, for whether it says what the claim relies on. Those verdicts can be wrong — read the claim’s quote and the cited source before relying on one.
Statistics and arithmetic are recomputed, not judged.
Confidence bands are shown only for fields calibrated on our annotated test set. None is calibrated yet, so no band is shown.
What counts as a claim ›How we measure confidence ›How we check this ›
Are you an author, or do you see a problem with this page? Request a review
