Cited by 47

The DOI matches its Crossref record; 3 of the 3 references it cites were found in a registry or an index.

Live imaging and single-cell analysis reveal differential dynamics of autophagy and apoptosis

Xu, Yangqing, Yuan, Junying, Lipinski, Marta M.·2013·Autophagy

Overview

The claims and statistics of this paper haven’t been checked yet.

Run the check — free, no account needed. It reads the open-access text and checks the sources it cites.

A few free checks a day · papers already verified open instantly · results are public

Integrity signals

Registry

Crossref · 10.4161/auto.25080

Cites

3 of 3 references verified0 citation errors · 0 not checkable

Statistics

Figures

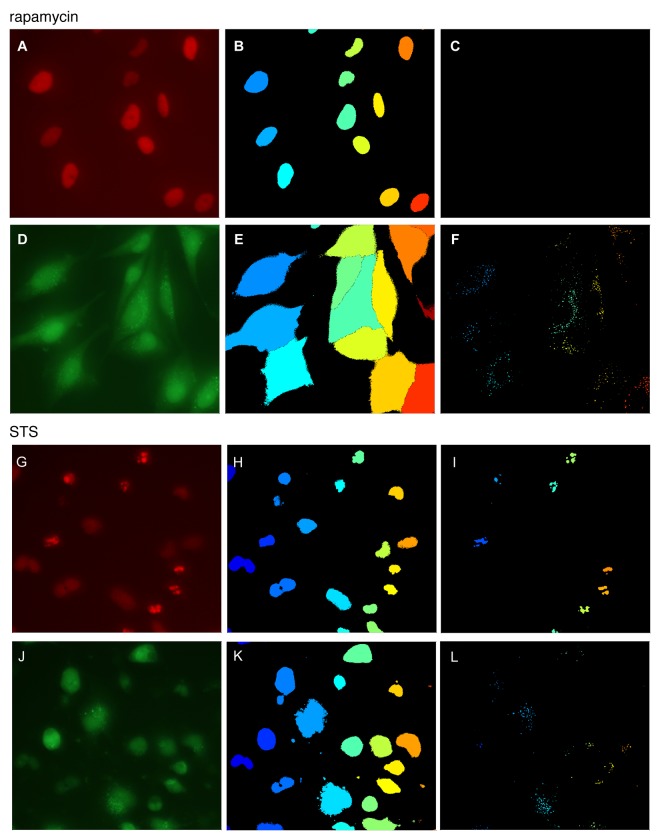
Figure 1. Image analysis of autophagy and apoptosis. H4 cells stably expressing GFP-LC3 autophagy reporter and H2B-RFP chromatin marker were treated with 20 nM rapamycin for 6 h (A–F) or 1 μM STS for 2 h (G–L). Live cells were imaged at 20× magnification and images were processed and quantified as described in text. (A and G) H2B-RFP image, (B and H) nuclear identification, (C and I) detection of apoptotic puncta; (D and J) GFP-LC3 image, (E and K) results of cell morphology segmentation, (F and L) detection of autophagic puncta.
Figure 1. Image analysis of autophagy and apoptosis. H4 cells stably expressing GFP-LC3 autophagy reporter and H2B-RFP chromatin marker were treated with 20 nM rapamycin for 6 h (A–F) or 1 μM STS for 2 h (G–L). Live cells were imaged at 20× magnification and images were processed and quantified as described in text. (A and G) H2B-RFP image, (B and H) nuclear identification, (C and I) detection of apoptotic puncta; (D and J) GFP-LC3 image, (E and K) results of cell morphology segmentation, (F and L) detection of autophagic puncta.CC BY-NC · PubMed Central
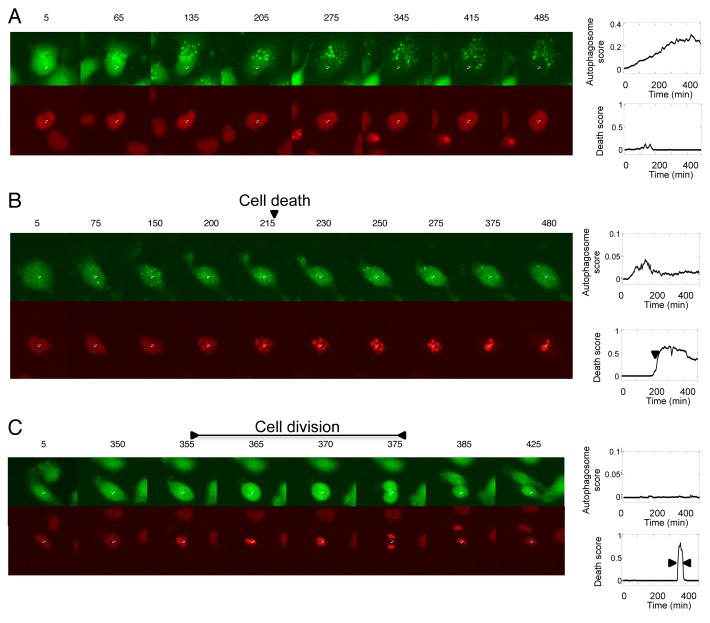
Figure 2. Analysis of single-cell dynamics of autophagy, apoptosis and cell division in time-lapse data. H4 cells stably expressing GFP-LC3 and H2B-RFP markers were treated with (A and B) 0.5 μM STS or (C) left untreated. Images were acquired. Time after treatment (min) is labeled above each image. The white cross in each image indicates center of the nucleus of the tracked cell. Following image analysis and quantification, autophagy and cell death scores were plotted against time for individual cells. Representative examples of cells undergoing autophagy, apoptosis and cell division are presented in (A–C), respectively.
Figure 2. Analysis of single-cell dynamics of autophagy, apoptosis and cell division in time-lapse data. H4 cells stably expressing GFP-LC3 and H2B-RFP markers were treated with (A and B) 0.5 μM STS or (C) left untreated. Images were acquired. Time after treatment (min) is labeled above each image. The white cross in each image indicates center of the nucleus of the tracked cell. Following image analysis and quantification, autophagy and cell death scores were plotted against time for individual cells. Representative examples of cells undergoing autophagy, apoptosis and cell division are presented in (A–C), respectively.CC BY-NC · PubMed Central
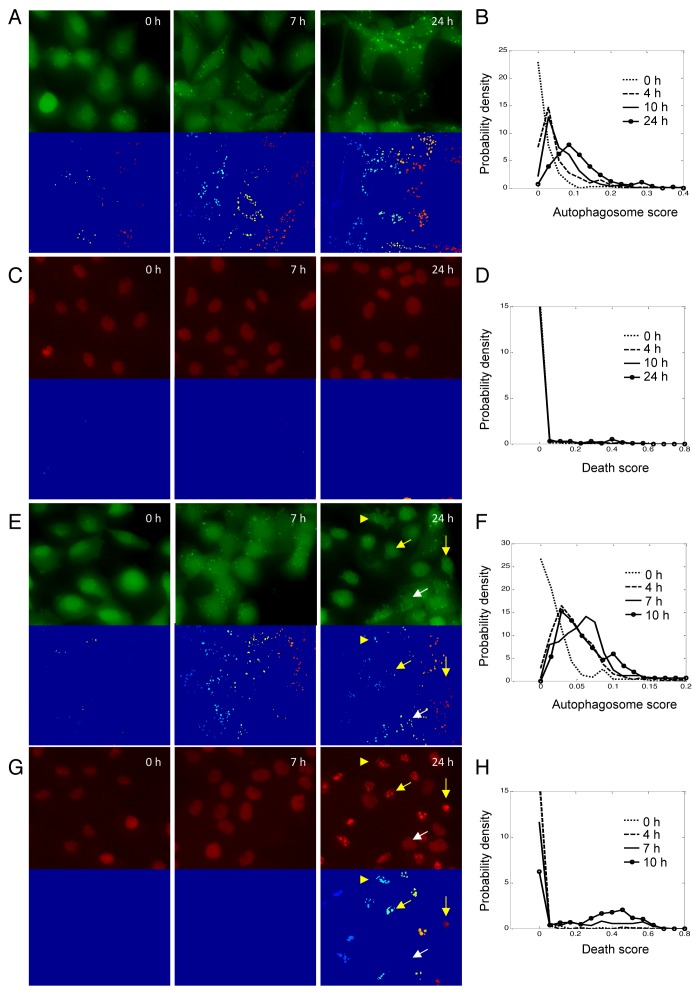
Figure 3. Autophagy and apoptotic responses in H4 cells during starvation. (A) Images of GFP-LC3 and the corresponding segmentation results after serum deprivation for indicated periods of time. (B) Distributions of autophagosome scores after serum deprivation. (C) Images of H2B-RFP and the corresponding segmentation results after serum deprivation for indicated periods of time. (D) Distributions of death scores after serum starvation. (E) Images of GFP-LC3 and the corresponding segmentation results after glucose deprivation for indicated periods of time. (F) Distributions of autophagosome scores after glucose deprivation. (G) Images of H2B-RFP and the corresponding segmentation results after glucose deprivation for indicated periods of time. (H) Distributions of death scores after glucose starvation. To make the height of the curve insensitive to the size of bins used, the total area under each density function curve was normalized to 1.
Figure 3. Autophagy and apoptotic responses in H4 cells during starvation. (A) Images of GFP-LC3 and the corresponding segmentation results after serum deprivation for indicated periods of time. (B) Distributions of autophagosome scores after serum deprivation. (C) Images of H2B-RFP and the corresponding segmentation results after serum deprivation for indicated periods of time. (D) Distributions of death scores after serum starvation. (E) Images of GFP-LC3 and the corresponding segmentation results after glucose deprivation for indicated periods of time. (F) Distributions of autophagosome scores after glucose deprivation. (G) Images of H2B-RFP and the corresponding segmentation results after glucose deprivation for indicated periods of time. (H) Distributions of death scores after glucose starvation. To make the height of the curve insensitive to the size of bins used, the total area under each density function curve was normalized to 1.CC BY-NC · PubMed Central
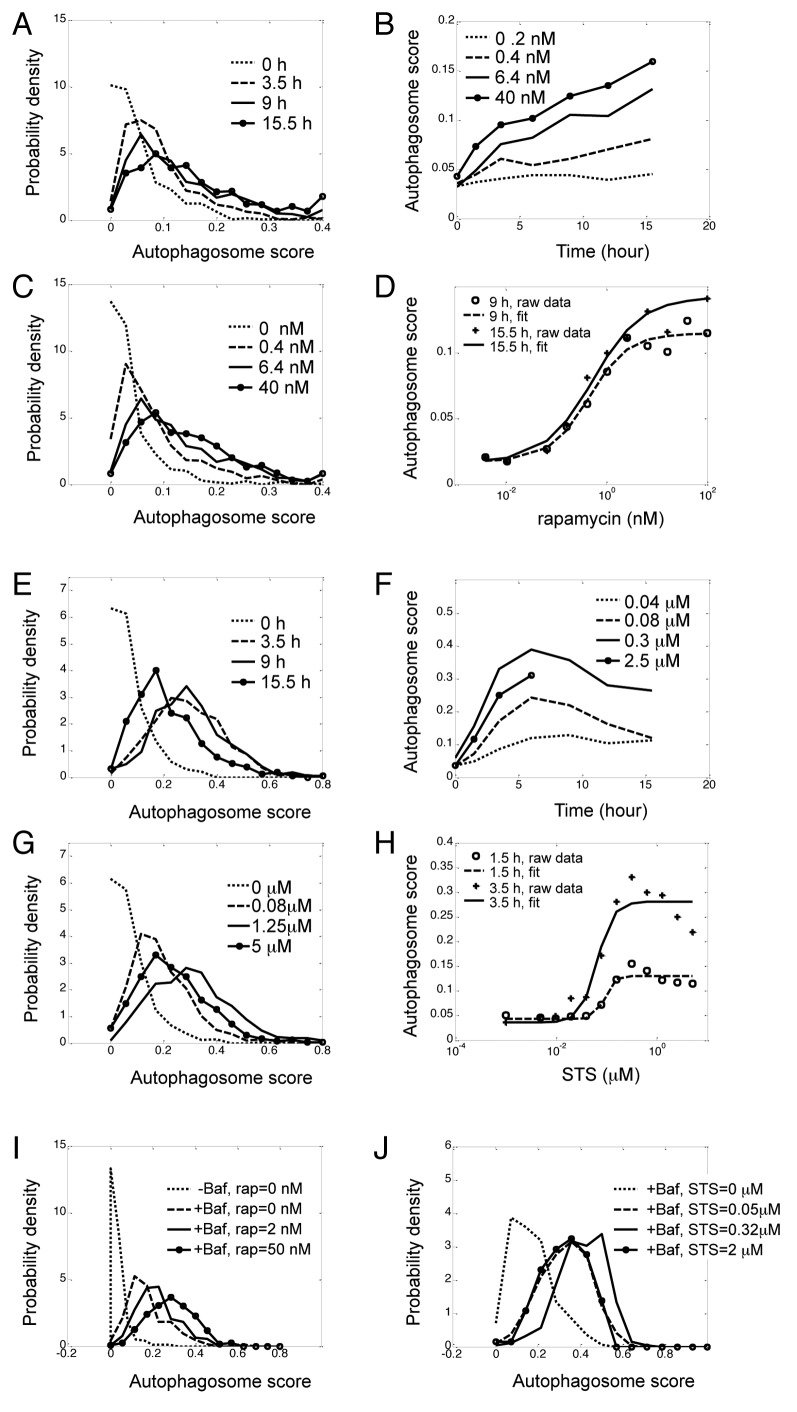
Figure 4. Unimodal dose response and kinetics of autophagy in response to rapamycin and STS. H4 cells expressing GFP-LC3 and H2B-RFP were treated with indicated doses or rapamycin (A–D) or STS (E–H) and imaged over time. (A) Kinetics of distributions of rapamycin-induced autophagy. Concentration of rapamycin was 6.4 nM. (B) Kinetics of population average (median) of rapamycin-induced autophagy. Rapamycin concentrations are indicated in legends. (C) Dose-response of distributions of rapamycin-induced autophagy at 9 h, (D) Dose-response of population median of rapamycin-induced autophagy, which was fitted with the Hill equation (see ref. 10). (E) Kinetics of distributions of STS (0.16 μM)-induced autophagy. (F) Kinetics of population median of STS-induced autophagy at indicated doses. (G) Dose-response of distributions of STS-induced autophagy at 3.5 h. (H) Dose-response of population median of STS-induced autophagy, which was fitted with the Hill equation. (I and J) Dose-response of induction of autophagy by rapamycin (I) and STS (J) in presence of Baf (100 nM). Again, the total area under each density function curve was normalized to 1.
Figure 4. Unimodal dose response and kinetics of autophagy in response to rapamycin and STS. H4 cells expressing GFP-LC3 and H2B-RFP were treated with indicated doses or rapamycin (A–D) or STS (E–H) and imaged over time. (A) Kinetics of distributions of rapamycin-induced autophagy. Concentration of rapamycin was 6.4 nM. (B) Kinetics of population average (median) of rapamycin-induced autophagy. Rapamycin concentrations are indicated in legends. (C) Dose-response of distributions of rapamycin-induced autophagy at 9 h, (D) Dose-response of population median of rapamycin-induced autophagy, which was fitted with the Hill equation (see ref. 10). (E) Kinetics of distributions of STS (0.16 μM)-induced autophagy. (F) Kinetics of population median of STS-induced autophagy at indicated doses. (G) Dose-response of distributions of STS-induced autophagy at 3.5 h. (H) Dose-response of population median of STS-induced autophagy, which was fitted with the Hill equation. (I and J) Dose-response of induction of autophagy by rapamycin (I) and STS (J) in presence of Baf (100 nM). Again, the total area under each density function curve was normalized to 1.CC BY-NC · PubMed Central
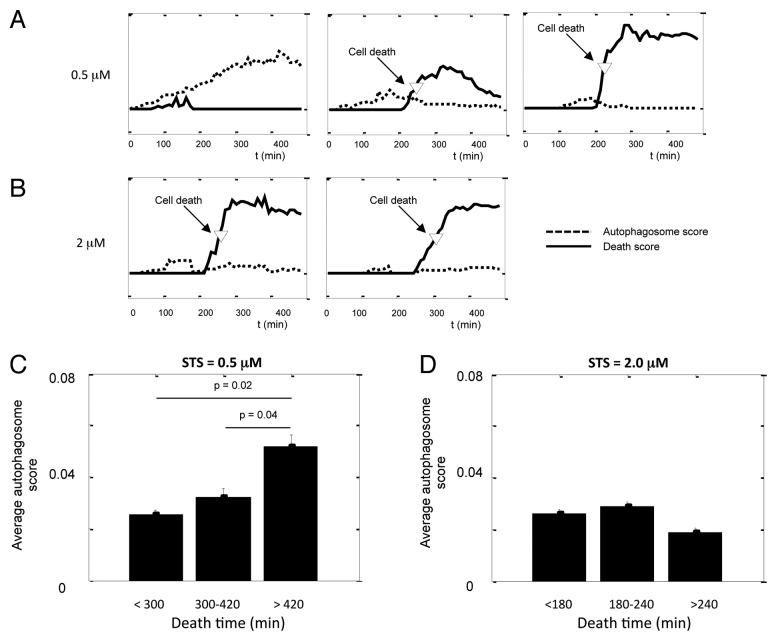
Figure 5. Single-cell analysis indicates a protective function of autophagy against STS-induced apoptosis. (A and B) Kinetics of autophagosome score and cell death score in cells treated with (A) 0.5 μM and (B) 2.0 μM STS. The movies were taken on the Nikon TE2000 system, one frame every 5 min. Autophagosome scores were rescaled so they can fit in the same graph with the death scores. (C and D) The average autophagosome score of cells binned by their death time for (C) 0.5 μM and (D) 2.0 μM STS. Error bars are standard error of mean; p value was calculated by unpaired Student’s t-test; n = 10 to 30.
Figure 5. Single-cell analysis indicates a protective function of autophagy against STS-induced apoptosis. (A and B) Kinetics of autophagosome score and cell death score in cells treated with (A) 0.5 μM and (B) 2.0 μM STS. The movies were taken on the Nikon TE2000 system, one frame every 5 min. Autophagosome scores were rescaled so they can fit in the same graph with the death scores. (C and D) The average autophagosome score of cells binned by their death time for (C) 0.5 μM and (D) 2.0 μM STS. Error bars are standard error of mean; p value was calculated by unpaired Student’s t-test; n = 10 to 30.CC BY-NC · PubMed Central
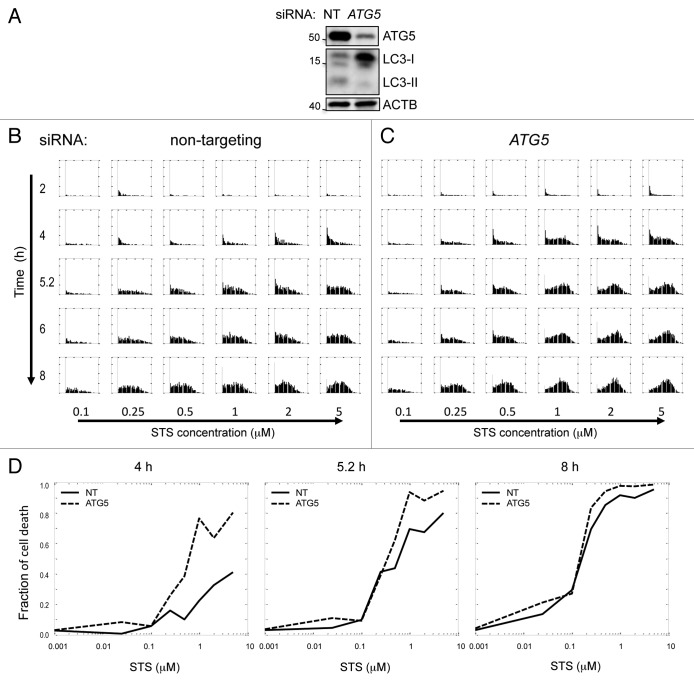
Figure 6. Suppression of autophagy potentiates STS-induced cell death. (A) siRNA mediated knockdown of ATG5 suppressed levels of basal autophagy in H4 cells. Cells were transfected with nontargeting siRNA (NT) or siRNA against human ATG5 for 48 h and treated with 10 μg/ml E64d for 4 h prior to lysis. (B and C) Kinetics and dose response of cell death score in NT and ATG5 knockdown cells. Cells were transfected with siRNA for 48 h, then treated with indicated doses of STS. Images were taken on the high throughput CellWoRx microscope. Each row is a different time point, and each column corresponds to different STS concentration. For each individual panel, the X-axis is cell death score, and the Y-axis is probability density of the distribution. (D) Dose-response of fraction of cell death at indicated time points after STS treatment. Fraction of cell death was calculated by counting cells with positive cell death score.
Figure 6. Suppression of autophagy potentiates STS-induced cell death. (A) siRNA mediated knockdown of ATG5 suppressed levels of basal autophagy in H4 cells. Cells were transfected with nontargeting siRNA (NT) or siRNA against human ATG5 for 48 h and treated with 10 μg/ml E64d for 4 h prior to lysis. (B and C) Kinetics and dose response of cell death score in NT and ATG5 knockdown cells. Cells were transfected with siRNA for 48 h, then treated with indicated doses of STS. Images were taken on the high throughput CellWoRx microscope. Each row is a different time point, and each column corresponds to different STS concentration. For each individual panel, the X-axis is cell death score, and the Y-axis is probability density of the distribution. (D) Dose-response of fraction of cell death at indicated time points after STS treatment. Fraction of cell death was calculated by counting cells with positive cell death score.CC BY-NC · PubMed Central

Verification

Claims the paper makes

The claims and statistics of this paper haven’t been checked yet.

Run the check — free, no account needed. It reads the open-access text and checks the sources it cites.

A few free checks a day · papers already verified open instantly · results are public

Claims other papers make about this one

Each is checked against this paper’s own text: does it say what the citing paper says it does?

Self-check

Percentages, sums and reported differences re-computed from the paper’s own numbers.

The self-check needs the paper’s full text.

Citations

Cites

Show all 3 references

Research works printed but not linked: 15

  1. 10.1016/j.cell.2007.12.018 · DOI · Paper page
  2. 10.1016/j.devcel.2010.05.005 · DOI
  3. 10.1242/dev.043836 · DOI
  4. 10.1126/science.280.5365.895 · DOI · Paper page
  5. 10.1093/emboj/20.12.3167 · DOI
  6. 10.1038/nrm2239 · DOI
  7. 10.1016/S1534-5807(04)00099-1 · DOI
  8. 10.1109/TBME.2006.870201 · DOI
  9. 10.1016/0165-6147(89)90263-0 · DOI
  10. 10.4161/auto.7.9.16252 · DOI
  11. 10.4161/auto.6.8.13772 · DOI
  12. 10.1038/sj.onc.1207521 · DOI
  13. 10.1038/cdd.2009.33 · DOI
  14. 10.4161/auto.6.6.12510 · DOI · Paper page
  15. 10.1038/sj.cdd.4402200 · DOI

Cited by

Sorted by citations

Metadata

Authors
Xu, Y., Yuan, J., & Lipinski, M. M.
Venue
Autophagy
Published
2013-09-29
Volume
9
Issue
9
Pages
1418-1430
ISSN
  • 1554-8627
  • 1554-8635
Cited by
47
References
3
Language
en

About these checks

Registry, retraction, Cites and statistics results are computed, not judged, with one exception: a printed reference that no index lists is read once by a model before it counts as a citation error. Claims are extracted by a model and kept only when their quote appears verbatim in the text; each cited source is then checked, with a model’s help, for whether it says what the claim relies on. Those verdicts can be wrong — read the claim’s quote and the cited source before relying on one.

Statistics and arithmetic are recomputed, not judged.

Confidence bands are shown only for fields calibrated on our annotated test set. None is calibrated yet, so no band is shown.

What counts as a claim ›How we measure confidence ›How we check this ›

Are you an author, or do you see a problem with this page? Request a review