

The DOI matches its DataCite record; 7 of the 7 references it cites were found in a registry or an index.
Sampling Permutations for Shapley Value Estimation
Abstract
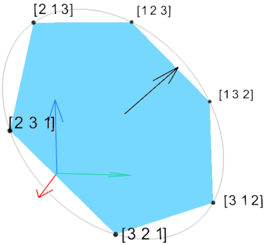
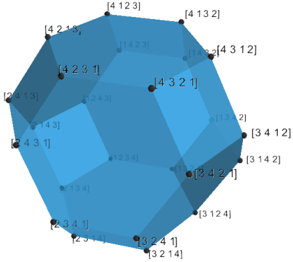
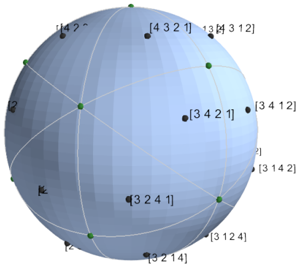
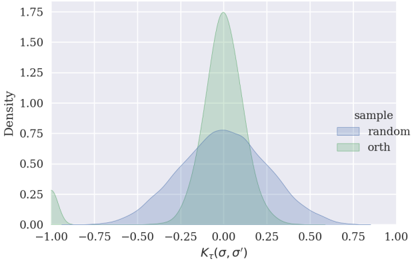
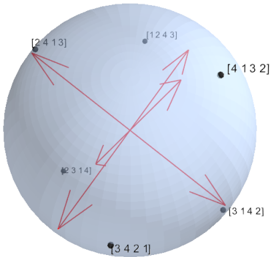
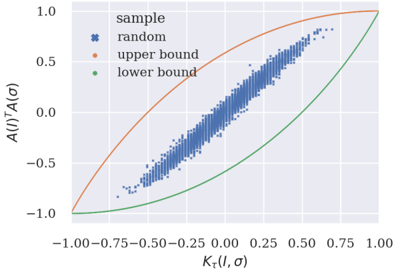
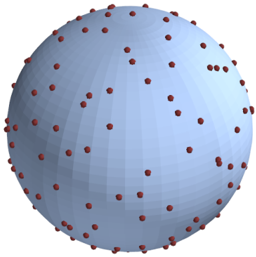
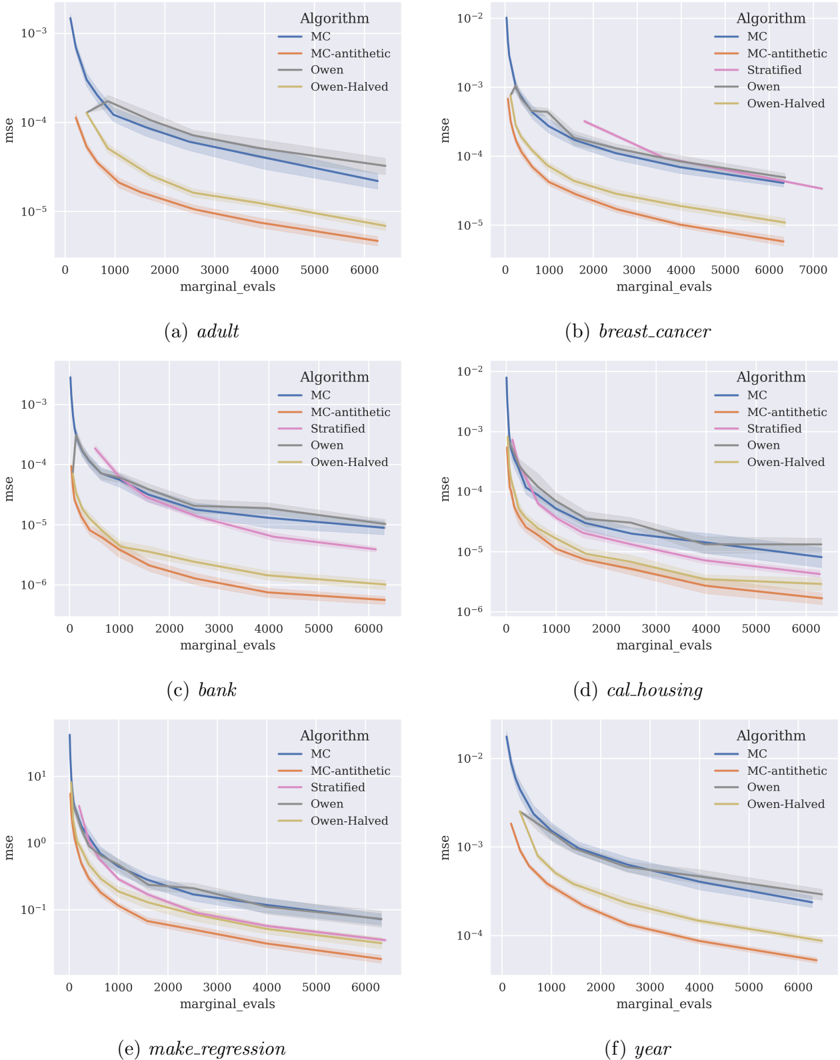
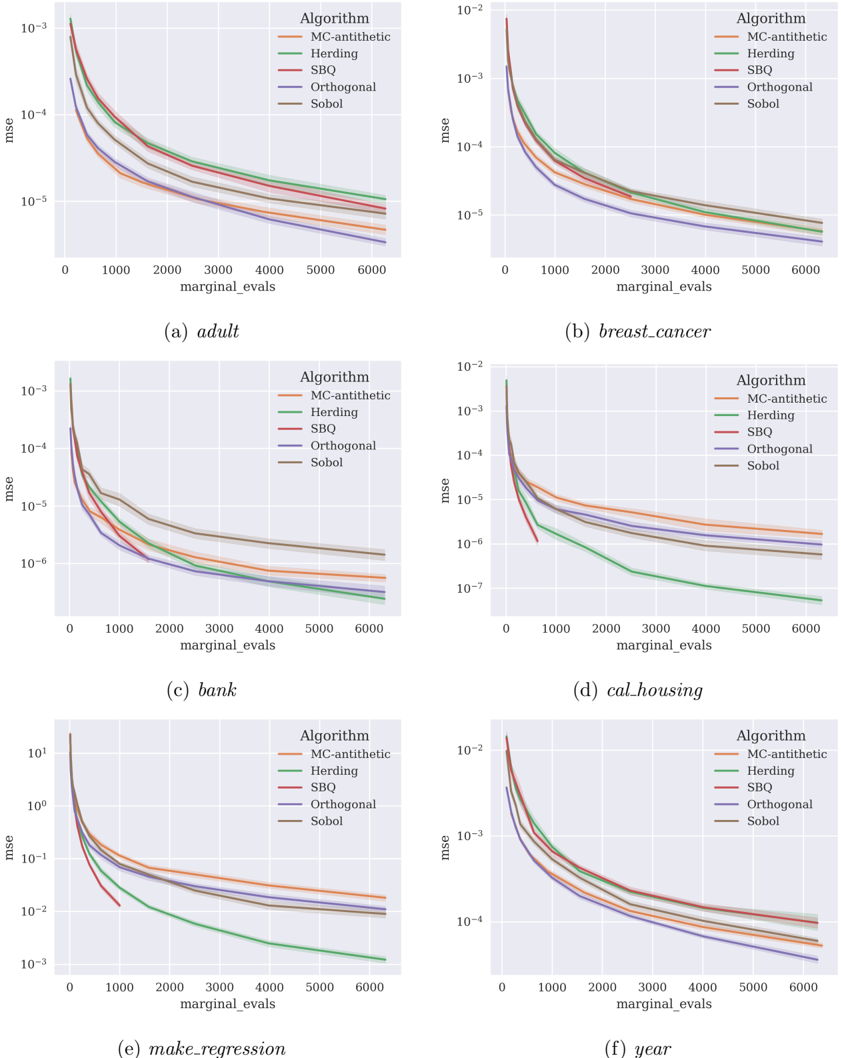
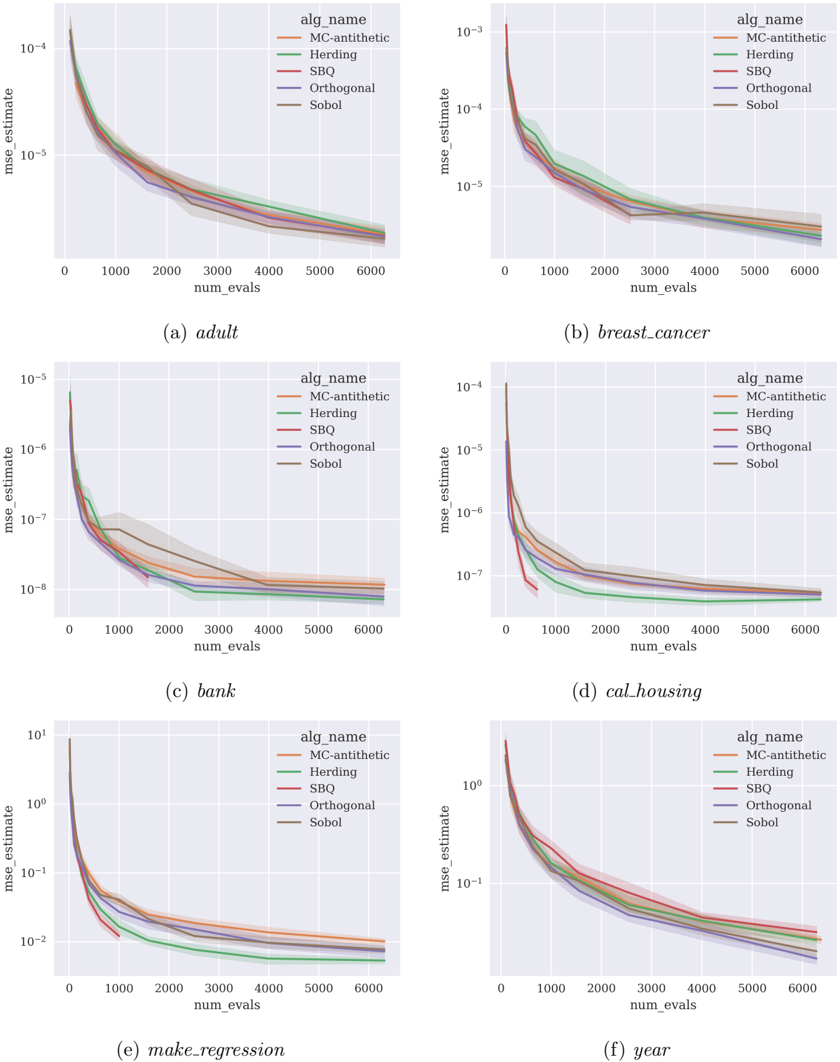
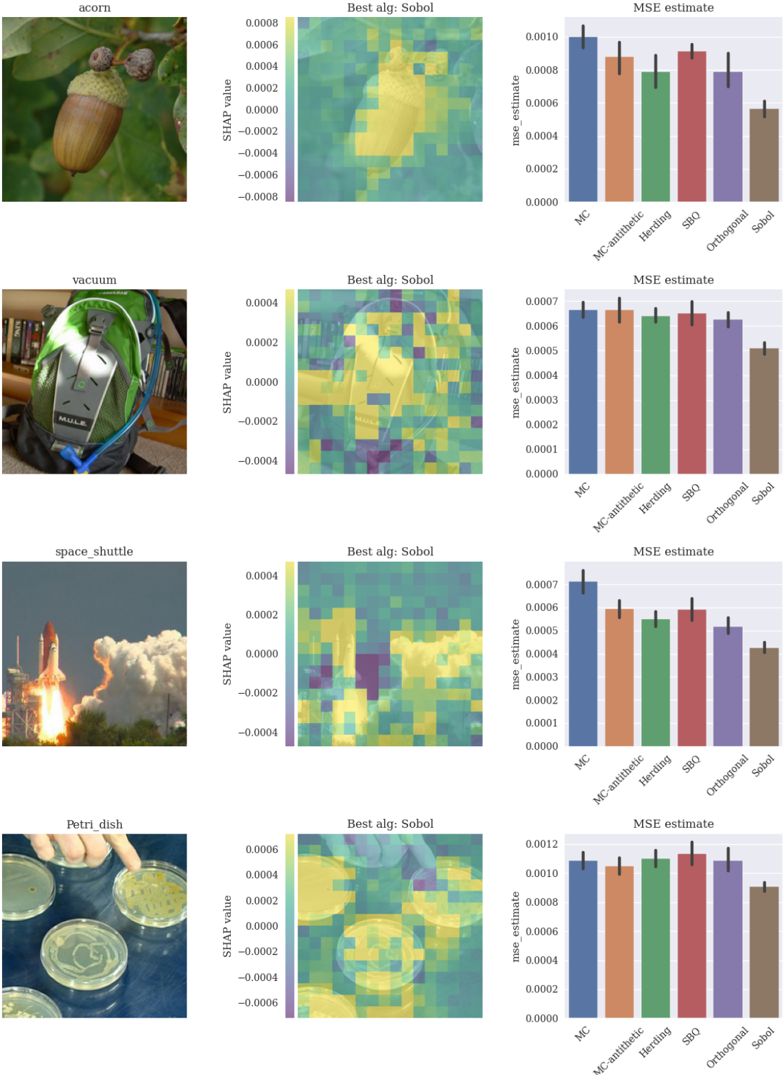
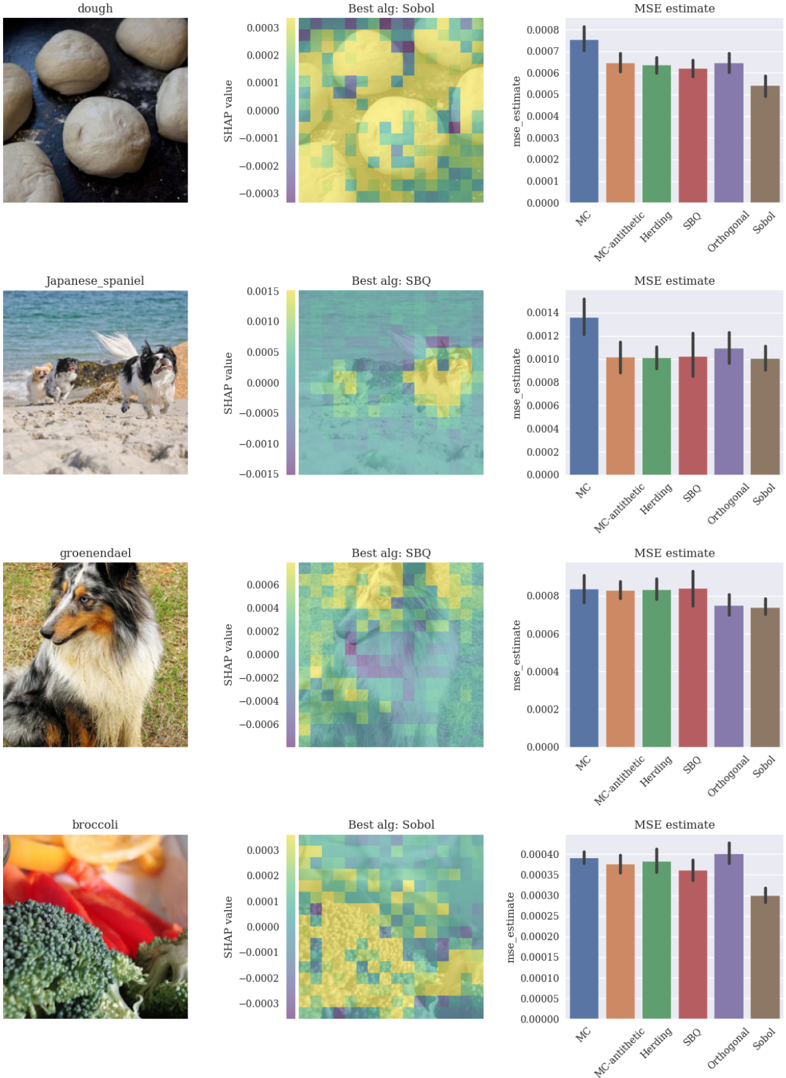
Game-theoretic attribution techniques based on Shapley values are used to interpret black-box machine learning models, but their exact calculation is generally NP-hard, requiring approximation methods for non-trivial models. As the computation of Shapley values can be expressed as a summation over a set of permutations, a common approach is to sample a subset of these permutations for approximation. Unfortunately, standard Monte Carlo sampling methods can exhibit slow convergence, and more sophisticated quasi-Monte Carlo methods have not yet been applied to the space of permutations. To address this, we investigate new approaches based on two classes of approximation methods and compare them empirically. First, we demonstrate quadrature techniques in a RKHS containing functions of permutations, using the Mallows kernel in combination with kernel herding and sequential Bayesian quadrature. The RKHS perspective also leads to quasi-Monte Carlo type error bounds, with a tractable discrepancy measure defined on permutations. Second, we exploit connections between the hypersphere $\mathbb{S}^{d-2}$ and permutations to create practical algorithms for generating permutation samples with good properties. Experiments show the above techniques provide significant improvements for Shapley value estimates over existing methods, converging to a smaller RMSE in the same number of model evaluations.
Overview
The claims and statistics of this paper haven’t been checked yet.
Run the check — free, no account needed. It reads the open-access text and checks the sources it cites.
Integrity signals
Registry
Cites
Statistics
Figures
Verification
Claims the paper makes
The claims and statistics of this paper haven’t been checked yet.
Run the check — free, no account needed. It reads the open-access text and checks the sources it cites.
Claims other papers make about this one
Each is checked against this paper’s own text: does it say what the citing paper says it does?
In the citing paper
“we applied permutation sampling to approximate Shapley values80, which simplifies computations while maintaining accuracy in estimating feature contributions.”
From AI-based differential diagnosis of dementia etiologies on multimodal data (2024) · cites this paper as [80]
Self-check
Percentages, sums and reported differences re-computed from the paper’s own numbers.
The self-check needs the paper’s full text.
Citations
Cites
From local explanations to global understanding with explainable AI for trees
Lundberg, S. M., Erion, G., Chen, H., DeGrave, A., Prutkin, J. M., Nair, B., Katz, R., Himmelfarb, J., Bansal, N., & Lee, S.-I. (2020) · Nature Machine Intelligence · doi:10.1038/s42256-019-0138-9 · Cited by 10,551
On the distribution of points in a cube and the approximate evaluation of integrals
Sobol', I. M. (1967) · USSR Computational Mathematics and Mathematical Physics · doi:10.1016/0041-5553(67)90144-9 · Cited by 2,975
Explaining prediction models and individual predictions with feature contributions
Štrumbelj, E., & Kononenko, I. (2014) · Knowledge and Information Systems · doi:10.1007/s10115-013-0679-x · Cited by 2,286
Group representations in probability and statistics
Diaconis, P. (1988) · doi:10.1214/lnms/1215467407 · Cited by 1,381
Polynomial calculation of the Shapley value based on sampling
Castro, J., Gómez, D., & Tejada, J. (2009) · Computers & Operations Research · doi:10.1016/j.cor.2008.04.004 · Cited by 601
Equivalence of distance-based and RKHS-based statistics in hypothesis testing
Sejdinovic, D., Sriperumbudur, B., Gretton, A., & Fukumizu, K. (2013) · The Annals of Statistics · doi:10.1214/13-aos1140 · Cited by 582 · cited 2×
“Introduction The seminal work of Shapley (1953) introduces an axiomatic attribution of collaborative game outcomes among coalitions of participating players.”
BackgroundFeature Selection via Coalitional Game Theory
Cohen, S., Dror, G., & Ruppin, E. (2007) · Neural Computation · doi:10.1162/neco.2007.19.7.1939 · Cited by 144
Research works printed but not linked: 38
- Thierry Bertin-Mahieux, Daniel P.W. Ellis, Brian Whitman, and Paul Lamere. The million song dataset. In Proceedings of the 12th International Conference on Music Information Retrieval (ISMIR 2011), 2011.
- LE Blumenson. A derivation of n-dimensional spherical coordinates. The American Math- ematical Monthly, 67(1):63-66, 1960.
- Johann S Brauchart and Josef Dick. Quasi-Monte Carlo rules for numerical integration over the unit sphere S 2 . Numerische Mathematik, 121(3):473-502, 2012.
- Javier Castro, Daniel Gómez, Elisenda Molina, and Juan Tejada. Improving polynomial estimation of the shapley value by stratified random sampling with optimum alloca- tion. Computers & Operations Research, 82:180-188, 2017. ISSN 0305-0548. doi: https: //doi.org/10.1016/j.cor.2017.01.019. URL https://www.sciencedirect.com/science/ article/pii/S030505481730028X. · DOI
- Tianqi Chen and Carlos Guestrin. XGBoost: A scalable tree boosting system. In KDD, pages 785-794. ACM, 2016.
- Yutian Chen, Max Welling, and Alex Smola. Super-samples from kernel herding. In Pro- ceedings of the Twenty-Sixth Conference on Uncertainty in Artificial Intelligence, UAI'10, page 109-116, Arlington, Virginia, USA, 2010. AUAI Press. ISBN 9780974903965.
- Krzysztof Choromanski, Mark Rowland, Wenyu Chen, and Adrian Weller. Unifying or- thogonal Monte Carlo methods. In International Conference on Machine Learning, pages 1203-1212. PMLR, 2019.
- J. H. Conway, N. J. A. Sloane, and E. Bannai. Sphere-Packings, Lattices, and Groups. Springer-Verlag, Berlin, Heidelberg, 1987. ISBN 038796617X.
- Ian Covert, Scott Lundberg, and Su-In Lee. Explaining by removing: A unified framework for model explanation. arXiv preprint arXiv:2011.14878, 2020. · arXiv
- Xiaotie Deng and Christos H Papadimitriou. On the complexity of cooperative solution concepts. Mathematics of operations research, 19(2):257-266, 1994.
- Josef Dick and Friedrich Pillichshammer. Digital nets and sequences: discrepancy theory and quasi-Monte Carlo integration. Cambridge University Press, 2010.
- Kaiming He, Xiangyu Zhang, Shaoqing Ren, and Jian Sun. Deep residual learning for image recognition. In Proceedings of the IEEE conference on computer vision and pattern recognition, pages 770-778, 2016.
- Fred J. Hickernell. What affects the accuracy of quasi-Monte Carlo quadrature? In Harald Niederreiter and Jerome Spanier, editors, Monte-Carlo and Quasi-Monte Carlo Methods 1998, pages 16-55, Berlin, Heidelberg, 2000. Springer Berlin Heidelberg. ISBN 978-3- 642-59657-5.
- Edmund Hlawka. Funktionen von beschränkter variatiou in der theorie der gleichverteilung. Annali di Matematica Pura ed Applicata, 54(1):325-333, 1961.
- Ferenc Huszár and David Duvenaud. Optimally-weighted herding is bayesian quadra- ture. In Proceedings of the Twenty-Eighth Conference on Uncertainty in Artificial In- telligence, UAI'12, page 377-386, Arlington, Virginia, USA, 2012. AUAI Press. ISBN 9780974903989.
- Yunlong Jiao and Jean-Philippe Vert. The kendall and mallows kernels for permutations. In Proceedings of the 32nd International Conference on International Conference on Ma- chine Learning -Volume 37, ICML'15, page 1935-1944. JMLR.org, 2015.
- Diederik P Kingma and Jimmy Ba. Adam: A method for stochastic optimization. arXiv preprint arXiv:1412.6980, 2014. · arXiv
- William R. Knight. A computer method for calculating kendall's tau with ungrouped data. Journal of the American Statistical Association, 61(314):436-439, 1966. ISSN 01621459. URL http://www.jstor.org/stable/2282833.
- Donald E. Knuth. The Art of Computer Programming, Volume 2 (3rd Ed.): Seminu- merical Algorithms. Addison-Wesley Longman Publishing Co., Inc., USA, 1997. ISBN 0201896842.
- Ron Kohavi. Scaling up the accuracy of naive-bayes classifiers: A decision-tree hybrid. In KDD, pages 202-207. AAAI Press, 1996.
- Maria Lomeli, Mark Rowland, Arthur Gretton, and Zoubin Ghahramani. Antithetic and Monte Carlo kernel estimators for partial rankings. Statistics and Computing, 29(5): 1127-1147, 2019.
- Scott M Lundberg and Su-In Lee. A unified approach to interpreting model predic- tions. In I. Guyon, U. V. Luxburg, S. Bengio, H. Wallach, R. Fergus, S. Vish- wanathan, and R. Garnett, editors, Advances in Neural Information Processing Systems 30, pages 4765-4774.
- Curran Associates, Inc., 2017. URL http://papers.nips.cc/ paper/7062-a-unified-approach-to-interpreting-model-predictions.pdf.
- Sasan Maleki. Addressing the computational issues of the Shapley value with applications in the smart grid. PhD thesis, University of Southampton, 2015.
- Horia Mania, Aaditya Ramdas, Martin J Wainwright, Michael I Jordan, and Benjamin Recht. On kernel methods for covariates that are rankings. Electronic Journal of Statis- tics, 12:2537-2577, 2018.
- Francesco Mezzadri. How to generate random matrices from the classical compact groups. arXiv preprint math-ph/0609050, 2006. · arXiv
- Thomas Muir. On a simple term of a determinant. In Proc. Royal Society Edinburg, volume 21, pages 441-477, 1898.
- Jerzy Neyman. On the two different aspects of the representative method: The method of stratified sampling and the method of purposive selection. Journal of the Royal Statistical Society, 97(4):558-625, 1934. ISSN 09528385. URL http://www.jstor.org/stable/ 2342192.
- A. O'Hagan. Bayes-hermite quadrature. Journal of Statistical Planning and Inference, 29 (3):245-260, 1991. ISSN 0378-3758. doi: https://doi.org/10.1016/0378-3758(91)90002-V. URL https://www.sciencedirect.com/science/article/pii/037837589190002V. · DOI
- Ramin Okhrati and Aldo Lipani. A multilinear sampling algorithm to estimate shapley values. In Proc. of ICPR, ICPR, 2020.
- Guillermo Owen. Multilinear extensions of games. Management Science, 18(5):P64-P79, 1972. ISSN 00251909, 15265501. URL http://www.jstor.org/stable/2661445.
- R Kelley Pace and Ronald Barry. Sparse spatial autoregressions. Statistics & Probability Letters, 33(3):291-297, 1997.
- F. Pedregosa, G. Varoquaux, A. Gramfort, V. Michel, B. Thirion, O. Grisel, M. Blon- del, P. Prettenhofer, R. Weiss, V. Dubourg, J. Vanderplas, A. Passos, D. Cournapeau, M. Brucher, M. Perrot, and E. Duchesnay. Scikit-learn: Machine learning in Python. Journal of Machine Learning Research, 12:2825-2830, 2011.
- S. M. Plis, T. Lane, and V. D. Calhoun. Permutations as angular data: Efficient inference in factorial spaces. In 2010 IEEE International Conference on Data Mining, pages 403-410, 2010. doi: 10.1109/ICDM.2010.122. · DOI
- William H. Press, Saul A. Teukolsky, William T. Vetterling, and Brian P. Flannery. Numer- ical Recipes 3rd Edition: The Art of Scientific Computing. Cambridge University Press, USA, 3 edition, 2007. ISBN 0521880688.
- Carl Edward Rasmussen and Zoubin Ghahramani. Bayesian Monte Carlo. Advances in neural information processing systems, pages 505-512, 2003.
- Reuven Y Rubinstein and Dirk P Kroese. Simulation and the Monte Carlo method, vol- ume 10. John Wiley & Sons, 2016.
- Olga Russakovsky, Jia Deng, Hao Su, Jonathan Krause, Sanjeev Satheesh, Sean Ma, Zhi- heng Huang, Andrej Karpathy, Aditya Khosla, Michael Bernstein, et al. Imagenet large scale visual recognition challenge. International journal of computer vision, 115(3):211- 252, 2015.
Cited by
The Shapley Value in Machine Learning
Rozemberczki, B., Watson, L., Bayer, P., Yang, H.-T., Kiss, O., Nilsson, S., & Sarkar, R. (2022) · arXiv · doi:10.48550/arxiv.2202.05594 · Cited by 312
Ennab, M., & Mcheick, H. (2024) · Frontiers in Robotics and AI · doi:10.3389/frobt.2024.1444763 · Cited by 238
AI-based differential diagnosis of dementia etiologies on multimodal data
Xue, C., Kowshik, S. S., Lteif, D., Puducheri, S., Jasodanand, V. H., Zhou, O. T., Walia, A. S., Guney, O. B., Zhang, J. D., Poésy, S., et al. (2024) · Nature Medicine · doi:10.1038/s41591-024-03118-z · Cited by 182
Bandwidth-Optimal Random Shuffling for GPUs
Mitchell, R., Stokes, D., Frank, E., & Holmes, G. (2022) · ACM Transactions on Parallel Computing · doi:10.1145/3505287 · Cited by 6
“In the following, we make use of the fact [44] that the expected value of the Mallows kernel under a uniform distribution of permutations is”
MethodSelf-citation
Metadata
- Authors
- Mitchell, R., Cooper, J., Frank, E., & Holmes, G.
- Venue
- arXiv
- Publisher
- arXiv
- Published
- 2021
- arXiv
- 2104.12199
- References
- 7
- Type
- Preprint
About these checks
Registry, retraction, Cites and statistics results are computed, not judged, with one exception: a printed reference that no index lists is read once by a model before it counts as a citation error. Claims are extracted by a model and kept only when their quote appears verbatim in the text; each cited source is then checked, with a model’s help, for whether it says what the claim relies on. Those verdicts can be wrong — read the claim’s quote and the cited source before relying on one.
Statistics and arithmetic are recomputed, not judged.
Confidence bands are shown only for fields calibrated on our annotated test set. None is calibrated yet, so no band is shown.
What counts as a claim ›How we measure confidence ›How we check this ›
Are you an author, or do you see a problem with this page? Request a review
How to cite
Cite CoChat for the checks on this page, and the paper for its own findings.
- This page
- CoChat. (2026). Citation check: Sampling Permutations for Shapley Value Estimation. https://app.cochat.ai/papers/10.48550/arxiv.2104.12199
- The paper
- Mitchell, R., Cooper, J., Frank, E., & Holmes, G. (2021). Sampling Permutations for Shapley Value Estimation. arXiv. https://doi.org/10.48550/arxiv.2104.12199
Data sources
Bibliographic data: Semantic Scholar, OpenAlex, Crossref.
Contains information from the Semantic Scholar Academic Graph Datasets, made available under the ODC Attribution License (ODC-BY 1.0).
Semantic Scholar’s data is described in: Kinney, R., et al. (2023). The Semantic Scholar Open Data Platform. arXiv:2301.10140.
