

The DOI matches its DataCite record; 1 of the 1 references it cites were found in a registry or an index.
covLLM: Large Language Models for COVID-19 Biomedical Literature
Open accessAbstract
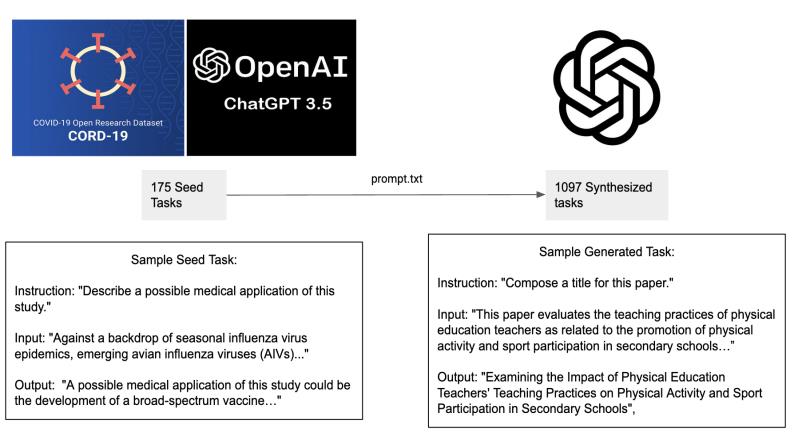
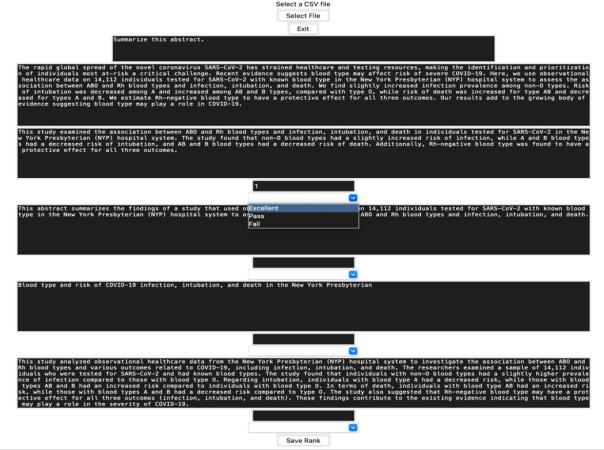
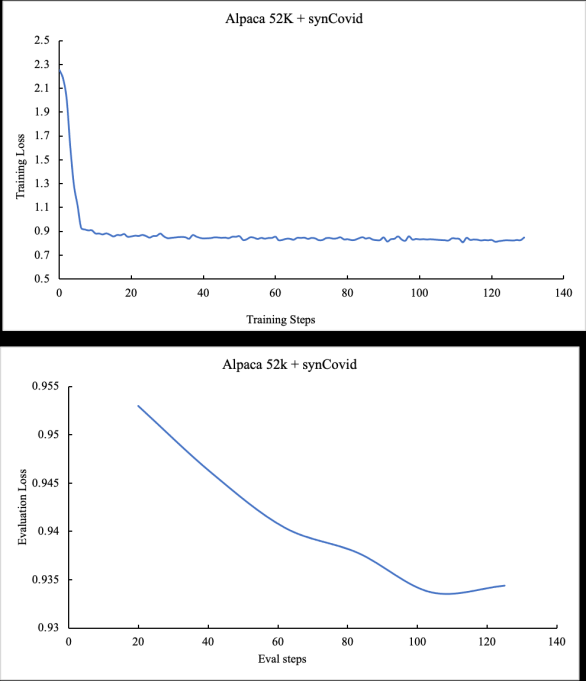
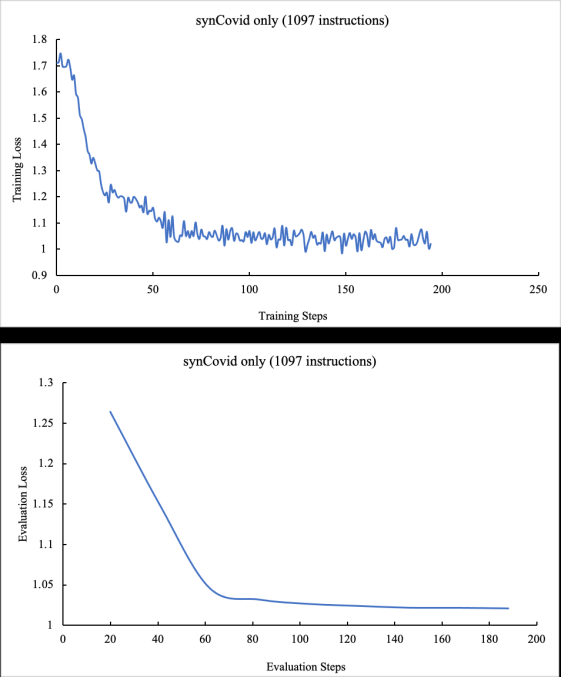
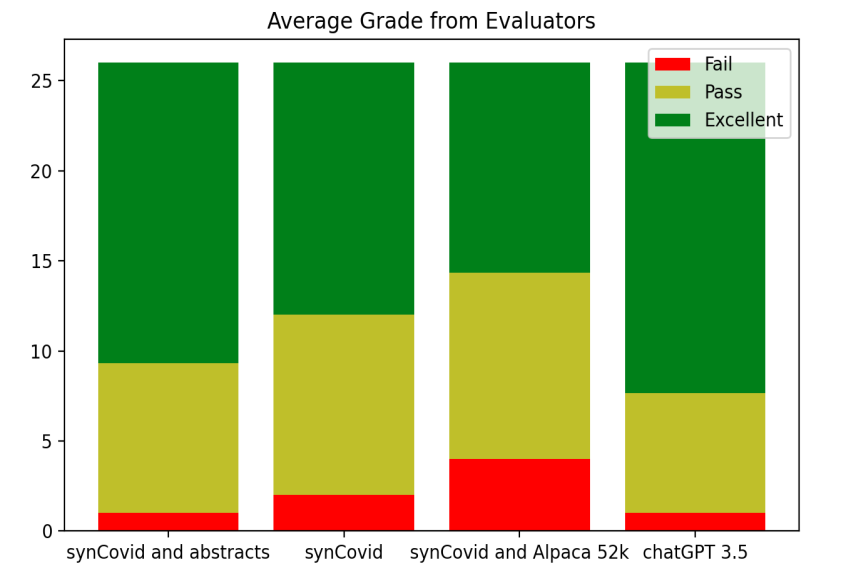
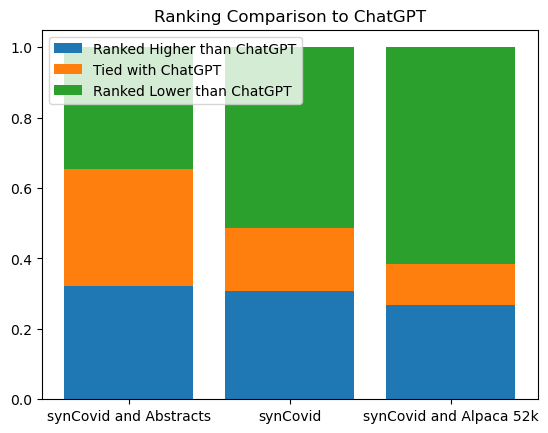
The COVID-19 pandemic led to 1.1 million deaths in the United States, despite the explosion of coronavirus research. These new findings are slow to translate to clinical interventions, leading to poorer patient outcomes and unnecessary deaths. One reason is that clinicians, overwhelmed by patients, struggle to keep pace with the rate of new coronavirus literature. A potential solution is developing a tool for evaluating coronavirus literature using large language models (LLMs) -- neural networks that are deployed for natural language processing. LLMs can be used to summarize and extract user-specified information. The greater availability and advancement of LLMs and pre-processed coronavirus literature databases provide the opportunity to assist clinicians in evaluating coronavirus literature through a coronavirus literature specific LLM (covLLM), a tool that directly takes an inputted research article and a user query to return an answer. Using the COVID-19 Open Research Dataset (CORD-19), we produced two datasets: (1) synCovid, which uses a combination of handwritten prompts and synthetic prompts generated using OpenAI, and (2) real abstracts, which contains abstract and title pairs. covLLM was trained with LLaMA 7B as a baseline model to produce three models trained on (1) the Alpaca and synCovid datasets, (2) the synCovid dataset, and (3) the synCovid and real abstract datasets. These models were evaluated by two human evaluators and ChatGPT. Results demonstrate that training covLLM on the synCovid and abstract pairs datasets performs competitively with ChatGPT and outperforms covLLM trained primarily using the Alpaca dataset.
Overview
The claims and statistics of this paper haven’t been checked yet.
Run the check — free, no account needed. It reads the open-access text and checks the sources it cites.
Integrity signals
Registry
Cites
Statistics
Figures
Verification
Claims the paper makes
The claims and statistics of this paper haven’t been checked yet.
Run the check — free, no account needed. It reads the open-access text and checks the sources it cites.
Claims other papers make about this one
Each is checked against this paper’s own text: does it say what the citing paper says it does?
The cited source says what the claim attributes to it.
In the citing paper
“In the field of medical assistance, LLMs demonstrate potential applications, including research on identifying gastrointestinal diseases [99], dementia diagnosis [217], accelerating the evaluation of COVID-19 literature [93], and their overall potential in healthcare [17].”
From A Survey on Evaluation of Large Language Models (2024) · cites this paper as [93]
Self-check
Percentages, sums and reported differences re-computed from the paper’s own numbers.
The self-check needs the paper’s full text.
Citations
Cites
LLaMA: Open and Efficient Foundation Language Models
Touvron, H., Lavril, T., Izacard, G., Martinet, X., Lachaux, M.-A., Lacroix, T., Rozière, B., Goyal, N., Hambro, E., Azhar, F., et al. (2023) · arXiv · doi:10.48550/arxiv.2302.13971 · Cited by 4,602
Research works printed but not linked: 8
- COVID-19 Treatments. NIH COVID-19 Research. Accessed May 2, 2023. https://covid19.nih.gov/covid- 19-treatments 6. COVID-19 research update: How many pandemic papers have been published? Nature Index. Published August 28, 2020. Accessed May 2, 2023. https://www.nature.com/nature-index/news-blog/how- coronavirus-is-changing-research-practices-and-publishing
- Ioannidis JPA, Salholz-Hillel M, Boyack KW, Baas J. The rapid, massive growth of COVID-19 authors in the scientific literature. R Soc Open Sci. 2021;8(9):210389. doi:10.1098/rsos.210389 · DOI
- Park JJH, Mogg R, Smith GE, et al. How COVID-19 has fundamentally changed clinical research in global health. Lancet Glob Health. 2021;9(5):e711-e720. doi:10.1016/S2214-109X(20)30542-8 · DOI
- How the Google AI Community Used Cloud to Help Biomedical Researchers. Google Cloud Blog. Accessed May 2, 2023. https://cloud.google.com/blog/products/ai-machine-learning/google-ai-community- used-cloud-to-help-biomedical-researchers 14. Lever J, Altman RB. Analyzing the vast coronavirus literature with CoronaCentral. Proc Natl Acad Sci. 2021;118(23):e2100766118. doi:10.1073/pnas.2100766118 · DOI
- Wang LL, Lo K, Chandrasekhar Y, et al. CORD-19: The COVID-19 Open Research Dataset. Published online July 10, 2020. Accessed May 2, 2023. http://arxiv.org/abs/2004.10706 · arXiv
- Wang Y, Kordi Y, Mishra S, et al. Self-Instruct: Aligning Language Model with Self Generated Instructions. Published online December 20, 2022. Accessed May 2, 2023. http://arxiv.org/abs/2212.10560 · arXiv
- Zhou C, Liu P, Xu P, et al. LIMA: Less Is More for Alignment. Published online May 18, 2023. doi:10.48550/arXiv.2305.11206 · DOI · Paper page
- Hu EJ, Shen Y, Wallis P, et al. LoRA: Low-Rank Adaptation of Large Language Models. Published online October 16, 2021. doi:10.48550/arXiv.2106.09685 · DOI · Paper page
Cited by
Sorted by citations
A Survey on Evaluation of Large Language Models
Chang, Y., Wang, X., Wang, J., Wu, Y., Yang, L., Zhu, K., Chen, H., Yi, X., Wang, C., Wang, Y., et al. (2024) · ACM Transactions on Intelligent Systems and Technology · doi:10.1145/3641289 · Cited by 4,254
“Medical assistants: (Khan et al., 2023) / (Lahat et al.”
Metadata
- Authors
- Khan, Y. A., Hokia, C., Xu, J., & Ehlert, B.
- Affiliations
- Stanford Medicine (US)
- Stanford University (US)
- Venue
- arXiv
- Publisher
- arXiv
- Published
- 2023
- ISSN
- 2331-8422 (ISSN-L)
- arXiv
- 2306.04926
- OpenAlex
- W4380136292
- Cited by
- 7
- References
- 1
- Citations by year
- 2026: 2 · 2025: 2 · 2024: 3
- Type
- posted content
- Language
- en
- Open access
- green
- arxiv.org
- Licence
- Locations
- arXiv (Cornell University) (submittedVersion, cc-by-nc-sa)
- arXiv (Cornell University)
- Topics
- Physical Sciences › Computer Science › Artificial Intelligence › Topic Modeling
- Health Sciences › Medicine › Health Informatics › Biomedical Text Mining and Ontologies
- Health Sciences › Medicine › Health Informatics › Artificial Intelligence in Healthcare and Education
- Keywords
- large language models, COVID-19 pandemic, biomedical literature, CORD-19, clinical decision support, literature evaluation, llamas, alpaca, question answering, scientific abstracts
About these checks
Registry, retraction, Cites and statistics results are computed, not judged, with one exception: a printed reference that no index lists is read once by a model before it counts as a citation error. Claims are extracted by a model and kept only when their quote appears verbatim in the text; each cited source is then checked, with a model’s help, for whether it says what the claim relies on. Those verdicts can be wrong — read the claim’s quote and the cited source before relying on one.
Statistics and arithmetic are recomputed, not judged.
Confidence bands are shown only for fields calibrated on our annotated test set. None is calibrated yet, so no band is shown.
What counts as a claim ›How we measure confidence ›How we check this ›
Are you an author, or do you see a problem with this page? Request a review
