

The DOI matches its DataCite record.
TokenSHAP: Interpreting Large Language Models with Monte Carlo Shapley Value Estimation
Open accessAbstract
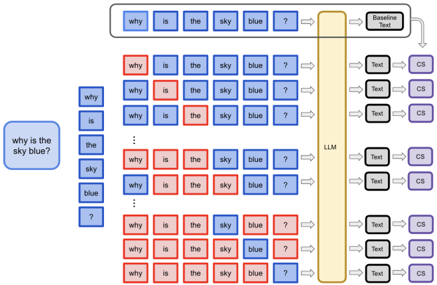
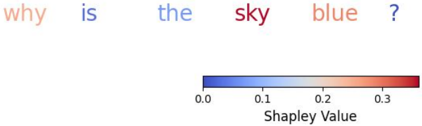
As large language models (LLMs) become increasingly prevalent in critical applications, the need for interpretable AI has grown. We introduce TokenSHAP, a novel method for interpreting LLMs by attributing importance to individual tokens or substrings within input prompts. This approach adapts Shapley values from cooperative game theory to natural language processing, offering a rigorous framework for understanding how different parts of an input contribute to a model's response. TokenSHAP leverages Monte Carlo sampling for computational efficiency, providing interpretable, quantitative measures of token importance. We demonstrate its efficacy across diverse prompts and LLM architectures, showing consistent improvements over existing baselines in alignment with human judgments, faithfulness to model behavior, and consistency. Our method's ability to capture nuanced interactions between tokens provides valuable insights into LLM behavior, enhancing model transparency, improving prompt engineering, and aiding in the development of more reliable AI systems. TokenSHAP represents a significant step towards the necessary interpretability for responsible AI deployment, contributing to the broader goal of creating more transparent, accountable, and trustworthy AI systems.
Overview
The claims and statistics of this paper haven’t been checked yet.
Run the check — free, no account needed. It reads the open-access text and checks the sources it cites.
Integrity signals
Registry
Cites
Statistics
Figures
Verification
Claims the paper makes
The claims and statistics of this paper haven’t been checked yet.
Run the check — free, no account needed. It reads the open-access text and checks the sources it cites.
Claims other papers make about this one
Each is checked against this paper’s own text: does it say what the citing paper says it does?
The cited source says what the claim attributes to it.
In the citing paper
“TokenSHAP[3] uses Monte Carlo Shapley values to explain which input tokens matter for LLM outputs in a model-agnostic way.”
From AgentSHAP: Interpreting LLM Agent Tool Importance with Monte Carlo Shapley Value Estimation (2025) · cites this paper as [3]
The check wasn’t confident either way, so it gives no verdict — never disputed.
In the citing paper
“No existing XAI methods address tool-level explanations.”
From AgentSHAP: Interpreting LLM Agent Tool Importance with Monte Carlo Shapley Value Estimation (2025) · cites this paper as [3]
Experimental — accuracy not yet measured
Self-check
Percentages, sums and reported differences re-computed from the paper’s own numbers.
The self-check needs the paper’s full text.
Citations
Cites
Still being checked.
Research works printed but not linked: 12
- Guidotti, R., Monreale, A., Ruggieri, S., Turini, F., Giannotti, F., & Pedreschi, D. (2018). A survey of methods for explaining black box models. ACM computing surveys (CSUR), 51(5), 1-42.
- Ribeiro, M. T., Singh, S., & Guestrin, C. (2016). Why should I trust you? Explaining the predic- tions of any classifier. In Proceedings of the 22nd ACM SIGKDD international conference on knowl- edge discovery and data mining (pp. 1135-1144).
- Lundberg, S. M., & Lee, S. I. (2017). A unified approach to interpreting model predictions. In Ad- vances in neural information processing systems (pp. 4765-4774).
- Simonyan, K., Vedaldi, A., & Zisserman, A. (2013). Deep inside convolutional networks: Visualising image classification models and saliency maps. In Workshop at International Conference on Learning Representations.
- Bach, S., Binder, A., Montavon, G., Klauschen, F., Müller, K. R., & Samek, W. (2015). On pixel-wise explanations for non-linear classifier decisions by layer-wise relevance propagation. PloS one, 10(7), e0130140.
- Gilpin, L. H., Bau, D., Yuan, B. Z., Bajwa, A., Specter, M., & Kagal, L. (2018). Explaining ex- planations: An overview of interpretability of ma- chine learning. In 2018 IEEE 5th International Con- ference on data science and advanced analytics (DSAA) (pp. 80-89). IEEE.
- Wachter, S., Mittelstadt, B., & Russell, C. (2017). Counterfactual explanations without opening the black box: Automated decisions and the GDPR. Harvard Journal of Law & Technology, 31, 841.
- Danilevsky, M., Qian, K., Aharonov, R., Katsis, Y., Kawas, B., & Sen, P. (2020). A survey of the state of explainable AI for natural language processing. arXiv preprint arXiv:2010.00711. · arXiv
- Vig, J. (2019). A multiscale visualization of atten- tion in the transformer model. In Proceedings of the 57th Annual Meeting of the Association for Com- putational Linguistics: System Demonstrations (pp. 37-42).
- Sundararajan, M., Taly, A., & Yan, Q. (2017). Ax- iomatic attribution for deep networks. In Proceed- ings of the 34th International Conference on Ma- chine Learning (pp. 3319-3328).
- Tenney, I., Das, D., & Pavlick, E. (2019). BERT re- discovers the classical NLP pipeline. In Proceedings of the 57th Annual Meeting of the Association for Computational Linguistics (pp. 4593-4601).
- Castro, J., Gómez, D., & Tejada, J. (2009). Polyno- mial calculation of the Shapley value based on sam- pling. Computers & Operations Research, 36(5), 1726-1730.
Cited by
Sorted by citations
Zhao, Y., Wang, P., Zhao, Y., Du, H., & Yang, H. (2025) · Nature Communications · doi:10.1038/s41467-025-64574-w · Cited by 33
Chen, C. L. P., Xia, H., Zhou, W., Xia, C., Liu, M., Hao, R., & Wang, T. (2026) · Applied Intelligence · doi:10.1007/s10489-026-07102-7 · Cited by 11
Large Language Models Predict Transportation Mode Choice Behavior for a Variety of Alternative Sets
Nishida, R., Ishigaki, T., & Onishi, M. (2025) · Transportation Research Record Journal of the Transportation Research Board · doi:10.1177/03611981251352499 · Cited by 5
From Complexity to Clarity: AI/NLP’s Role in Regulatory Compliance
Jain, J., Dhanasekaran, N., & Diab, M. (2025) · Findings of the Association for Computational Linguistics: ACL (Findings of ACL) · doi:10.18653/v1/2025.findings-acl.1366 · Cited by 4
Wang, P., Wu, G., Zhao, Y., Lin, Y., & Yang, H. (2026) · Transportation Research Part C Emerging Technologies · doi:10.1016/j.trc.2026.105606 · Cited by 4
Metadata
- Authors
- Goldshmidt, R., & Horovicz, M.
- Venue
- arXiv
- Publisher
- arXiv
- Published
- 2024
- ISSN
- 2331-8422 (ISSN-L)
- arXiv
- 2407.10114
- OpenAlex
- W4400703199
- Cited by
- 2
- References
- 0
- Citations by year
- 2026: 2
- Type
- posted content
- Language
- en
- Open access
- green
- arxiv.org
- Licence
- Locations
- arXiv (Cornell University) (submittedVersion, cc-by)
- arXiv (Cornell University) (cc-by)
- Topics
- Physical Sciences › Computer Science › Artificial Intelligence › Explainable Artificial Intelligence (XAI)
- Physical Sciences › Computer Science › Artificial Intelligence › Topic Modeling
- Physical Sciences › Computer Science › Artificial Intelligence › Adversarial Robustness in Machine Learning
- Keywords
- large language models, Shapley value, Monte Carlo estimation, interpretability, cooperative game theory, prompt engineering, model transparency, explainable AI
About these checks
Registry, retraction, Cites and statistics results are computed, not judged, with one exception: a printed reference that no index lists is read once by a model before it counts as a citation error. Claims are extracted by a model and kept only when their quote appears verbatim in the text; each cited source is then checked, with a model’s help, for whether it says what the claim relies on. Those verdicts can be wrong — read the claim’s quote and the cited source before relying on one.
Statistics and arithmetic are recomputed, not judged.
Confidence bands are shown only for fields calibrated on our annotated test set. None is calibrated yet, so no band is shown.
What counts as a claim ›How we measure confidence ›How we check this ›
Are you an author, or do you see a problem with this page? Request a review
