

The DOI matches its DataCite record; 14 of the 14 references it cites were found in a registry or an index; none of the 20 sources its claims cite is checked for support yet.
Mapping waterways worldwide with deep learning
Open accessAbstract
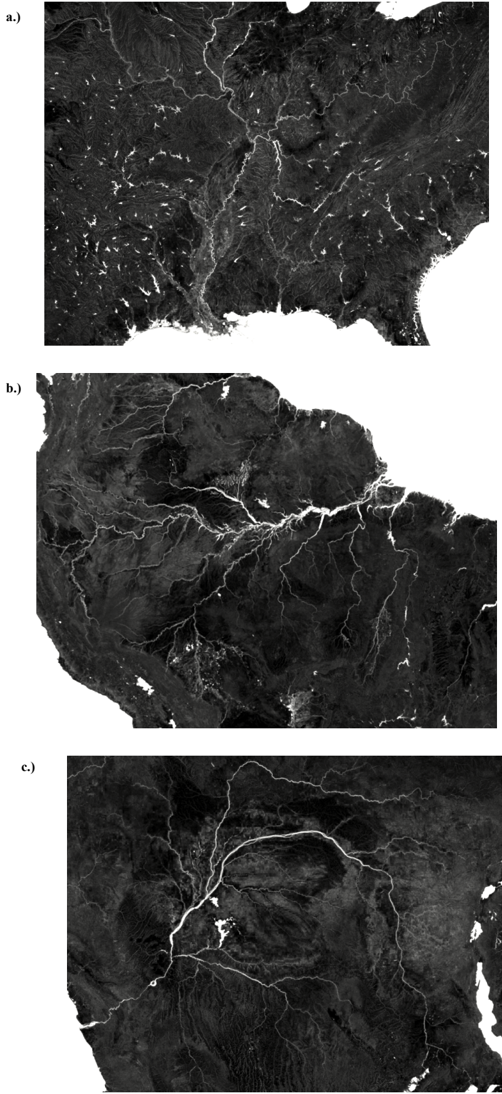
Waterways shape earth system processes and human societies, and a better understanding of their distribution can assist in a range of applications from earth system modeling to human development and disaster response. Most efforts to date to map the world's waterways have required extensive modeling and contextual expert input, and are costly to repeat. Many gaps remain, particularly in geographies with lower economic development. Here we present a computer vision model that can draw waterways based on 10m Sentinel-2 satellite imagery and the 30m GLO-30 Copernicus digital elevation model, trained using high fidelity waterways data from the United States. We couple this model with a vectorization process to map waterways worldwide. For widespread utility and downstream modelling efforts, we scaffold this new data on the backbone of existing mapped basins and waterways from another dataset, TDX-Hydro. In total, we add 124 million kilometers of waterways to the 54 million kilometers already in the TDX-Hydro dataset, more than tripling the extent of waterways mapped globally.
Overview
CoChat Summary
TL;DR
WaterNet, a U-Net/ResNet-style computer vision model, maps waterways globally from Sentinel-2 imagery and Copernicus DEM, trained on U.S. NHD data and vectorized onto the TDX-Hydro backbone. It adds ~124 million km of waterways to TDX-Hydro’s ~54 million km, more than tripling the mapped global waterway extent.
Key findings
- In total, WaterNet adds 132,986,677 km of waterway to the 58,593,547 km already in TDX-Hydro; after removing vectorization artifacts, it adds 124,678,321 km to 54,950,267 km. Gains are concentrated in low-order streams: more than 75M, 38M, and 10M new waterways for stream orders 1, 2, and 3, respectively.
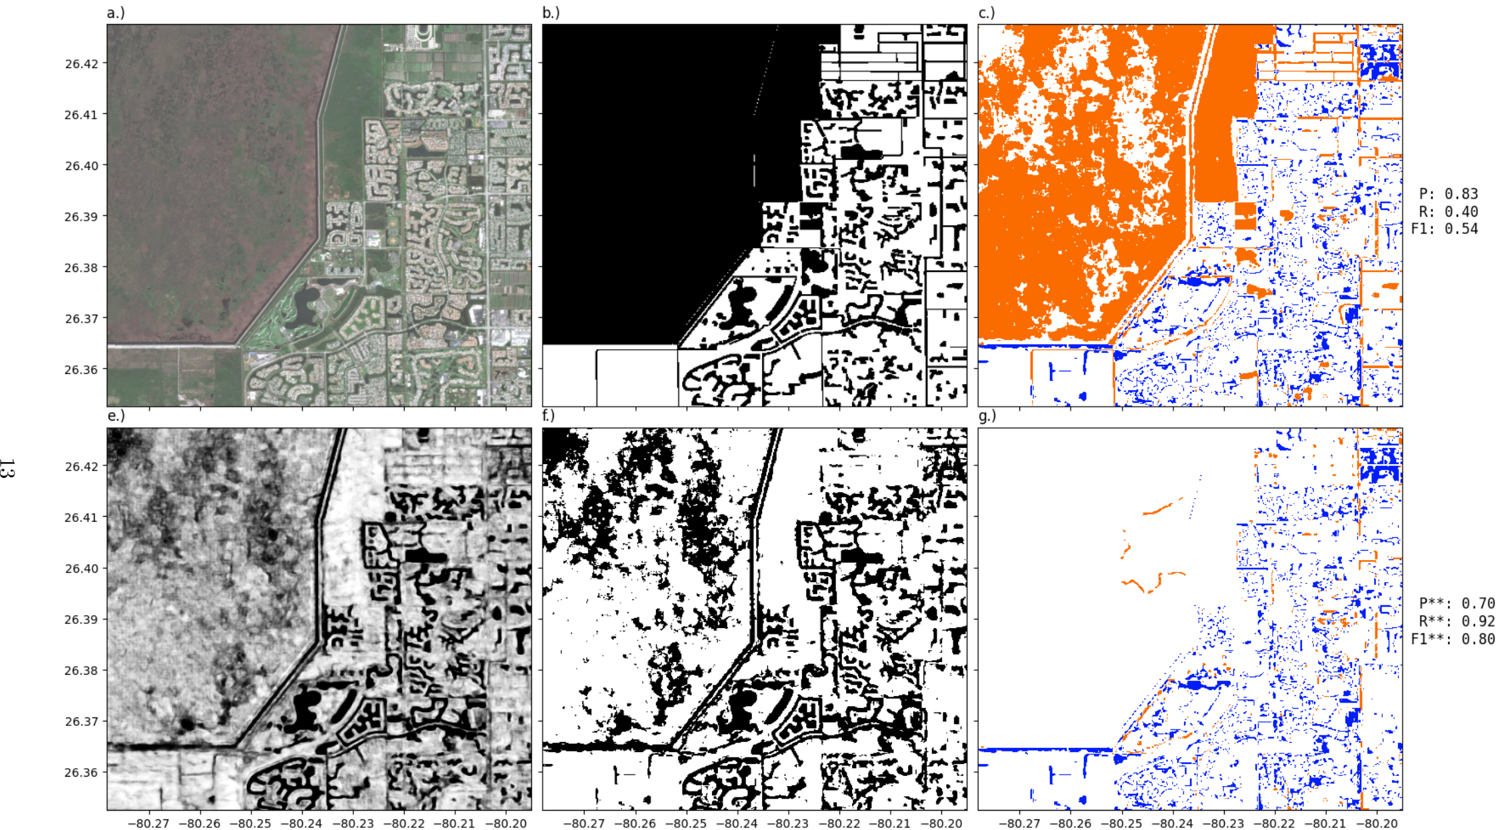
- Preferred pixel-level test statistics are precision P* = 0.8235, recall R* = 0.6446, and F1* = 0.7232; standard scores are P = 0.7200, R = 0.6034, F1 = 0.6566. Masking out waterway types masked during training gives P = 0.6888, R = 0.7236, F1 = 0.7058.
- Of waterway points, 78.05% (356,118,769/456,295,388) had a known NHD label; 59.70% of all points and 76.50% of known labeled points were Stream/River: Perennial, Intermittent, or Ephemeral. Of those 272,415,638 points, 17.34% were perennial, 59.86% intermittent, and 22.80% ephemeral.
- Global inference for circa 2023 took 9 days for raster output and 10 days for vectorization on an Intel i9 13900K 24-core CPU, Nvidia 3090Ti, and 128GB memory; the raster output is at 20m resolution.
Methods
- WaterNet is based on U-Net and ResNet ideas, with 5 encoders and 4 decoders, producing 20m raster outputs. It uses 10 input channels described as transformed Sentinel-2 NRGB, NDVI, NDWI, shifted elevation, elevation x-delta, elevation y-delta, and elevation gradient.
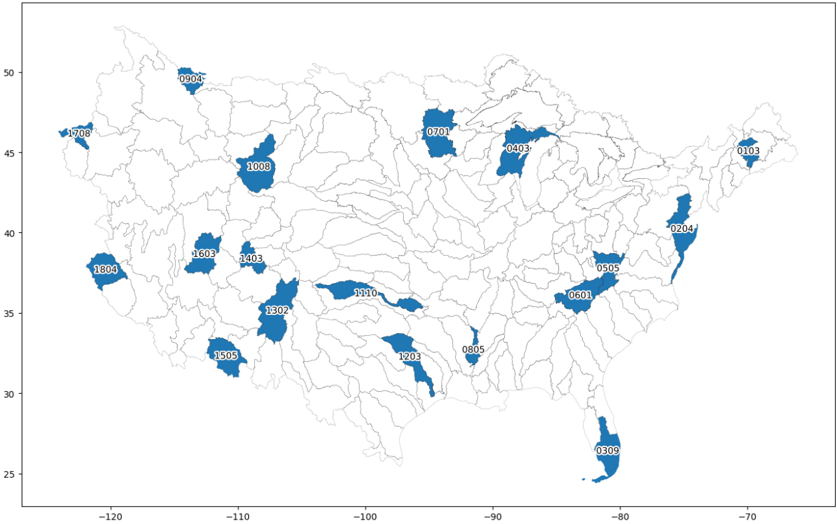
- Training used U.S. National Hydrography Dataset labels with fcode-specific weights in two steps: ~1.5M grids of 244 × 244 pixels, then ~90K grids of 832 × 832 pixels. The loss was 0.3 × weighted Binary Cross-Entropy + 0.7 × weighted Tanimoto loss; optimization used SGD with momentum and L2 regularization (lr=0.01, momentum=0.9, weight decay=0.0001), with augmentations including flipping, rotating, and dropping out 20% of input cells.
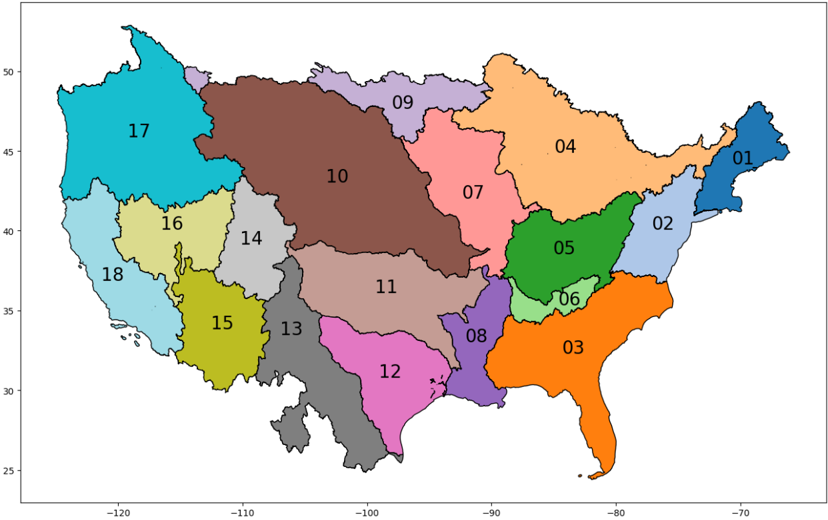
- Inputs were Sentinel-2 Level-2A NRGB and Copernicus DEM GLO-30 via the Microsoft Planetary Computer API, composited for 2023 (and 2022 if required). Raster outputs were vectorized onto the TDX-Hydro backbone using least-cost pathing to connect disconnected segments, thinning, vectorization, cycle removal, and Strahler stream order addition, scaffolded on HydroBASINS Level 2 basins.
Limitations
- Paper states the model was only trained using data from the USA; although it appears to generalize and African point validation is a good indication, continual collection of test data in new geographies and inter-comparisons with future efforts would be useful. Evident from the text: global deployment outside the U.S. training domain and prior African assessments is not independently validated in this paper.
- Paper states there is a lag between the resolution of water flow modeling and the resolution of waterways mapped by WaterNet; GEOGLOWS uses a subset of TDX-Hydro due to this mismatch and computational limitations, so a catch-up period is likely needed to operationalize the vector data. Paper also states future research could use higher-resolution DEM and satellite imagery, with trade-offs between scale, computation, acquisition, training, and inference cost; further experiments may improve representation of certain waterways in training and vectorization, and the best parametrization depends on use case.
- Paper states standard accuracy metrics are contaminated by line-width differences, masked labels lead to low recall, and intermittent lakes are a key source of inaccuracy; it recommends P*, R*, F1* for downstream tasks where all waterway structures matter. Paper also states vectorization artifacts can add multiple lines per lake (removed for length estimates), and type analysis is limited because prior intermittent/ephemeral mapping efforts fail to capture lower-order streams, making global extrapolation hard.
Model-written summary. Check it against the paper before relying on it.
Integrity signals
Registry
Cites
Statistics
Figures


Verification
Claims the paper makes
0 Valid · 0 Not valid · 16 Not checked · 44 Own results and interpretations
A result the paper reports from its own data — it cites no other source for it, so there is none to check. The quote shows it is in the paper.
In the paper
“We find that the precision (0.82), recall (0.9), and F1 (0.86) found when removing the effect of waterway thickness in raster outputs offers a better representation of the model's ability to pick up network structures than the same metrics on raw raster outputs (P=0.54,R=0.72, F1=0.62).”
§ Mapping waterways worldwide with deep learning > 4.6 Waterway type analysis
plain- Asserted: passes — The authors put it forward as true.
- Checkable: passes — It can be checked against evidence.
- Load-bearing: passes — The paper’s conclusions depend on it.
- Based: passes — The paper gives a reason why it holds.
A result the paper reports from its own data — it cites no other source for it, so there is none to check. The quote shows it is in the paper.
In the paper
“a general trend was that as stream order decreased, WaterNet added waterways that were more likely themselves ephemeral (based on nearest neighbour statistics).”
§ Mapping waterways worldwide with deep learning > 2.5 Type of waterway added
hedgedstates an association- Asserted: passes — The authors put it forward as true.
- Checkable: passes — It can be checked against evidence.
- Load-bearing: passes — The paper’s conclusions depend on it.
- Based: passes — The paper gives a reason why it holds.
A result the paper reports from its own data — it cites no other source for it, so there is none to check. The quote shows it is in the paper.
In the paper
“59.70% (272, 415, 638/456, 295, 388) of all points, 76.50% (272, 415, 638/356, 118, 769) of the known labeled points, had a label of Stream/River: Perennial, Stream/River: Intermittent, or Stream/River: Ephemeral.”
§ Mapping waterways worldwide with deep learning > 4.6 Waterway type analysis
plain- Asserted: passes — The authors put it forward as true.
- Checkable: passes — It can be checked against evidence.
- Load-bearing: unclear — It is unclear whether the paper’s conclusions depend on it.
- Based: passes — The paper gives a reason why it holds.
- Rests on an assumption not shown here.
A result the paper reports from its own data — it cites no other source for it, so there is none to check. The quote shows it is in the paper.
In the paper
“When removing artifacts from vectorization (which can add multiple lines for each lake, for example) we find we add 124,678,321 kilometers of waterway to the 54,950,267 already in TDX-Hydro.”
- Also stated in: § Abstract · hedged
“In total, we add ∼124 million kilometers of waterways to the ∼54 million kilometers already in the TDX-Hydro dataset”
§ Mapping waterways worldwide with deep learning > 2.4 Total waterways added
plainstates a cause- Asserted: passes — The authors put it forward as true.
- Checkable: passes — It can be checked against evidence.
- Load-bearing: passes — The paper’s conclusions depend on it.
- Based: passes — The paper gives a reason why it holds.
- Rests on an assumption not shown here.
- Also stated in: § Abstract · hedged
A result the paper reports from its own data — it cites no other source for it, so there is none to check. The quote shows it is in the paper.
In the paper
“We find that the precision (0.82), recall (0.9), and F1 (0.86) found when removing the effect of waterway thickness in raster outputs offers a better representation of the model's ability to pick up network structures than the same metrics on raw raster outputs (P=0.54,R=0.72, F1=0.62).”
§ Mapping waterways worldwide with deep learning > 4.6 Waterway type analysis
plain- Asserted: passes — The authors put it forward as true.
- Checkable: passes — It can be checked against evidence.
- Load-bearing: unclear — It is unclear whether the paper’s conclusions depend on it.
- Based: passes — The paper gives a reason why it holds.
32 more claims
Create a free account to see all 60 claims and every source verdict.
- It may state two separate claims as one. 17
- Probably not a substantial claim. 8
Self-check
Percentages, sums and reported differences re-computed from the paper’s own numbers.
Each contradiction between two passages listed here was confirmed by an independent check.
Rated minor: it would not touch a result — a value no result rests on, a p-value that stays on the same side of the significance level, or a conflict that is clerical, resolved elsewhere in the paper, or outside its own findings.
In the paper
§ Mapping waterways worldwide with deep learning > 2.1 Model overview
“Our input features includes 10 channels: the first four being transformed Sentinel-2 NRGB channels (N RGB t ), and the remaining 7 being N DV I, N DW I, Shifted Elevation (E S ), Elevation x-delta (∆ x E), Elevation y-delta (∆ y E), elevation gradient (∇E).”
§ Mapping waterways worldwide with deep learning > 4.1.2 Input data preparation
“The model has 10 channel inputs: Transformed Sentinel NRGB (N RGB t ), N DV I, N DW I, Shifted Elevation (E S ), Elevation x-delta (∆ x E), Elevation y-delta (∆ y E), elevation gradient (∇E).”
Citations
Cites
High-resolution mapping of global surface water and its long-term changes
Pekel, J.-F., Cottam, A., Gorelick, N., & Belward, A. S. (2016) · Nature · doi:10.1038/nature20584 · Cited by 5,513
U-Net: Convolutional Networks for Biomedical Image SegmentationPreprint
Ronneberger, O., Fischer, P., & Brox, T. (2015) · arXiv (Cornell University) · doi:10.48550/arxiv.1505.04597 · Cited by 5,282
Deep Residual Learning for Image Recognition
He, K., Zhang, X., Ren, S., & Sun, J. (2015) · arXiv · doi:10.48550/arxiv.1512.03385 · Cited by 4,196
Lehner, B., & Grill, G. (2013) · Hydrological Processes · doi:10.1002/hyp.9740 · Cited by 2,193
Global extent of rivers and streams
Allen, G. H., & Pavelsky, T. M. (2018) · Science · doi:10.1126/science.aat0636 · Cited by 970
Global prevalence of non-perennial rivers and streams
Messager, M. L., Lehner, B., Cockburn, C., Lamouroux, N., Pella, H., Snelder, T., Tockner, K., Trautmann, T., Watt, C., & Datry, T. (2021) · Nature · doi:10.1038/s41586-021-03565-5 · Cited by 581
Global prediction of extreme floods in ungauged watersheds
Nearing, G., Cohen, D., Dube, V., Gauch, M., Gilon, O., Harrigan, S., Hassidim, A., Klotz, D., Kratzert, F., Metzger, A., et al. (2024) · Nature · doi:10.1038/s41586-024-07145-1 · Cited by 381
Lindersson, S., Brandimarte, L., Mård, J., & Baldassarre, G. D. (2020) · Wiley Interdisciplinary Reviews Water · doi:10.1002/wat2.1424 · Cited by 94
Advancing global hydrologic modeling with the GEOGloWS ECMWF streamflow service
Hales, R. C., Nelson, E. J., Souffront, M., Gutierrez, A. L., Prudhomme, C., Kopp, S., Ames, D. P., Williams, G. P., & Jones, N. L. (2022) · Journal of Flood Risk Management · doi:10.1111/jfr3.12859 · Cited by 68
Ephemeral stream water contributions to United States drainage networks
Brinkerhoff, C., Gleason, C. J., Kotchen, M. J., Kysar, D. A., & Raymond, P. A. (2024) · Science · doi:10.1126/science.adg9430 · Cited by 68
Cited by
Segerberg, B., & Noriega, A. (2026) · Sustainability · doi:10.3390/su18062842 · Cited by 2
Metadata
- Authors
- Pierson, M., & Mehrabi, Z.
- ORCID
- Mehrabi, Zia
- Venue
- arXiv
- Publisher
- arXiv
- Published
- 2024
- ISSN
- 2331-8422 (ISSN-L)
- arXiv
- 2412.00050
- OpenAlex
- W4405032477
- Cited by
- 1
- References
- 14
- Citations by year
- 2026: 1
- Type
- posted content
- Language
- en
- Open access
- green
- arxiv.org
- Licence
- Locations
- arXiv (Cornell University) (submittedVersion, cc-by-sa)
- arXiv (Cornell University) (cc-by-sa)
- Topics
- Physical Sciences › Computer Science › Computer Vision and Pattern Recognition › Automated Road and Building Extraction
- Physical Sciences › Computer Science › Computer Vision and Pattern Recognition › Remote-Sensing Image Classification
- Physical Sciences › Environmental Science › Global and Planetary Change › Flood Risk Assessment and Management
- Keywords
- computer vision, Sentinel-2 imagery, digital elevation model, vectorization, Earth system modeling, hydrography
About these checks
Registry, retraction, Cites and statistics results are computed, not judged, with one exception: a printed reference that no index lists is read once by a model before it counts as a citation error. Claims are extracted by a model and kept only when their quote appears verbatim in the text; each cited source is then checked, with a model’s help, for whether it says what the claim relies on. Those verdicts can be wrong — read the claim’s quote and the cited source before relying on one.
A language model drew the claims from the paper on 2026-11-19, under version 3 of the claim definition (model deepseek-v4.1-flash, prompt extract-v3).
A second model labelled each claim on 2026-11-19 (model jev-1.13-20260917, definition revision gold-guideline-v0.2).
Statistics and arithmetic are recomputed, not judged.
Confidence bands are shown only for fields calibrated on our annotated test set. None is calibrated yet, so no band is shown.
What counts as a claim ›How we measure confidence ›How we check this ›
Are you an author, or do you see a problem with this page? Request a review
How to cite
Cite CoChat for the checks on this page, and the paper for its own findings.
- This page
- CoChat. (2026). Citation check: Mapping waterways worldwide with deep learning. https://app.cochat.ai/papers/10.48550/arxiv.2412.00050
- The paper
- Pierson, M., & Mehrabi, Z. (2024). Mapping waterways worldwide with deep learning. arXiv. https://doi.org/10.48550/arxiv.2412.00050
Data sources
Bibliographic data: Semantic Scholar, OpenAlex, Crossref.
Contains information from the Semantic Scholar Academic Graph Datasets, made available under the ODC Attribution License (ODC-BY 1.0).
Semantic Scholar’s data is described in: Kinney, R., et al. (2023). The Semantic Scholar Open Data Platform. arXiv:2301.10140.
