

The DOI matches its DataCite record; 1 of the 1 references it cites were found in a registry or an index.
Conformal Tail Risk Control for Large Language Model Alignment
Abstract
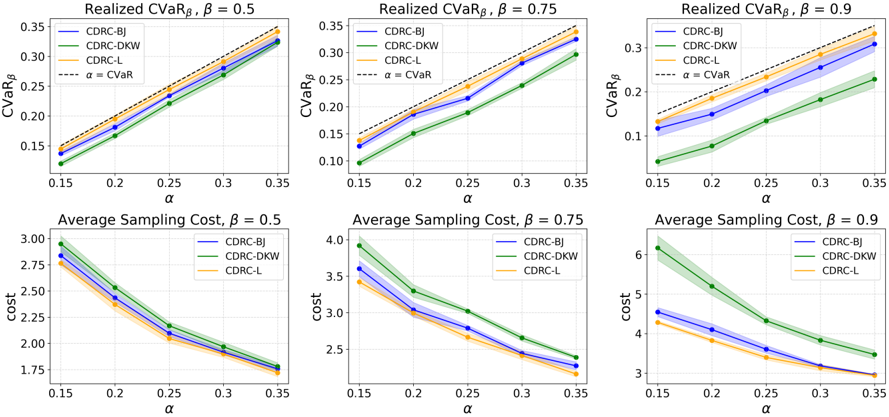
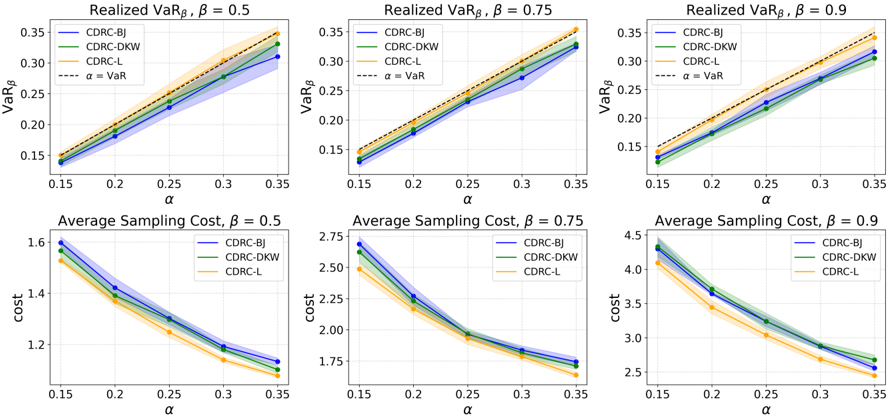
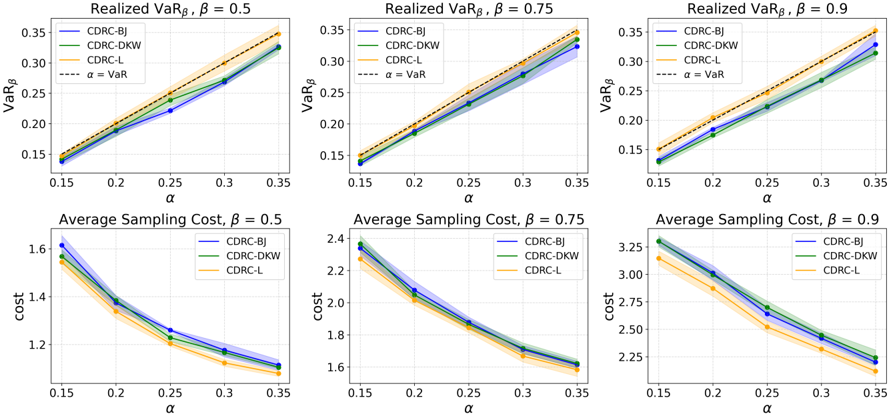
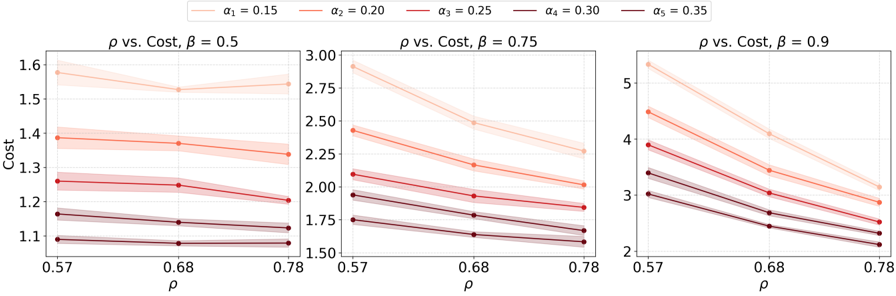
Recent developments in large language models (LLMs) have led to their widespread usage for various tasks. The prevalence of LLMs in society implores the assurance on the reliability of their performance. In particular, risk-sensitive applications demand meticulous attention to unexpectedly poor outcomes, i.e., tail events, for instance, toxic answers, humiliating language, and offensive outputs. Due to the costly nature of acquiring human annotations, general-purpose scoring models have been created to automate the process of quantifying these tail events. This phenomenon introduces potential human-machine misalignment between the respective scoring mechanisms. In this work, we present a lightweight calibration framework for blackbox models that ensures the alignment of humans and machines with provable guarantees. Our framework provides a rigorous approach to controlling any distortion risk measure that is characterized by a weighted average of quantiles of the loss incurred by the LLM with high confidence. The theoretical foundation of our method relies on the connection between conformal risk control and a traditional family of statistics, i.e., L-statistics. To demonstrate the utility of our framework, we conduct comprehensive experiments that address the issue of human-machine misalignment.
Overview
The claims and statistics of this paper haven’t been checked yet.
Run the check — free, no account needed. It reads the open-access text and checks the sources it cites.
Integrity signals
Registry
Cites
Statistics
Figures

Verification
Claims the paper makes
The claims and statistics of this paper haven’t been checked yet.
Run the check — free, no account needed. It reads the open-access text and checks the sources it cites.
Claims other papers make about this one
Each is checked against this paper’s own text: does it say what the citing paper says it does?
In the citing paper
“Recent work has begun applying conformal prediction methods to LLM safety, controlling tail risks (Chen et al., 2025), improving factuality (Cherian et al., 2024), and mediating between helpfulness and harmlessness (Overman & Bayati, 2025), but these approaches predominantly address singleturn interactions rather than extended trajectories where actions compound.”
From Calibrating Conservatism for Scalable Oversight (2026) · cites this paper as Chen et al., 2025
Self-check
Percentages, sums and reported differences re-computed from the paper’s own numbers.
The self-check needs the paper’s full text.
Citations
Cites
Deep reinforcement learning from human preferences
Christiano, P., Leike, J., Brown, T. B., Martic, M., Legg, S., & Amodei, D. (2017) · arXiv · doi:10.48550/arxiv.1706.03741 · Cited by 1,058
Research works printed but not linked: 18
- A. N. Angelopoulos, S. Bates, E. J. Candès, M. I. Jordan, and L. Lei. Learn then test: Calibrating predictive algorithms to achieve risk control. CoRR, abs/2110.01052, 2021. · arXiv
- A. Balbás, J. Garrido, and S. Mayoral. Properties of distortion risk measures. Methodology and Computing in Applied Probability, 11(3):385-399, 2009.
- S. Bates, E. Candès, L. Lei, Y. Romano, and M. Sesia. Testing for outliers with conformal p-values. The Annals of Statistics, 51(1):149-178, 2023.
- E. Candès, L. Lei, and Z. Ren. Conformalized survival analysis. Journal of the Royal Statistical Society Series B: Statistical Methodology, 85(1):24-45, 2023.
- S. Casper, S. Zhang, A. Holtzman, J. Kreutzer, C. Zhu, M. Ranzato, and N. Stiennon. Open problems and fundamental limitations of reinforcement learning from human feedback. arXiv preprint arXiv:2307.15217, 2023. · arXiv
- M. Csörgő and P. Révész. Strong approximations of the quantile process. The Annals of Statistics, pages 882-894, 1978.
- J. C. Gardiner and P. Kumar Sen. Asymptotic normality of a variance estimator of a linear combination of a function of order statistics. Zeitschrift für Wahrscheinlichkeitstheorie und verwandte Gebiete, 50(2):205-221, 1979.
- S. Gehman, S. Gururangan, M. Sap, Y. Choi, and N. A. Smith. Realtoxicityprompts: Evaluating neural toxic degeneration in language models. arXiv preprint arXiv:2009.11462, 2020. · arXiv
- J. Kiefer. Deviations between the sample quantile process and the sample df. Non-parametric Techniques in Statistical Inference, pages 299-319, 1970.
- L. Lei and E. J. Candès. Conformal inference of counterfactuals and individual treatment effects. Journal of the Royal Statistical Society Series B: Statistical Methodology, 83(5):911- 938, 2021.
- A. Moscovich and B. Nadler. Fast calculation of boundary crossing probabilities for poisson processes. Statistics & Probability Letters, 123:177-182, 2017.
- F. Mosteller. On some useful" inefficient" statistics. Annals of Mathematical Statisitcs, 17:377-408, 1946.
- S. M. Stigler. Linear functions of order statistics with smooth weight functions. The Annals of Statistics, pages 676-693, 1974.
- R. J. Tibshirani, R. Foygel Barber, E. Candes, and A. Ramdas. Conformal prediction under covariate shift. Advances in neural information processing systems, 32, 2019.
- H. Touvron, L. Martin, K. Stone, P. Albert, A. Almahairi, Y. Babaei, N. Bashlykov, S. Batra, P. Bhargava, S. Bhosale, et al. Llama 2: Open foundation and fine-tuned chat models. arXiv preprint arXiv:2307.09288, 2023. · arXiv
- J. W. Tukey. The future of data analysis. In Breakthroughs in Statistics: Methodology and Distribution, pages 408-452. Springer, 1962.
- A. van der Vaart. Asymptotic Statistics. Cambridge Series in Statistical and Probabilistic Mathematics. Cambridge University Press, 1998.
- D. M. Ziegler, N. Stiennon, J. Wu, T. Brown, A. Radford, D. Amodei, P. Christiano, and G. Irving. Fine-tuning language models from human preferences. arXiv preprint arXiv:1909.08593, 2019. · arXiv
Cited by
Sorted by citations
Calibrating Conservatism for Scalable Oversight
Overman, W., & Bayati, M. (2026) · arXiv · doi:10.48550/arxiv.2605.28807
“Recent work has begun applying conformal prediction meth-ods to LLM safety, controlling tail risks (Chen et al., 2025), improving factuality (Cherian et al., 2024), and mediating between helpfulness and harmlessness (Overman & Bayati, 2025), but these approaches predominantly address single-turn…”
Metadata
- Authors
- Chen, C. Y.-C., Shen, J., Deng, Z., & Lei, L.
- Venue
- arXiv
- Publisher
- arXiv
- Published
- 2025
- arXiv
- 2502.20285
- References
- 1
- Type
- Preprint
About these checks
Registry, retraction, Cites and statistics results are computed, not judged, with one exception: a printed reference that no index lists is read once by a model before it counts as a citation error. Claims are extracted by a model and kept only when their quote appears verbatim in the text; each cited source is then checked, with a model’s help, for whether it says what the claim relies on. Those verdicts can be wrong — read the claim’s quote and the cited source before relying on one.
Statistics and arithmetic are recomputed, not judged.
Confidence bands are shown only for fields calibrated on our annotated test set. None is calibrated yet, so no band is shown.
What counts as a claim ›How we measure confidence ›How we check this ›
Are you an author, or do you see a problem with this page? Request a review
