

The DOI matches its Crossref record; 20 of the 20 references it cites were found in a registry or an index.
TITAN automatic spatial quality control of meteorological in-situ observations
Open accessAbstract
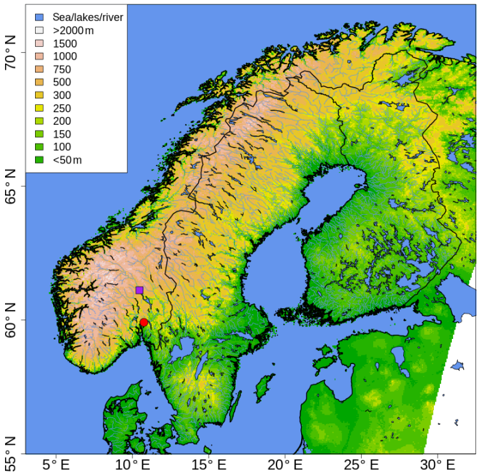
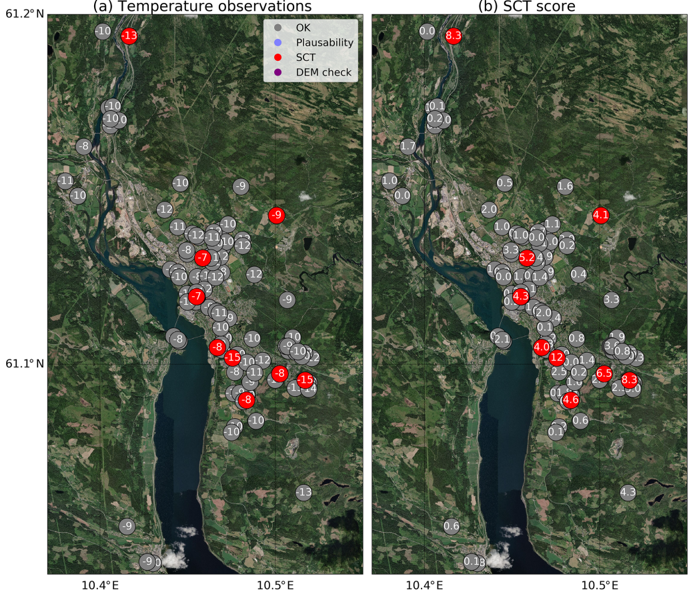
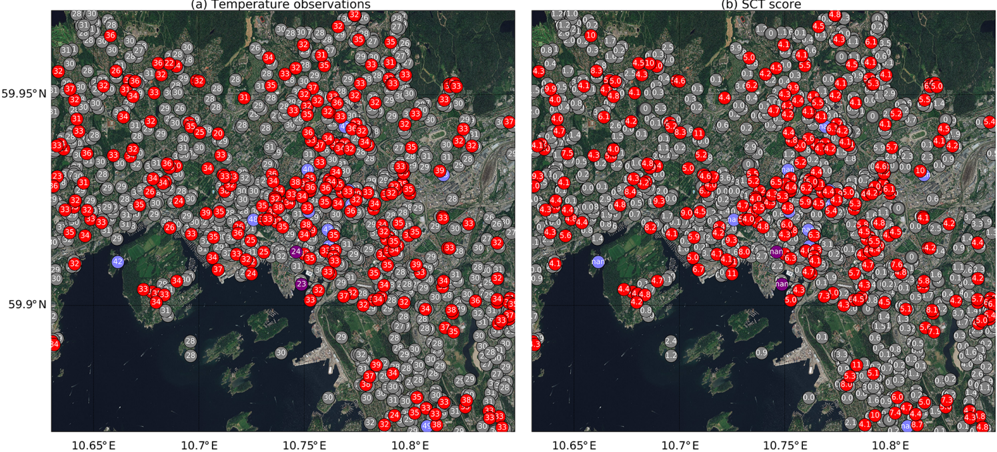
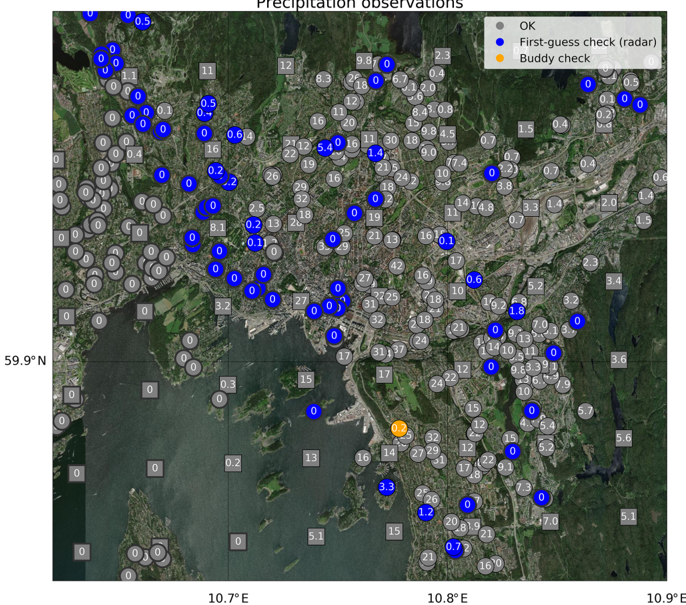
Abstract. In science, poor quality input data will invariably lead to faulty conclusions, as in the spirit of the saying “garbage in, garbage out”. Atmospheric sciences make no exception and correct data is crucial to obtain a useful representation of the real world in meteorological, climatological and hydrological applications. Titan is a computer program for the automatic quality control of meteorological data that has been designed to serve real-time operational applications that process massive amounts of observations measured by networks of automatic weather stations. The need to quality control third-party data, such as citizen observations, within a station network that is constantly changing was an important motivation that led to the development of Titan. The quality control strategy adopted is a sequence of tests, where several of them utilize the expected spatial consistency between nearby observations. The spatial continuity can also be evaluated against independent data sources, such as numerical model output and remote sensing measurements. Examples of applications of Titan for the quality control of near-surface hourly temperature and precipitation over Scandinavia are presented. In the case of temperature, this specific application has been integrated into the operational production chain of automatic weather forecasts at the Norwegian Meteorological Institute (MET Norway). Titan is an open source project and it is made freely available for public download. One of the objectives of the Titan project is to establish a community working on common tools for automatic quality control, and the Titan program represents a first step in that direction for MET Norway. Further developments are necessary to achieve a solution that satisfies more users, for this reason we are currently working on transforming Titan into a more flexible library of functions.
Overview
The claims and statistics of this paper haven’t been checked yet.
Run the check — free, no account needed. It reads the open-access text and checks the sources it cites.
Integrity signals
Registry
Cites
Statistics
Figures
Verification
Claims the paper makes
The claims and statistics of this paper haven’t been checked yet.
Run the check — free, no account needed. It reads the open-access text and checks the sources it cites.
Claims other papers make about this one
Each is checked against this paper’s own text: does it say what the citing paper says it does?
In the citing paper
“For this method to be effective, there must be at least three, but preferably five stations that can be grouped together within a defined radius.”
From A machine learning approach using autoencoders to perform quality control on meteorological data (2026) · cites this paper as Båserud et al., 2020
Self-check
Percentages, sums and reported differences re-computed from the paper’s own numbers.
The self-check needs the paper’s full text.
Citations
Cites
Lanzante, J. R. (1996) · International Journal of Climatology · doi:10.1002/(sici)1097-0088(199611)16:11<1197::aid-joc89>3.0.co;2-l · Cited by 645
Crowdsourcing air temperature from citizen weather stations for urban climate research
Meier, F., Fenner, D., Grassmann, T., Otto, M., & Scherer, D. (2017) · Urban Climate · doi:10.1016/j.uclim.2017.01.006 · Cited by 272
Frei, C. (2013) · International Journal of Climatology · doi:10.1002/joc.3786 · Cited by 232
Chapman, L., Bell, C., & Bell, S. (2016) · International Journal of Climatology · doi:10.1002/joc.4940 · Cited by 192
Modeling errors in daily precipitation measurements: Additive or multiplicative?
Tian, Y., Huffman, G. J., Adler, R. F., Tang, L., Sapiano, M. R. P., Maggioni, V., & Wu, H. (2013) · Geophysical Research Letters · doi:10.1002/grl.50320 · Cited by 185
Wolff, M. A., Isaksen, K., Petersen-Øverleir, A., Ødemark, K., Reitan, T., & Brækkan, R. (2015) · Hydrology and Earth System Sciences · doi:10.5194/hess-19-951-2015 · Cited by 185
Complex Quality Control of Meteorological Observations
Gandin, L. S. (1988) · Monthly Weather Review · Cited by 169
Quality Control for Crowdsourced Personal Weather Stations to Enable Operational Rainfall Monitoring
de Vos, L. W., Leijnse, H., Overeem, A., & Uijlenhoet, R. (2019) · Geophysical Research Letters · doi:10.1029/2019gl083731 · Cited by 141
The potential of urban rainfall monitoring with crowdsourced automatic weather stations in Amsterdam
de Vos, L. W., Leijnse, H., Overeem, A., & Uijlenhoet, R. (2017) · Hydrology and earth system sciences · doi:10.5194/hess-21-765-2017 · Cited by 138
Napoly, A., Grassmann, T., Meier, F., & Fenner, D. (2018) · Frontiers in Earth Science · doi:10.3389/feart.2018.00118 · Cited by 136
Research works printed but not linked: 1
- Gandin, L. S. and Hardin, R.: Objective analysis of meteorologi- cal fields, in: vol. 242, Israel program for scientific translations, Jerusalem, 1965.
Cited by
Beele, E., Reyniers, M., Aerts, R., & Somers, B. (2022) · Earth System Science Data Discussions · doi:10.5194/essd-2022-113 · Cited by 44
Automatic quality control of weather data for timely decisions in agriculture
Dandrifosse, S., Jago, A., Huart, J. P., Michaud, V., Planchon, V., & Rosillon, D. (2024) · Smart Agricultural Technology · doi:10.1016/j.atech.2024.100445 · Cited by 24
Ośródka, K., Otop, I., & Szturc, J. (2022) · Atmospheric Measurement Techniques · doi:10.5194/amt-15-5581-2022 · Cited by 20
A machine learning approach using autoencoders to perform quality control on meteorological data
Spohn, T. K., Walsh, E., Horan, K., O’Donoghue, J., Charnecki, T., Haslam, M., & Gallagher, S. (2026) · Environmental Data Science · doi:10.1017/eds.2026.10030 · Cited by 1
“This paper presents Met Éireann ’ s recent work in developing ML-based QC systems, including the integration of open-source tools such as Titan (Båserud et al., 2020) and the application of deep learning models to observational data.”
Influential
Metadata
- Authors
- Båserud, L., Lussana, C., Nipen, T. N., Seierstad, I. A., Oram, L., & Aspelien, T.
- Affiliations
- Norwegian Meteorological Institute (NO)
- Corresponding author
- Båserud, Line
- Lussana, Cristian
- Nipen, Thomas N.
- Seierstad, Ivar A.
- Oram, Louise
- Aspelien, Trygve
- Venue
- Advances in Science and Research
- Publisher
- Copernicus GmbH
- Published
- 2020-07-22
- Volume
- 17
- Pages
- 153-163
- ISSN
- 1992-0628 (ISSN-L)
- 1992-0636
- OpenAlex
- W3044689994
- Cited by
- 54
- References
- 20
- Citations by year
- 2026: 7 · 2025: 11 · 2024: 13 · 2023: 3 · 2022: 13 · 2021: 7
- FWCI
- 1.88
- Type
- journal article
- Language
- en
- Open access
- gold
- doi.org
- Locations
- Advances in science and research (publishedVersion, cc-by)
- DOAJ (DOAJ: Directory of Open Access Journals) (submittedVersion, cc-by-sa)
- Topics
- Physical Sciences › Earth and Planetary Sciences › Atmospheric Science › Precipitation Measurement and Analysis
- Physical Sciences › Environmental Science › Management, Monitoring, Policy and Law › Environmental Monitoring and Data Management
- Physical Sciences › Earth and Planetary Sciences › Atmospheric Science › Meteorological Phenomena and Simulations
- Keywords
- automated quality control, automatic weather station, spatial consistency, near-surface temperature, precipitation, numerical model output, remote sensing validation, open source software, Scandinavia
About these checks
Registry, retraction, Cites and statistics results are computed, not judged, with one exception: a printed reference that no index lists is read once by a model before it counts as a citation error. Claims are extracted by a model and kept only when their quote appears verbatim in the text; each cited source is then checked, with a model’s help, for whether it says what the claim relies on. Those verdicts can be wrong — read the claim’s quote and the cited source before relying on one.
Statistics and arithmetic are recomputed, not judged.
Confidence bands are shown only for fields calibrated on our annotated test set. None is calibrated yet, so no band is shown.
What counts as a claim ›How we measure confidence ›How we check this ›
Are you an author, or do you see a problem with this page? Request a review
Data sources
Bibliographic data: Semantic Scholar, OpenAlex, Crossref.
Contains information from the Semantic Scholar Academic Graph Datasets, made available under the ODC Attribution License (ODC-BY 1.0).
Semantic Scholar’s data is described in: Kinney, R., et al. (2023). The Semantic Scholar Open Data Platform. arXiv:2301.10140.
