

The DOI matches its Crossref record.
Orbital control on late Miocene climate and the North African monsoon: insight from an ensemble of sub-precessional simulations
Published version of a preprint
Abstract
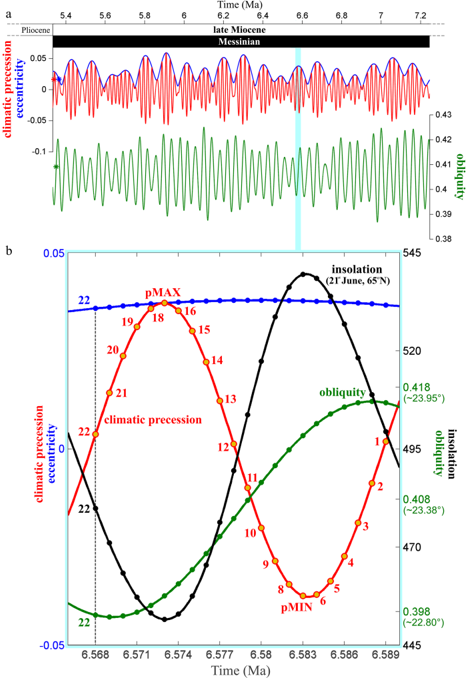
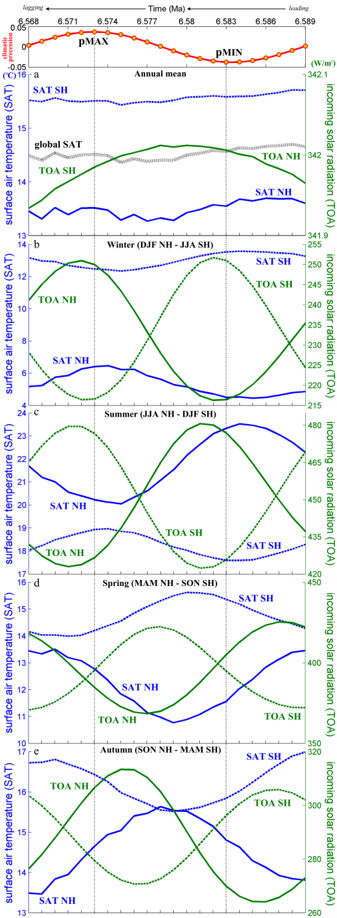
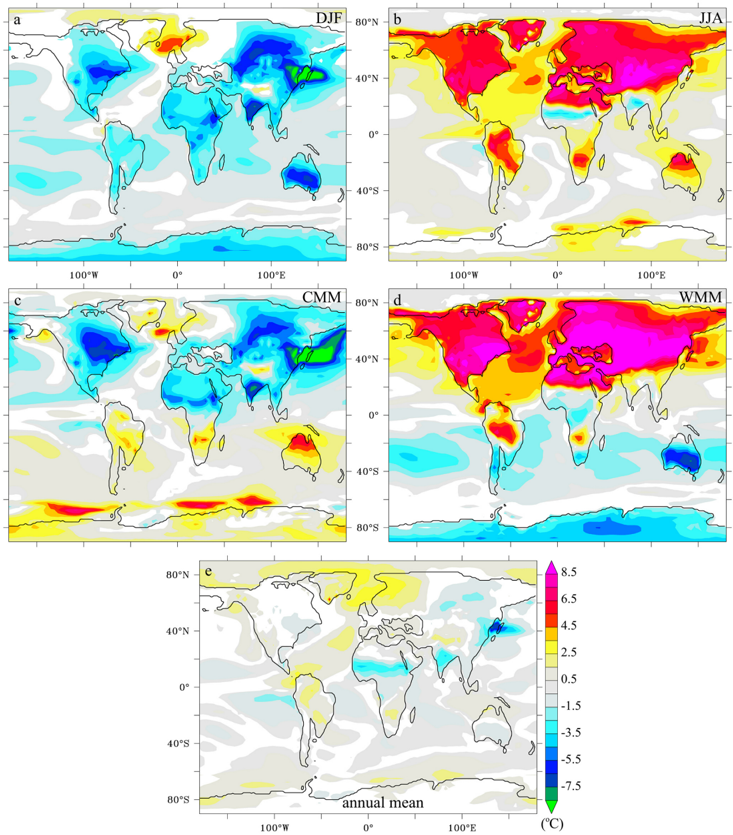
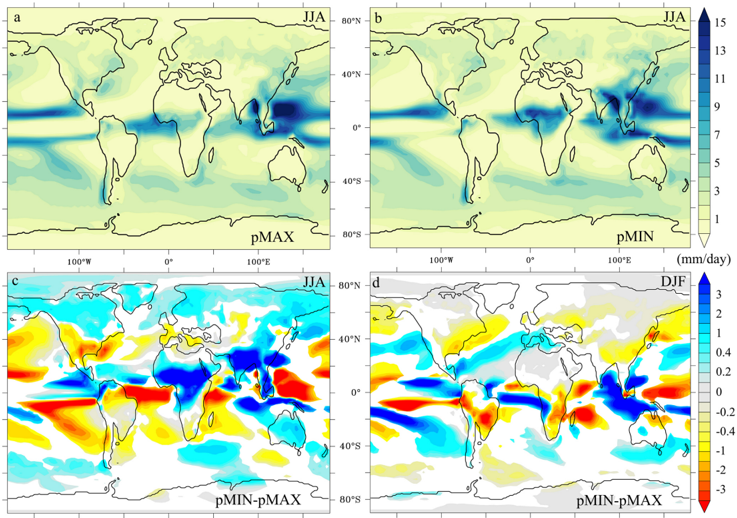
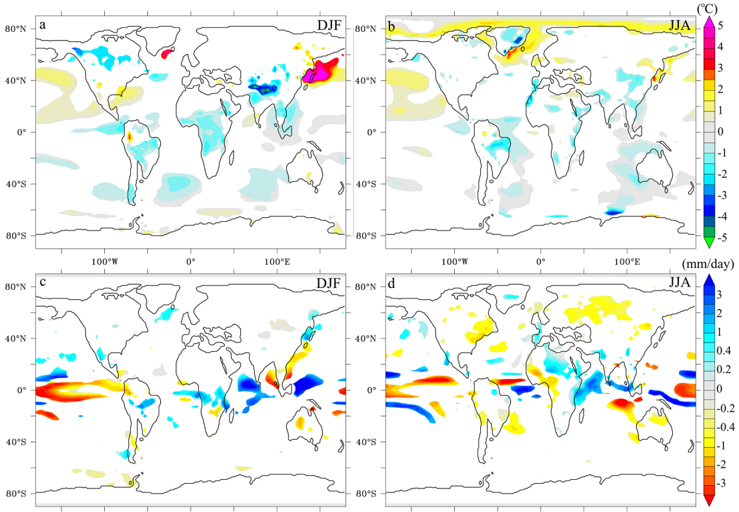
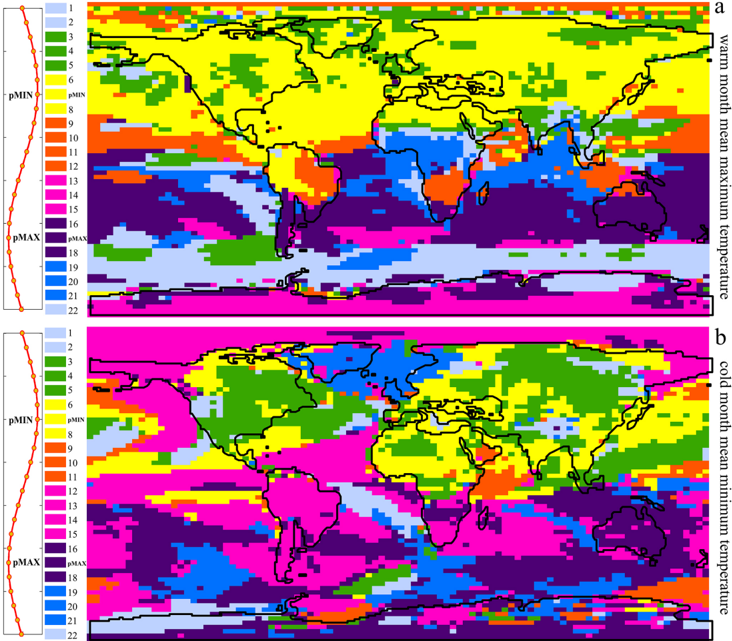
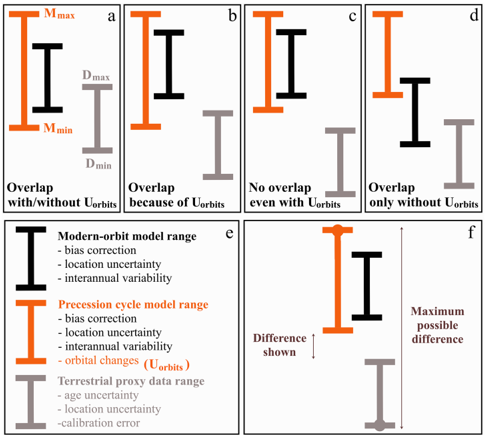
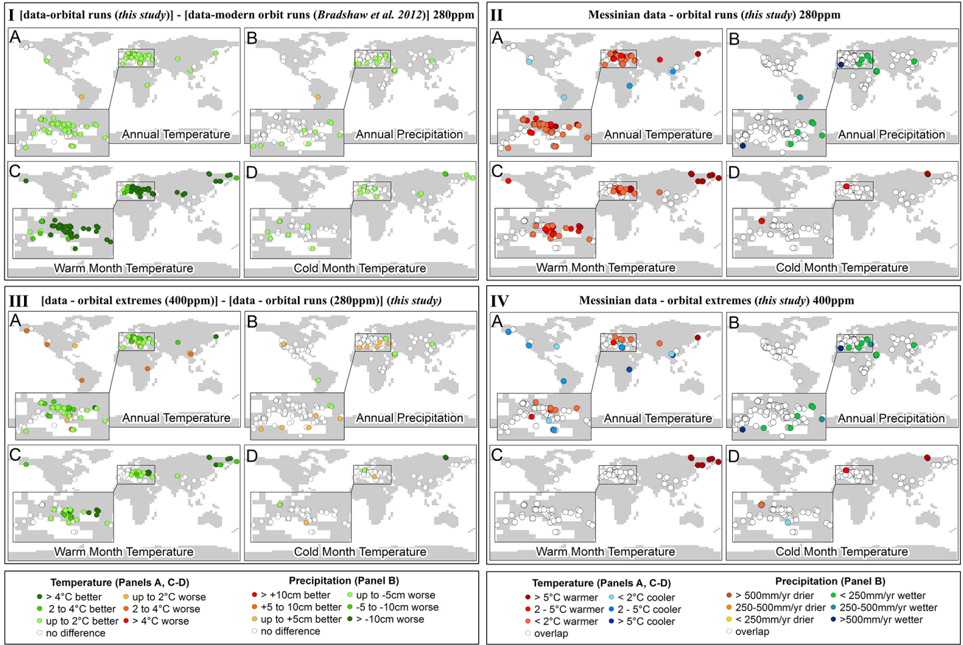
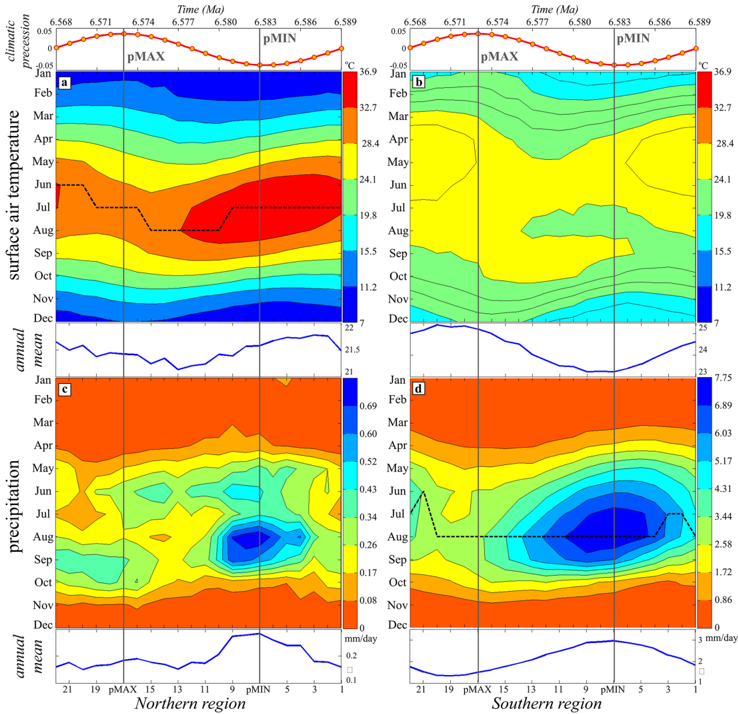
Abstract. Orbital forcing is a key climate driver over multi-millennial timescales. In particular, monsoon systems are thought to be driven by orbital cyclicity, especially by precession. Here, we analyse the impact of orbital forcing on global climate with a particular focus on the North African monsoon, by carrying out an ensemble of 22 equally spaced (one every 1000 years) atmosphere–ocean–vegetation simulations using the HadCM3L model, covering one full late Miocene precession-driven insolation cycle with varying obliquity (between 6.568 and 6.589 Ma). The simulations only differ in their prescribed orbital parameters, which vary realistically for the selected time period. We have also carried out two modern-orbit control experiments, one with late Miocene and one with present-day palaeogeography, and two additional sensitivity experiments for the orbital extremes with varying CO2 forcing. Our results highlight the high sensitivity of the North African summer monsoon to orbital forcing, with strongly intensified precipitation during the precession minimum, leading to a northward penetration of vegetation up to ~ 21° N. The modelled summer monsoon is also moderately sensitive to palaeogeography changes, but it has a low sensitivity to atmospheric CO2 concentration between 280 and 400 ppm. Our simulations allow us to explore the climatic response to orbital forcing not only for the precession extremes but also on sub-precessional timescales. We demonstrate the importance of including orbital variability in model–data comparison studies, because doing so partially reduces the mismatch between the late Miocene terrestrial proxy record and model results. Failure to include orbital variability could also lead to significant miscorrelations in temperature-based proxy reconstructions for this time period, because of the asynchronicity between maximum (minimum) surface air temperatures and minimum (maximum) precession in several areas around the globe. This is of particular relevance for the North African regions, which have previously been identified as optimal areas to target for late Miocene palaeodata acquisition.
Overview
The claims and statistics of this paper haven’t been checked yet.
Run the check — free, no account needed. It reads the open-access text and checks the sources it cites.
Integrity signals
Registry
Cites
Statistics
Figures
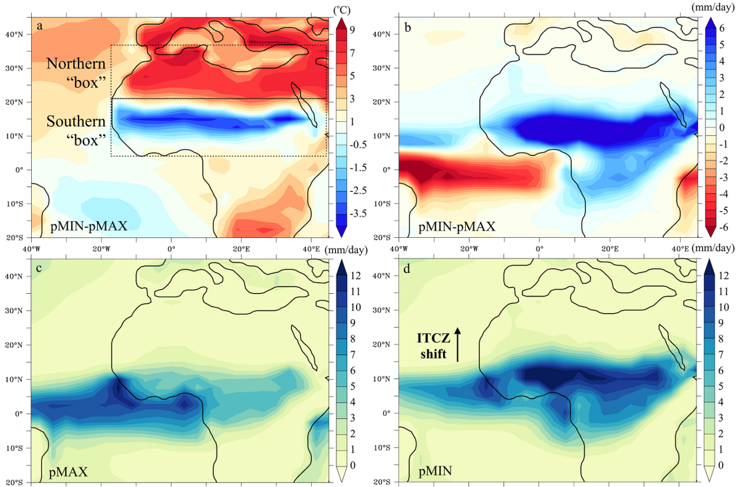
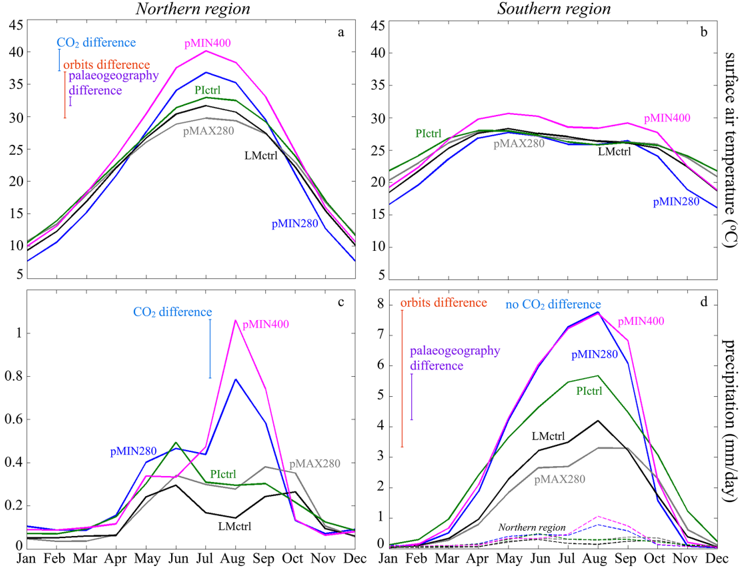
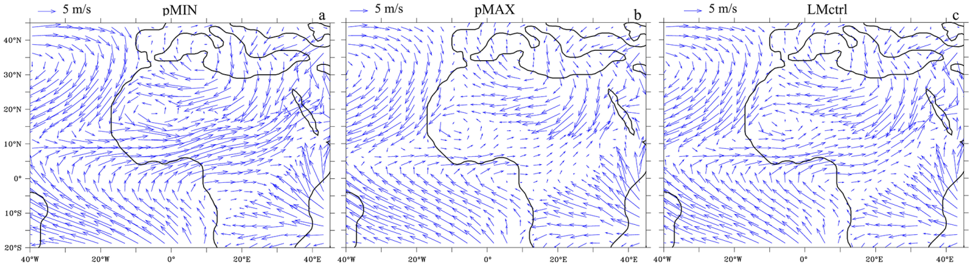
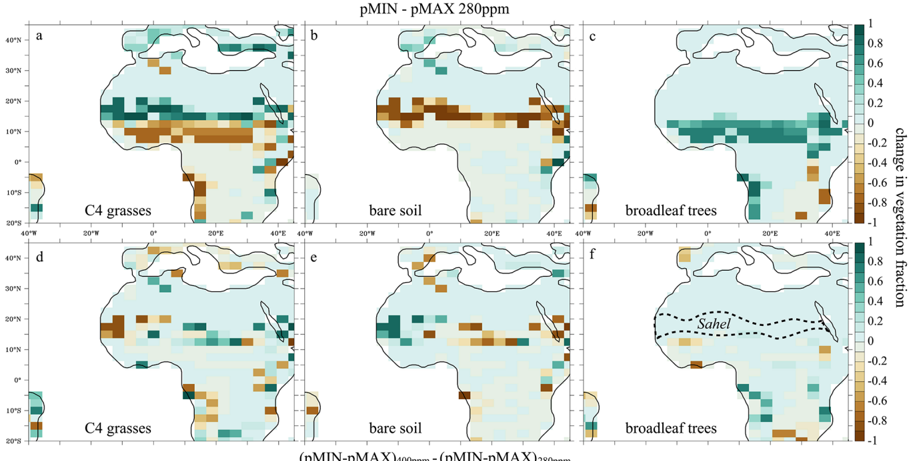
Verification
Claims the paper makes
The claims and statistics of this paper haven’t been checked yet.
Run the check — free, no account needed. It reads the open-access text and checks the sources it cites.
Claims other papers make about this one
Each is checked against this paper’s own text: does it say what the citing paper says it does?
In the citing paper
“HadCM3L has contributed to the Coupled Mode Intercomparison Project experiments demonstrating skill at reproducing the modern-day climate (71, 72) and has been used for an array of different paleoclimate experiments (73–75).”
From Asteroid impact, not volcanism, caused the end-Cretaceous dinosaur extinction (2020) · cites this paper as [74]
Self-check
Percentages, sums and reported differences re-computed from the paper’s own numbers.
The self-check needs the paper’s full text.
Citations
Cites
No references could be resolved yet.
Research works printed but not linked: 98
- Barandiaran, D. and Wang, S.-Y.: The missing teleconnection between the North Atlantic and the Sahel precipitation in CFSv2, Atmos. Sci. Lett., 15, 21–28, 2014. · DOI
- Bellucci, A., Gualdi, S., and Navarra, A.: The double-ITCZ syndrome in coupled general circulation models: the role of large-scale vertical circulation regimes, J. Climate, 23, 1127–1145, 2010. · DOI
- Bolton, C. T. and Stoll, H. M.: Late Miocene threshold response of marine algae to carbon dioxide limitation, Nature, 500, 558–562, 2013. · DOI
- Bosmans, J. H. C., Drijfhout, S. S., Tuenter, E., Lourens, L. J., Hilgen, F. J., and Weber, S. L.: Monsoonal response to mid-holocene orbital forcing in a high resolution GCM, Clim. Past, 8, 723–740, https://doi.org/10.5194/cp-8-723-2012, 2012. · DOI
- Bosmans, J. H. C., Drijfhout, S. S., Tuenter, E., Hilgen, F. J., and Lourens, L. J.: Response of the North African summer monsoon to precession and obliquity forcings in the EC-Earth GCM, Clim. Dynam., 44, 279–297, 2015a. · DOI
- Bosmans, J. H. C., Hilgen, F. J., Tuenter, E., and Lourens, L. J.: Obliquity forcing of low-latitude climate, Clim. Past Discuss., 11, 221–241, https://doi.org/10.5194/cpd-11-221-2015, 2015b. · DOI
- Braconnot, P., Otto-Bliesner, B., Harrison, S., Joussaume, S., Peterchmitt, J.-Y., Abe-Ouchi, A., Crucifix, M., Driesschaert, E., Fichefet, Th., Hewitt, C. D., Kageyama, M., Kitoh, A., Laîné, A., Loutre, M.-F., Marti, O., Merkel, U., Ramstein, G., Valdes, P., Weber, S. L., Yu, Y., and Zhao, Y.: Results of PMIP2 coupled simulations of the Mid-Holocene and Last Glacial Maximum – Part 1: experiments and large-scale features, Clim. Past, 3, 261–277, https://doi.org/10.5194/cp-3-261-2007, 2007. · DOI
- Braconnot, P., Marzin, C., Grégoire, L., Mosquet, E., and Marti, O.: Monsoon response to changes in Earth's orbital parameters: comparisons between simulations of the Eemian and of the Holocene, Clim. Past, 4, 281–294, https://doi.org/10.5194/cp-4-281-2008, 2008. · DOI
- Bradshaw, C. D., Lunt, D. J., Flecker, R., Salzmann, U., Pound, M. J., Haywood, A. M., and Eronen, J. T.: The relative roles of CO2 and palaeogeography in determining late Miocene climate: results from a terrestrial model-data comparison, Clim. Past, 8, 1257–1285, https://doi.org/10.5194/cp-8-1257-2012, 2012a. · DOI
- Bradshaw, C. D., Lunt, D. J., Flecker, R., Salzmann, U., Pound, M. J., Haywood, A. M., and Eronen, J. T.: Corrigendum to "The relative roles of CO2 and palaeogeography in determining late Miocene climate: results from a terrestrial model-data comparison" published in Clim. Past, 8, 1257–1285, 2012, Clim. Past, 8, 1301–1307, https://doi.org/10.5194/cp-8-1301-2012, 2012b. · DOI
- Bradshaw, C. D., Lunt, D. J., Flecker, R., and Davies-Barnard, T.: Disentangling the roles of late Miocene palaeogeography and vegetation – Implications for climate sensitivity, Palaeogeogr. Palaeocl., 417, 17–34, 2015. · DOI
- Brostrom, A., Coe, M., Harrison, S. P., Gallimore, R., Kutzbach, J. E., Foley, J., Prentice, I. C., and Behling, P.: Land surface feedbacks and palaeomonsoons in northern Africa, Geophys. Res. Lett., 25, 3615–3618, 1998. · DOI
- Brovkin, V., Claussen, M., Petoukhov, V., and Ganopolski, A.: On the stability of the atmosphere-vegetation system in the Sahara/Sahel region, J. Geophys. Res.-Atmos., 103, 31613–31624, 1998. · DOI
- Bruch, A. A., Uhl, D., and Mosbrugger, V.: Miocene climate in Europe – Patterns and evolution: A first synthesis of NECLIME, Palaeogeogr. Palaeocl., 253, 1–7, 2007. · DOI
- Bruch, A. A., Utescher, T., and Mosbrugger, V.: Precipitation patterns in the Miocene of Central Europe and the development of continentality, Palaeogeogr. Palaeocl., 304, 202–211, 2011. · DOI
- Chen, G.-S., Kutzbach, J. E., Gallimore, R., and Liu, Z.: Calendar effect on phase study in paleoclimate transient simulation with orbital forcing, Clim. Dynam., 37, 1949–1960, 2011. · DOI
- Cherchi, A., Alessandri, A., Masina, S., and Navarra, A.: Effects of increased CO2 levels on monsoons, Clim. Dynam., 37, 83–101, 2011. · DOI
- Claussen, M., Kubatzki, C., Brovkin, V., Ganopolski, A., Hoelzmann, P., and Pachur, H.-J.: Simulation of an abrupt change in Saharan vegetation in the Mid-Holocene, Geophys. Res. Lett., 26, 2037–2040, 1999. · DOI
- Colin, C., Siani, G., Liu, Z., Blamart, D., Skonieczny, C., Zhao, Y., Bory, A., Frank, N., Duchamp-Alphonse, S., Thil, F., Richter, T., Kissel, C., and Gargani, J.: Late Miocene to early Pliocene climate variability off NW Africa (ODP Site 659), Palaeogeogr. Palaeocl., 401, 81–95, 2014. · DOI
- Cox, P. M., Betts, R. A., Jones, C. D., Spall, S. A., and Totterdell, I. J.: Acceleration of global warming due to carbon-cycle feedbacks in a coupled climate model, Nature, 408, 184–187, 10.1038/35041539, 2000. · DOI
- de Noblet-Ducoudre, N., Claussen, M., and Prentice, C.: Mid-Holocene greening of the Sahara: first results of the GAIM 6000 year BP Experiment with two asynchronously coupled atmosphere/biome models, Clim. Dynam., 16, 643–659, 2000. · DOI
- Doherty, R., Kutzbach, J., Foley, J., and Pollard, D.: Fully coupled climate/dynamical vegetation model simulations over Northern Africa during the mid-Holocene, Clim. Dynam., 16, 561–573, 2000. · DOI
- Dowsett, H. J. and Poore, R. Z.: Pliocene sea surface temperatures of the north atlantic ocean at 3.0 Ma, Quaternary Sci. Rev., 10, 189–204, 1991. · DOI
- Dowsett, H. J., Robinson, M. M., Haywood, A. M., Hill, D. J., Dolan, A. M., Stoll, D. K., Chan, W.-L., Abe-Ouchi, A., Chandler, M. A., Rosenbloom, N. A., Otto-Bliesner, B. L., Bragg, F. J., Lunt, D. J., Foley, K. M., and Riesselman, C. R.: Assessing confidence in Pliocene sea surface temperatures to evaluate predictive models, Nature Climate Change, 2, 365–371, https://doi.org/10.1038/nclimate1455, 2012. · DOI
- Dowsett, H. J., Robinson, M. M., Stoll, D. K., Foley, K. M., Johnson, A. L. A., Williams, M., and Riesselman, C. R.: The PRISM (Pliocene palaeoclimate) reconstruction: time for a paradigm shift, Philos. T. R. Soc. Lond., 371, 20120524, https://doi.org/10.1098/rsta.2012.0524, 2013. · DOI
- Duque-Caro, H.: Neogene stratigraphy, paleoceanography and paleobiogeography in northwest South America and the evolution of the Panama seaway, Palaeogeogr. Palaeocl., 77, 203–234, 1990. · DOI
- Eronen, J. T., Fortelius, M., Micheels, A., Portmann, F., Puolamaki, K., and Janis, C. M.: Neogene aridification of the Northern Hemisphere, Geology, 40, 823–826, 2012. · DOI
- Essery, R. and Clark, D. B.: Developments in the MOSES 2 land-surface model for PILPS 2e, Global Planet. Change, 38, 161–164, 2003. · DOI
- Feulner, G., Rahmstorf, S., Levermann, A., and Volkwardt, S.: On the Origin of the Surface Air Temperature Difference between the Hemispheres in Earth's Present-Day Climate, J. Climate, 26, 7136–7150, 2013. · DOI
- Forrest, M., Eronen, J. T., Utescher, T., Knorr, G., Stepanek, C., Lohmann, G., and Hickler, T.: Climate-vegetation modelling and fossil plant data suggest low atmospheric CO2 in the late Miocene, Clim. Past Discuss., 11, 2239–2279, https://doi.org/10.5194/cpd-11-2239-2015, 2015. · DOI
- Garzione, C. N., Dettman, D. L., Quade, J., DeCelles, P. G., and Butler, R. F.: High times on the Tibetan Plateau: Paleoelevation of the Thakkhola graben, Nepal, Geology, 28, 339–342, 2000. · DOI
- Gradstein, F. M., Ogg, J. G., Smith, A. G., Bleeker, W., and Lourens, L. J.: A new geologic time scale, with special reference to Precambrian and Neogene, Episodes, 27, 83–100, 2004. · DOI
- Griffin, D. L.: Aridity and humidity: two aspects of the late Miocene climate of North Africa and the Mediterranean, Palaeogeogr. Palaeocl., 182, 65–91, 2002. · DOI
- Griffin, D. L.: The late Neogene Sahabi rivers of the Sahara and their climatic and environmental implications for the Chad Basin, J. Geol. Soc., 163, 905–921, 2006. · DOI
- Harrison, S. P., Bartlein, P. J., Izumi, K., Li, G., Annan, J., Hargreaves, J., Braconnot, P., and Kageyama, M.: Evaluation of CMIP5 palaeo-simulations to improve climate projections, Nature Climate Change, 5, 735–743, 2015. · DOI
- Haywood, A. M., Dolan, A. M., Pickering, S. J., Dowsett, H. J., McClymont, E. L., Prescott, C. L., Salzmann, U., Hill, D. J., Hunter, S. J., Lunt, D. J., Pope, J. O., and Valdes, P. J.: On the identification of a Pliocene time slice for data-model comparison, Philos. T. R. Soc. Lond., 371, 20120515, https://doi.org/10.1098/rsta.2012.0515, 2013. · DOI
- Hely, C., Braconnot, P., Watrin, J., and Zheng, W.: Climate and vegetation: Simulating the African humid period, histoire climatique des deserts d'Afrique et d'Arabie Climatic history of the African and Arabian deserts, C. R. Geosci., 341, 671–688, 2009. · DOI
- Hilgen, F., Aziz, H. A., Bice, D., Iaccarino, S., Krijgsman, W., Kuiper, K., Montanari, A., Raffi, I., Turco, E., and Zachariasse, W.-J.: The global boundary stratotype section and point (GSSP) of the Tortonian stage (Upper Miocene) at Monte Dei Corvi, Episodes-Newsmagazine of the International Union of Geological Sciences, 28, 6–17, 2005. · DOI
- Hilgen, F. J., Krijgsman, W., Langereis, C. G., Lourens, L. J., Santarelli, A., and Zachariasse, W. J.: Extending the astronomical (polarity) time scale into the Miocene, Earth Planet. Sc. Lett., 136, 495–510, 1995. · DOI
- Hilgen, F. J., Abdul Aziz, H., Krijgsman, W., Langereis, C. G., Lourens, L. J., Meulenkamp, J. E., Raffi, I., Steenbrink, J., Turco, E., Van Vugt, N., Wijbrans, J. R., and Zachariasse, W. J.: Present status of the astronomical (polarity) time-scale for the Mediterranean Late Neogene, Philos. T. R. Soc. A, 357, 1931–1947, 1999. · DOI
- Hilgen, F. J., Bissoli, L., Iaccarino, S., Krijgsman, W., Meijer, R., Negri, A., and Villa, G.: Integrated stratigraphy and astrochronology of the Messinian GSSP at Oued Akrech (Atlantic Morocco), Earth Planet. Sc. Lett., 182, 237–251, 2000. · DOI
- Hsu, K. J., Ryan, W. B. F., and Cita, M. B.: Late Miocene Desiccation of the Mediterranean, Nature, 242, 240–244, https://doi.org/10.1038/242240a0, 1973. · DOI
- Ivanovic, R. F., Valdes, P. J., Flecker, R., Gregoire, L. J., and Gutjahr, M.: The parameterisation of Mediterranean-Atlantic water exchange in the Hadley Centre model HadCM3, and its effect on modelled North Atlantic climate, Ocean Model., 62, 11–16, 2013. · DOI
- Ivanovic, R. F., Valdes, P. J., Flecker, R., and Gutjahr, M.: Modelling global-scale climate impacts of the late Miocene Messinian Salinity Crisis, Clim. Past, 10, 607–622, https://doi.org/10.5194/cp-10-607-2014, 2014a. · DOI
- Joussaume, S. and Braconnot, P.: Sensitivity of paleoclimate simulation results to season definitions, J. Geophys. Res.-Atmos., 102, 1943–1956, 1997. · DOI
- Joussaume, S., Taylor, K. E., Braconnot, P., Mitchell, J. F. B., Kutzbach, J. E., Harrison, S. P., Prentice, I. C., Broccoli, A. J., Abe-Ouchi, A., Bartlein, P. J., Bonfils, C., Dong, B., Guiot, J., Herterich, K., Hewitt, C. D., Jolly, D., Kim, J. W., Kislov, A., Kitoh, A., Loutre, M. F., Masson, V., McAvaney, B., McFarlane, N., de Noblet, N., Peltier, W. R., Peterschmitt, J. Y., Pollard, D., Rind, D., Royer, J. F., Schlesinger, M. E., Syktus, J., Thompson, S., Valdes, P., Vettoretti, G., Webb, R. S., and Wyputta, U.: Monsoon changes for 6000 years ago: Results of 18 simulations from the Paleoclimate Modeling Intercomparison Project (PMIP), Geophys. Res. Lett., 26, 859–862, 1999. · DOI
- Kamikuri, S.-I., Nishi, H., and Motoyama, I.: Effects of late Neogene climatic cooling on North Pacific radiolarian assemblages and oceanographic conditions, Palaeogeogr. Palaeocl., 249, 370–392, 2007. · DOI
- Keigwin, L.: Isotopic Paleoceanography of the Caribbean and East Pacific: Role of Panama Uplift in Late Neogene Time, Science, 217, 350–353, 1982. · DOI
- Kidd, R. B., Cita, M. B., and Ryan, W. B.: Stratigraphy of eastern Mediterranean sapropel sequences recovered during DSDP Leg 42A and their paleoenvironmental significance, Initial Rep. Deep Sea, 42, 421–443, 1978. · DOI
- Knorr, G., Butzin, M., Micheels, A., and Lohmann, G.: A warm Miocene climate at low atmospheric CO2 levels, Geophys. Res. Lett., 38, L20701, https://doi.org/10.1029/2011GL048873, 2011. · DOI
- Koster, R. D. Guo, Z., Dirmeyer, P. A. Bonan, G., Chan, E., Cox, P., Davies, H., Gordon, C. T., Kanae, S., Kowalczyk, E., Lawrence, D., Liu, P., Lu, C.-H., Malyshev, S., McAvaney, B., Mitchell, K., Mocko, D., Oki, T., Oleson, K. W., Pitman, A., Sud, Y. C., Taylor, C. M., Verseghy, D., Vasic, R., Xue, Y., and Yamada, T.: GLACE: the global land-atmosphere coupling experiment. Part I: overview, J. Hydrometeorol., 7, 590–610, 2006. · DOI
- Krijgsman, W., Hilgen, F. J., Raffi, I., Sierro, F. J., and Wilson, D. S.: Chronology, causes and progression of the Messinian salinity crisis, Nature, 400, 652–655, https://doi.org/10.1038/23231, 1999. · DOI
- Krijgsman, W., Fortuin, A. R., Hilgen, F. J., and Sierro, F. J.: Astrochronology for the Messinian Sorbas basin (SE Spain) and orbital (precessional) forcing for evaporite cyclicity, Sediment. Geol., 140, 43–60, 2001. · DOI
- Kuhlemann, J.: Paleogeographic and paleotopographic evolution of the Swiss and Eastern Alps since the Oligocene, Global Planet. Change, 58, 224–236, 2007. · DOI
- Kutzbach, J. E.: Monsoon Climate of the Early Holocene: Climate Experiment with the Earth's Orbital Parameters for 9000 Years Ago, Science, 214, 59–61, 1981. · DOI
- Kutzbach, J. E. and Gallimore, R. G.: Sensitivity of a coupled atmosphere/mixed layer ocean model to changes in orbital forcing at 9000 years B.P, J. Geophys. Res.-Atmos., 93, 803–821, 1988. · DOI
- LaRiviere, J. P., Ravelo, A. C., Crimmins, A., Dekens, P. S., Ford, H. L., Lyle, M., and Wara, M. W.: Late Miocene decoupling of oceanic warmth and atmospheric carbon dioxide forcing, Nature, 486, 97–100, https://doi.org/10.1038/nature11200, 2012. · DOI
- Larrasoaña, J. C., Roberts, A. P., Rohling, E. J., Winklhofer, M., and Wehausen, R.: Three million years of monsoon variability over the northern Sahara, Clim. Dynam., 21, 689–698, 2003. · DOI
- Laskar, J., Robutel, P., Joutel, F., Gastineau, M., Correia, A. C. M., and Levrard, B.: A long-term numerical solution for the insolation quantities of the Earth, Astron. Astrophys., 428, 261–285, 2004. · DOI · Paper page
- Lewis, A. R., Marchant, D. R., Ashworth, A. C., Hedenas, L., Hemming, S. R., Johnson, J. V., Leng, M. J., Machlus, M. L., Newton, A. E., Raine, J. I., Willenbring, J. K., Williams, M., and Wolfe, A. P.: Mid-Miocene cooling and the extinction of tundra in continental Antarctica, P. Natl. Acad. Sci. USA, 105, 10676–10680, 2008. · DOI
- Liu, Z., Wang, Y., Gallimore, R., Gasse, F., Johnson, T., deMenocal, P., Adkins, J., Notaro, M., Prentice, I., Kutzbach, J., Jacob, R., Behling, P., Wang, L., and Ong, E.: Simulating the transient evolution and abrupt change of Northern Africa atmosphere-ocean-terrestrial ecosystem in the Holocene, Quaternary Sci. Rev., 26, 1818–1837, 2007. · DOI
- Loptson, C. A., Lunt, D. J., and Francis, J. E.: Investigating vegetation-climate feedbacks during the early Eocene, Clim. Past, 10, 419–436, https://doi.org/10.5194/cp-10-419-2014, 2014. · DOI
- Lourens, L. J., Antonarakou, A., Hilgen, F. J., Van Hoof, A. A. M., Vergnaud-Grazzini, C., and Zachariasse, W. J.: Evaluation of the Plio-Pleistocene astronomical timescale, Paleoceanography, 11, 391–413, 1996. · DOI
- Lourens, L. J., Wehausen, R., and Brumsack, H. J.: Geological constraints on tidal dissipation and dynamical ellipticity of the Earth over the past three million years, Nature, 409, 1029–1033, https://doi.org/10.1038/35059062, 2001. · DOI
- Lunt, D., Valdes, P., Haywood, A., and Rutt, I.: Closure of the Panama Seaway during the Pliocene: implications for climate and Northern Hemisphere glaciation, Clim. Dynam., 30, 1–18, 2008a. · DOI
- Lunt, D. J., Flecker, R., Valdes, P. J., Salzmann, U., Gladstone, R., and Haywood, A. M.: A methodology for targeting palaeo proxy data acquisition: A case study for the terrestrial late Miocene, Earth Planet. Sc. Lett., 271, 53–62, 2008b. · DOI
- Lunt, D. J., Valdes, P. J., Jones, T. D., Ridgwell, A., Haywood, A. M., Schmidt, D. N., Marsh, R., and Maslin, M.: CO2-driven ocean circulation changes as an amplifier of Paleocene-Eocene thermal maximum hydrate destabilization, Geology, 38, 875–878, 2010. · DOI
- Lunt, D. J., Abe-Ouchi, A., Bakker, P., Berger, A., Braconnot, P., Charbit, S., Fischer, N., Herold, N., Jungclaus, J. H., Khon, V. C., Krebs-Kanzow, U., Langebroek, P. M., Lohmann, G., Nisancioglu, K. H., Otto-Bliesner, B. L., Park, W., Pfeiffer, M., Phipps, S. J., Prange, M., Rachmayani, R., Renssen, H., Rosenbloom, N., Schneider, B., Stone, E. J., Takahashi, K., Wei, W., Yin, Q., and Zhang, Z. S.: A multi-model assessment of last interglacial temperatures, Clim. Past, 9, 699–717, https://doi.org/10.5194/cp-9-699-2013, 2013. · DOI
- Markwick, P.: The Palaeogeographic and Palaeoclimatic Significance of Climate Proxies for Data-Model Comparisons, in: Deep-Time Perspectives on Climate Change: Marrying the Signal from Computer Models and Biological Proxies, Williams, M., Haywood, A. M., Gregory, F. J., and Schmidt, D. N., The Micropalaeontological Society Special Publications, The Geological Society, London, 251–312, 2007. · DOI
- Markwick, P. J. and Valdes, P. J.: Palaeo-digital elevation models for use as boundary conditions in coupled ocean-atmosphere GCM experiments: a Maastrichtian (late Cretaceous) example, Palaeogeogr. Palaeocl., 213, 37–63, 2004. · DOI
- Micheels, A., Bruch, A. A., Uhl, D., Utescher, T., and Mosbrugger, V.: A Late Miocene climate model simulation with ECHAM4/ML and its quantitative validation with terrestrial proxy data, Palaeogeogr. Palaeocl., 253, 251–270, 2007. · DOI
- Molnar, P., England, P., and Martinod, J.: Mantle dynamics, uplift of the Tibetan Plateau, and the Indian Monsoon, Rev. Geophys., 31, 357–396, 1993. · DOI
- Moran, K., Backman, J., Brinkhuis, H., Clemens, S. C., Cronin, T., Dickens, G. R., Eynaud, F., Gattacceca, J., Jakobsson, M., Jordan, R. W., Kaminski, M., King, J., Koc, N., Krylov, A., Martinez, N., Matthiessen, J., McInroy, D., Moore, T. C., Onodera, J., O'Regan, M., Pälike, H., Rea, B., Rio, D., Sakamoto, T., Smith, D. C., Stein, R., St John, K., Suto, I., Suzuki, N., Takahashi, K., Watanabe, M., Yamamoto, M., Farrell, J., Frank, M., Kubik, P., Jokat, W., and Kristoffersen, Y.: The Cenozoic palaeoenvironment of the Arctic Ocean, Nature, 441, 601–605, https://doi.org/10.1038/nature04800, 2006. · DOI
- Morgan, P. and Swanberg, C. A.: On the Cenozoic uplift and tectonic stability of the Colorado Plateau, J. Geodyn., 3, 39–63, 1985. · DOI
- Otto-Bliesner, B. L., Rosenbloom, N., Stone, E. J., McKay, N. P., Lunt, D. J., Brady, E. C., and Overpeck, J. T.: How warm was the last interglacial? New model-data comparisons, Philos. T. Roy. Soc. A, 371, 20130097, https://doi.org/10.1098/rsta.2013.0097, 2013. · DOI
- Oueslati, B. and Bellon, G.: The double ITCZ bias in CMIP5 models: interaction between SST, large-scale circulation and precipitation, Climate Dynam., 44, 585–607, 2015. · DOI
- Perez-Folgado, M., Sierro, F. J., Bárcena, M. A., Flores, J. A., Vázquez, A., Utrilla, R., Hilgen, F. J., Krijgsman, W., and Filippelli, G. M.: Western versus eastern Mediterranean paleoceanographic response to astronomical forcing: a high-resolution microplankton study of precession-controlled sedimentary cycles during the Messinian, Palaeogeogr. Palaeocl., 190, 317–334, 2003. · DOI
- Pound, M. J., Haywood, A. M., Salzmann, U., Riding, J. B., Lunt, D. J., and Hunter, S. J.: A Tortonian (Late Miocene, 11.61–7.25;Ma) global vegetation reconstruction, Palaeogeogr. Palaeocl., 300, 29–45, 2011. · DOI
- Pound, M. J., Haywood, A. M., Salzmann, U., and Riding, J. B.: Global vegetation dynamics and latitudinal temperature gradients during the Mid to Late Miocene (15.97–5.33 Ma), Earth-Sci. Rev., 112, 1–22, 2012. · DOI
- Prell, W. L. and Kutzbach, J. E.: Monsoon variability over the past 150,000 years, J. Geophys. Res.-Atmos., 92, 8411–8425, 1987. · DOI
- Prescott, C. L., Haywood, A. M., Dolan, A. M., Hunter, S. J., Pope, J. O., and Pickering, S. J.: Assessing orbitally-forced interglacial climate variability during the mid-Pliocene Warm Period, Earth Planet. Sc. Lett., 400, 261–271, 2014. · DOI
- Renssen, H., Brovkin, V., Fichefet, T., and Goosse, H.: Simulation of the Holocene climate evolution in Northern Africa: The termination of the African Humid Period, impact of rapid environmental changes on humans and ecosystems Impact of rapid environmental changes on humans and ecosystems, Quatern. Int., 150, 95–102, 2006. · DOI
- Rossignol-Strick, M. and Planchais, N.: Climate patterns revealed by pollen and oxygen isotope records of a Tyrrhenian sea core, Nature, 342, 413–416, https://doi.org/10.1038/342413a0, 1989. · DOI
- Salzmann, U., Dolan, A. M.,, Haywood, Chan, W.-L., Voss, J., Hill, D. J., Abe-Ouchi, A., Otto-Bliesner, B., Bragg, F. J., Chandler, M. A., Contoux, C., Dowsett, H. J., Jost, A., Kamae, Y., Lohmann, G., Lunt, D. J., Pickering, S. J., Pound, M. J., Ramstein, G., Rosenbloom, N., Sohl, L., Stepanek, S., Ueda, H., and Zhang, Z.: Challenges in quantifying Pliocene terrestrial warming revealed by data-model discord, Nature Climate Change, 3, 969–974, 2013. · DOI
- Schuster, M., Duringer, P., Ghienne, J.-F., Vignaud, P., Mackaye, H. T., Likius, A., and Brunet, M.: The Age of the Sahara Desert, Science, 311, 821–821, 2006. · DOI
- Shackleton, N. J. and Kennett, J. P.: Paleotemperature history of the Cenozoic and the initiation of Antarctic glaciation: oxygen and carbon isotope analyses in DSDP Sites 277, 279, and 281, Initial Rep. Deep Sea, 29, 743–755, 1975. · DOI
- Sierro, F. J., Hilgen, F. J., Krijgsman, W., and Flores, J. A.: The Abad composite (SE Spain): a Messinian reference section for the Mediterranean and the APTS, Palaeogeogr. Palaeocl., 168, 141–169, 2001. · DOI
- Steppuhn, A., Micheels, A., Geiger, G., and Mosbrugger, V.: Reconstructing the Late Miocene climate and oceanic heat flux using the (AGCM) ECHAM4 coupled to a mixed-layer ocean model with adjusted flux correction, late Miocene to Early Pliocene Environment and Climate Change in the Mediterranean Area, Palaeogeogr. Palaeocl., 238, 399–423, 2006. · DOI
- Thorncroft, C. and Lamb, P.: The West African Monsoon, in: The Global Monsoon System: 25 Research and Forecast, edited by: Chang, C.-P., Wang, B., and Lau, N.-C. G., 239–250, WMO/TD No. 1266 (TMRP Report No. 70) Report of the International Committee of the Third International Workshop on Monsoons (IWM-III), 2–6 November 2004, Hangzhou, China, 2005.
- Tindall, J., Flecker, R., Valdes, P., Schmidt, D. N., Markwick, P., and Harris, J.: Modelling the oxygen isotope distribution of ancient seawater using a coupled ocean-atmosphere GCM: Implications for reconstructing early Eocene climate, Earth Planet. Sc. Lett., 292, 265–273, 2010. · DOI
- Tuenter, E., Weber, S. L., Hilgen, F. J., and Lourens, L. J.: The response of the African summer monsoon to remote and local forcing due to precession and obliquity, Global Planet. Change, 36, 219–235, 2003. · DOI
- Tuenter, E., Weber, S. L., Hilgen, F. J., Lourens, L. J., and Ganopolski, A.: Simulation of climate phase lags in response to precession and obliquity forcing and the role of vegetation, Clim. Dynam., 24, 279–295, 2005. · DOI
- Utescher, T., Böhme, M., and Mosbrugger, V.: The Neogene of Eurasia: Spatial gradients and temporal trends – The second synthesis of NECLIME, Palaeogeogr. Palaeocl., 304, 196–201, 2011. · DOI
- Yemane, K., Bonnefille, R., and Faure, H.: Palaeoclimatic and tectonic implications of Neogene microflora from the Northwestern Ethiopian highlands, Nature, 318, 653–656, https://doi.org/10.1038/318653a0, 1985. · DOI
- Yin, Q. and Berger, A.: Individual contribution of insolation and CO2 to the interglacial climates of the past 800,000 years, Clim. Dynam., 38, 709–724, 2012. · DOI
- Zhang, R. and Delworth, T. L.: Impact of Atlantic multidecadal oscillations on India/Sahel rainfall and Atlantic hurricanes, Geophys. Res. Lett., 33, L17712, https://doi.org/10.1029/2006GL026267, 2006. · DOI · Paper page
- Zhang, Y. G., Pagani, M., Liu, Z., Bohaty, S. M., and DeConto, R.: A 40-million-year history of atmospheric CO2, Philos. T. Roy. Soc. A, 371, 20130096, https://doi.org/10.1098/rsta.2013.0096, 2013. · DOI
- Zhang, Z., Ramstein, G., Schuster, M., Li, C., Contoux, C., and Yan, Q.: Aridification of the Sahara desert caused by Tethys Sea shrinkage during the Late Miocene, Nature, 513, 401–404, 2014. · DOI
Cited by
Asteroid impact, not volcanism, caused the end-Cretaceous dinosaur extinction
Chiarenza, A. A., Farnsworth, A., Mannion, P. D., Lunt, D. J., Valdes, P. J., Morgan, J. V., & Allison, P. A. (2020) · Proceedings of the National Academy of Sciences · doi:10.1073/pnas.2006087117 · Cited by 228
Self-citation
Metadata
- Authors
- Marzocchi, A., Lunt, D. J., Flecker, R., Bradshaw, C. D., Farnsworth, A., & Hilgen, F. J.
- Venue
- Climate of the Past
- Publisher
- Copernicus GmbH
- Published
- 2015-10-01
- Volume
- 11
- Issue
- 10
- Pages
- 1271-1295
- ISSN
- 1814-9332
- Cited by
- 55
- References
- 0
- Language
- en
About these checks
Registry, retraction, Cites and statistics results are computed, not judged, with one exception: a printed reference that no index lists is read once by a model before it counts as a citation error. Claims are extracted by a model and kept only when their quote appears verbatim in the text; each cited source is then checked, with a model’s help, for whether it says what the claim relies on. Those verdicts can be wrong — read the claim’s quote and the cited source before relying on one.
Statistics and arithmetic are recomputed, not judged.
Confidence bands are shown only for fields calibrated on our annotated test set. None is calibrated yet, so no band is shown.
What counts as a claim ›How we measure confidence ›How we check this ›
Are you an author, or do you see a problem with this page? Request a review
