

Benchmarking homogenization algorithms for monthly data
Open accessPublished version of a preprint
The DOI matches its Crossref record; 50 of the 50 references it cites were found in a registry or an index.
Abstract
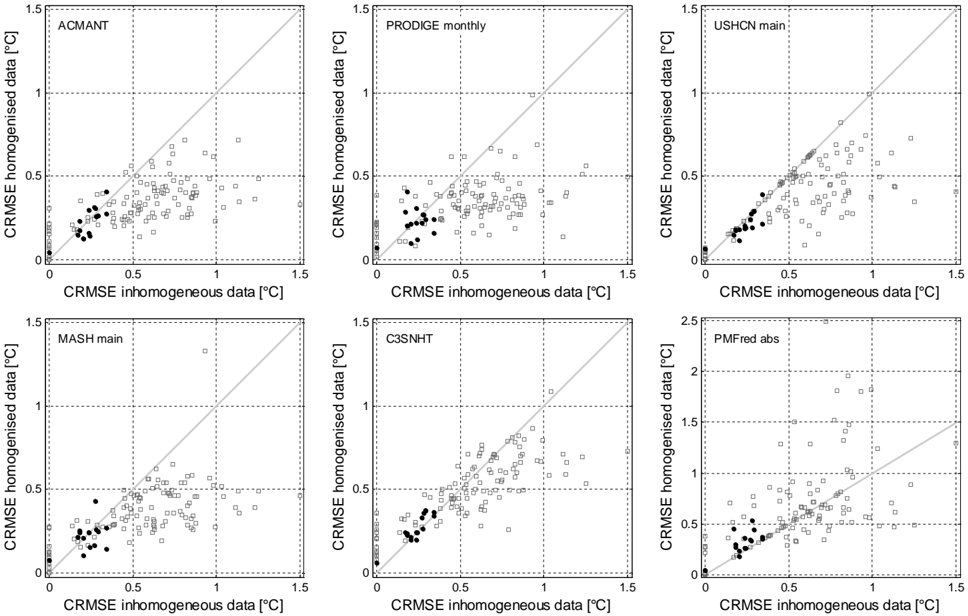
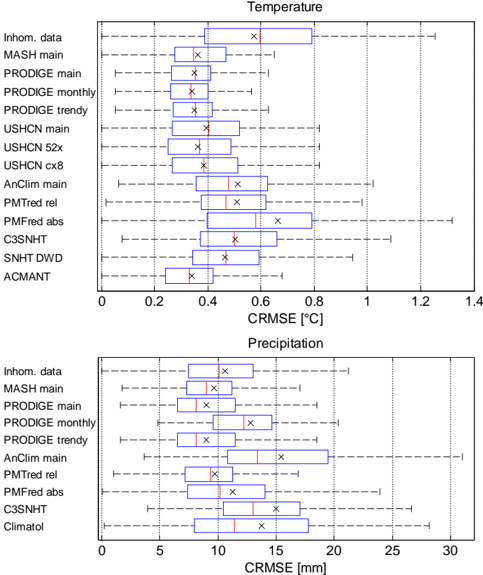
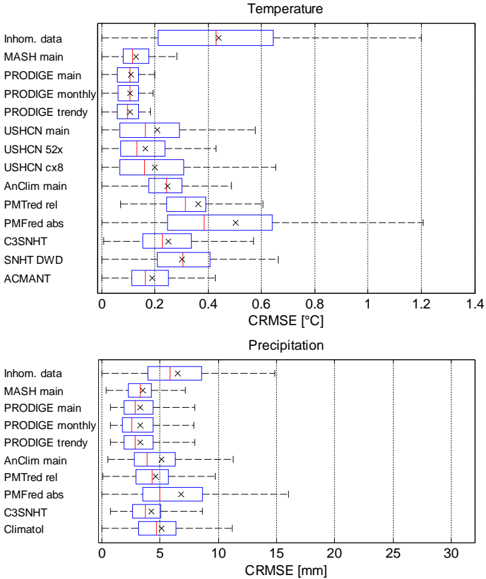
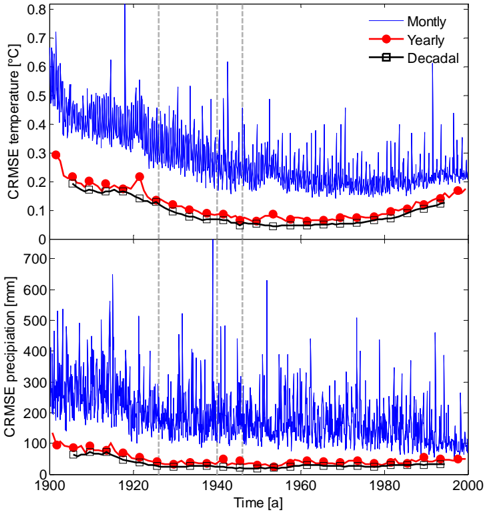
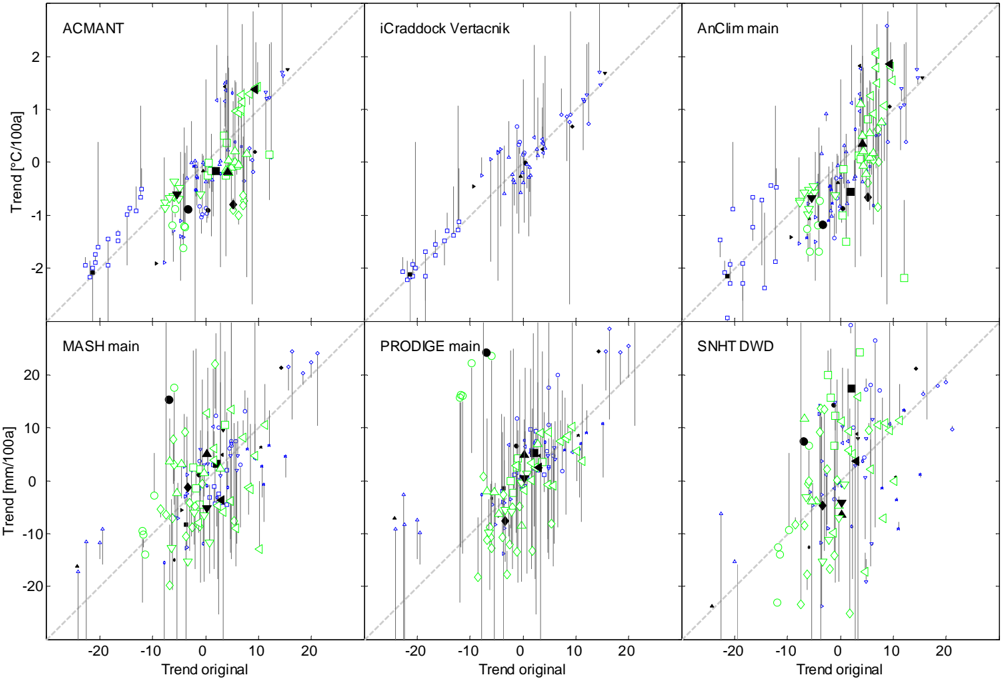
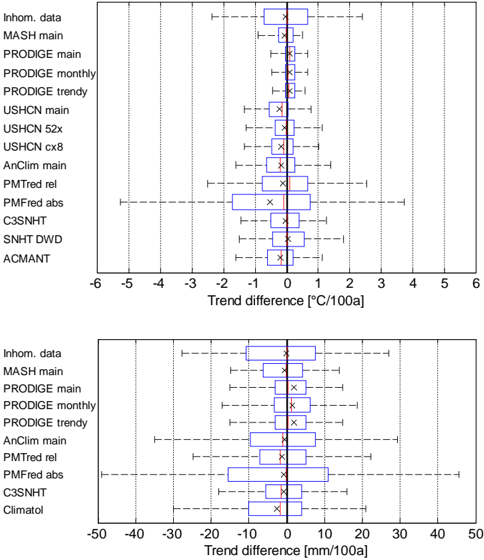
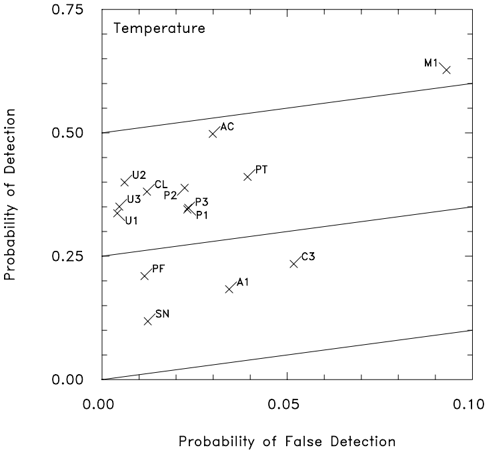
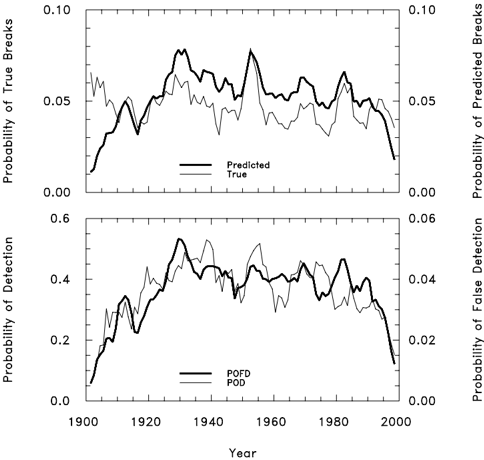
The COST (European Cooperation in Science and Technology) Action ES0601: advances in homogenization methods of climate series: an integrated approach (HOME) has executed a blind intercomparison and validation study for monthly homogenization algorithms. Time series of monthly temperature and precipitation were evaluated because of their importance for climate studies and because they represent two important types of statistics (additive and multiplicative). The algorithms were validated against a realistic benchmark dataset. The benchmark contains real inhomogeneous data as well as simulated data with inserted inhomogeneities. Random independent break-type inhomogeneities with normally distributed breakpoint sizes were added to the simulated datasets. To approximate real world conditions, breaks were introduced that occur simultaneously in multiple station series within a simulated network of station data. The simulated time series also contained outliers, missing data periods and local station trends. Further, a stochastic nonlinear global (network-wide) trend was added. Participants provided 25 separate homogenized contributions as part of the blind study. After the deadline at which details of the imposed inhomogeneities were revealed, 22 additional solutions were submitted. These homogenized datasets were assessed by a number of performance metrics including (i) the centered root mean square error relative to the true homogeneous value at various averaging scales, (ii) the error in linear trend estimates and (iii) traditional contingency skill scores. The metrics were computed both using the individual station series as well as the network average regional series. The performance of the contributions depends significantly on the error metric considered. Contingency scores by themselves are not very informative. Although relative homogenization algorithms typically improve the homogeneity of temperature data, only the best ones improve precipitation data. Training the users on homogenization software was found to be very important. Moreover, state-of-the-art relative homogenization algorithms developed to work with an inhomogeneous reference are shown to perform best. The study showed that automatic algorithms can perform as well as manual ones.
Overview
The claims and statistics of this paper haven’t been checked yet.
Free: it reads the open-access text and checks the first 5 claims that cite a source we can check. Create a free account to check every claim.
Integrity signals
Registry
Cites
Statistics
Figures
Verification
Claims the paper makes
The claims and statistics of this paper haven’t been checked yet.
Free: it reads the open-access text and checks the first 5 claims that cite a source we can check. Create a free account to check every claim.
Claims other papers make about this one
Each is checked against this paper’s own text: does it say what the citing paper says it does?
The source backs part of the claim, not all of it — or backs it for a different population, condition or comparison.
In the citing paper
“For instance, [5, 6] demonstrated that inconsistencies in data collection practices contribute to significant biases in climate datasets, affecting the accuracy of climate modelling and predictive analyses. These biases can propagate through climate models, reducing the reliability of future projections, especially in data-scarce regions.”
From Exploratory data analysis of Burkina Faso’s Raw daily meteorological records (1981–2021): data quality insights and potential outlier screening (2026) · cites this paper as [5]
Experimental — accuracy not yet measuredThe source backs part of the claim, not all of it — or backs it for a different population, condition or comparison.
In the citing paper
“The PHA has undergone extensive evaluation and benchmarking (e.g., Menne and Williams 2009; Venema et al. 2012; Williams et al. 2012) and has been shown to be effective at finding a wide variety of shifts in realistic simulated monthly temperature datasets.”
From The Global Historical Climatology Network Monthly Temperature Dataset, Version 4 (2018) · cites this paper as Venema et al. 2012
Experimental — accuracy not yet measuredThe cited source says what the claim attributes to it.
In the citing paper
“Long-term station records are often subjected to inhomogeneities due to factors like station relocation, observation time change, instrument change, and surrounding environment change (Venema et al., 2012).”
From SCDNA: a serially complete precipitation and temperature dataset for North America from 1979 to 2018 (2020) · cites this paper as Venema et al., 2012
The cited source says what the claim attributes to it.
In the citing paper
“Different methods could generate different estimates of inhomogeneities as shown by many comparison studies (e.g., Beaulieu et al., 2008; Reeves et al., 2007; Venema et al., 2012).”
From SCDNA: a serially complete precipitation and temperature dataset for North America from 1979 to 2018 (2020) · cites this paper as Venema et al., 2012
Self-check
Percentages, sums and reported differences re-computed from the paper’s own numbers.
The self-check needs the paper’s full text.
Citations
Cites
Locally Weighted Regression: An Approach to Regression Analysis by Local Fitting
Cleveland, W. S., & Devlin, S. J. (1988) · Journal of the American Statistical Association · doi:10.1080/01621459.1988.10478639 · Cited by 5,742
Solomon, S. (2007) · Medical Entomology and Zoology · Cited by 4,149
IPCC (2007): Climate Change The Physical Science Basis
Solomon, S. (2007) · AGU Fall Meeting Abstracts · Cited by 3,476
Observations: Surface and Atmospheric Climate Change
Trenberth, K. E., Jones, P. D., Ambenje, P., Bojariu, R., Easterling, D. R., Tank, A. K., Parker, D., Rahimzadeh, F., Renwick, J. A., Rusticucci, M., et al. (2007) · elib (German Aerospace Center) · Cited by 2,370
A homogeneity test applied to precipitation data.
Alexandersson, H. (1986) · Journal of Climatology · doi:10.1002/joc.3370060607 · Cited by 1,858
Improved Surrogate Data for Nonlinearity Tests
Schreiber, T., & Schmitz, A. (1996) · Physical Review Letters · doi:10.1103/physrevlett.77.635 · Cited by 1,506
Some methods for testing the homogeneity of rainfall records
Buishand, T. A. (1982) · Journal of Hydrology · doi:10.1016/0022-1694(82)90066-x · Cited by 1,234
HISTALP—historical instrumental climatological surface time series of the Greater Alpine Region
Auer, I., Böhm, R., Jurkovic, A., Lipa, W., Orlik, A., Potzmann, R., Schöner, W., Ungersböck, M., Matulla, C., Briffa, K., et al. (2007) · International Journal of Climatology · doi:10.1002/joc.1377 · Cited by 1,133
Self-citationHomogeneity adjustments ofin situ atmospheric climate data: a review
Peterson, T. C., Easterling, D. R., Karl, T. R., Groisman, P., Nicholls, N., Plummer, N., Torok, S., Auer, I., Boehm, R., Gullett, D., et al. (1998) · International Journal of Climatology · doi:10.1002/(sici)1097-0088(19981115)18:13<1493::aid-joc329>3.0.co;2-t · Cited by 789
Self-citationHOMOGENIZATION OF SWEDISH TEMPERATURE DATA. PART I: HOMOGENEITY TEST FOR LINEAR TRENDS
ALEXANDERSSON, H., & MOBERG, A. (1997) · International Journal of Climatology · doi:10.1002/(sici)1097-0088(199701)17:1<25::aid-joc103>3.0.co;2-j · Cited by 669
Research works printed but not linked: 8
- Domonkos, P.: Testing of homogenisation methods: purposes, tools and problems of implementation. Proceedings of the 5 th Semi- nar and Quality Control in Climatological Databases, edited by:
- HMS: Hungarian Meteorological Service. Proceedings of the First Seminar for homogenization of Surface Climatological Data, Bu- dapest, Hungary, 6-12 October 1996, p. 44, 1996.
- Mestre, O.: Step-by-step procedures for choosing a model with change-points. In Proceedings of the second seminar for ho- mogenisation of surface climatological data, Budapest, Hungary, WCDMP-No.41, WMO-TD No. 962, 15-26, 1999.
- Szentimrey, T.: Multiple Analysis of Series for homogenization (MASH). Proceedings of the second seminar for homogenization of surface climatological data, Budapest, Hungary, WMO, WCDMP-No. 41, 27-46, 1999.
- Szentimrey, T.: Development of MASH homogenization pro- cedure for daily data. Proceedings of the fifth seminar for homogenization and quality control in climatological databases, Budapest, Hungary, 2006, WCDMP-No. 71, 123-130, 2008.
- WMO: Proceedings of the Second Seminar for homogenization of Surface Climatological Data. Budapest, Hungary, 9-13 Novem- ber 1998, p. 214, 1999.
- WMO: Proceedings of the Fifth Seminar for homogenization and Quality Control in Climatological Databases. Budapest, Hungary, 29 May–2 June 2006. Climate Data and Monitoring WCDMP- No 71, WMO/TD- No. 1493, 2006.
- WMO: Fourth Seminar for homogenization and Quality Control in Climatological Databases. Budapest, Hungary, 6-10 October 2003, WCDMP-No 56, WMO-TD No. 1236, p. 243, 2004. WMO: Proceedings of the Fifth Seminar for homogenization and Quality Control in Climatological Databases. Budapest, Hun- gary, 29 May-2 June 2006. Climate Data and Monitoring WCDMP-No 71, WMO/TD-No. 1493, 2006. WMO: Proceedings of the Sixth Seminar for homogenization and Quality Control in Climatological Databases. Budapest, Hun- gary, 26-30 2008, edited by: Lakatos, M., Szentimrey, T., Bihari, Z., and Szalai, S., WCDMP-No. 76, WMO/TD-NO. 1576, 2011.
Cited by
Items 301–400 of 407
Domonkos, P. (2012) · Cited by 3
Self-citationThe Challenge of Providing Information About Regional Climate Change
Maraun, D. (2023) · Lernweltforschung · doi:10.1007/978-3-658-38319-0_2 · Cited by 3
Deep learning for stochastic precipitation generation – deep SPG v1.0
Bird, L. J., Walker, M., Bodeker, G. E., Campbell, I., Liu, G., Sam, S. J., Lewis, J., & Rosier, S. M. (2023) · Geoscientific model development · doi:10.5194/gmd-16-3785-2023 · Cited by 3
Palamarchuk, L., Осадчий, В. І., Skrynyk, V. I., Kyreieva, Z. M., Sidenko, V., Oshurok, V. P., & Skrynyk, O. (2023) · Hydrology hydrochemistry and hydroecology · doi:10.17721/2306-5680.2023.1.7 · Cited by 3
Huang, Q., Wang, X., Li, H., Zhang, J., Han, Z., Liu, D., Li, Y.-P., & Zhang, H. (2024) · Remote Sensing · doi:10.3390/rs16203885 · Cited by 4
Progress and Uncertainty in Studies of Contemporary Land Climate Warming Rate: From Globe to Region
Ren, G., Sun, X., Zhang, P., Kangmin, W. E. N., Suonam Kealdrup, T. Y. S. A., Yulian, L. I. U., Zhang, S., Jiajun, H. E., Qin, Y., Om, K., et al. (2025) · Journal of Geography (Chigaku Zasshi) · doi:10.5026/jgeography.134.379 · Cited by 3
Trends in UAH Zonal Mean Lower Troposphere TemperaturesPreprint
Munshi, J. (2017) · SSRN Electronic Journal · doi:10.2139/ssrn.2985439 · Cited by 3
Enhancing daily precipitation reconstruction: An improved version of the reddPrec R package
Huerta, A., Brönnimann, S., de Luis, M., Beguería, S., & Serrano‐Notivoli, R. (2025) · Environmental Modelling & Software · doi:10.1016/j.envsoft.2025.106717 · Cited by 3
Tipping point analysis helps identify sensor phenomena in humidity data
Livina, V., Willett, K. M., & Bell, S. (2025) · Geoscientific instrumentation, methods and data systems · doi:10.5194/gi-14-541-2025 · Cited by 2
Phenological Shifts in Wood Formation Tracked by Frost Rings Across Two Centuries
Mantovani, E., Prendin, A. L., Brunetti, M., Frigo, D., Dibona, R., & Carrer, M. (2026) · Global Change Biology · doi:10.1111/gcb.70745 · Cited by 2
Self-citationDomonkos, P., Prohom, M., & Llabrés‐Brustenga, A. (2020) · International Journal of Climatology · doi:10.1002/joc.6822 · Cited by 2
Self-citationde Valk, C., & Brandsma, T. (2023) · International Journal of Climatology · doi:10.1002/joc.8258 · Cited by 2
Self-citationZhou, L., Peng, S., Liao, R., Mihara, K., Kuramochi, K., Toma, Y., & Hatano, R. (2024) · International Journal of Climatology · doi:10.1002/joc.8680 · Cited by 2
Homogenization of the Probability Distribution of Climatic Time Series: A Novel Algorithm
Domonkos, P. (2025) · Atmosphere · doi:10.3390/atmos16050616 · Cited by 2
Self-citationTrewin, B. C., & Jones, D. A. (2014) · Theoretical and Applied Climatology · doi:10.1007/s00704-014-1158-3 · Cited by 2
Computer assisted screening, correction, and analysis of historical weather measurements
Burnette, D. J., & Stahle, D. W. (2013) · Computers & Geosciences · doi:10.1016/j.cageo.2013.01.003 · Cited by 2
Warm streaks in the U.S. temperature record: What are the chances?
Craigmile, P. F., Guttorp, P. M., Lund, R., Smith, R. L., Thorne, P., & Arndt, D. S. (2014) · Journal of Geophysical Research Atmospheres · doi:10.1002/2013jd021446 · Cited by 2
Thorne, P. (2015) · Elsevier eBooks · doi:10.1016/b978-0-444-63524-2.00002-6 · Cited by 3
Spatial Analysis of the Air Temperature in Greece for the Normal Period 1971–2000
Anadranistakis, M., Μαμάρα, Ά., & Argiriou, A. A. (2016) · Springer atmospheric sciences · doi:10.1007/978-3-319-35095-0_73 · Cited by 2
Awe, S. O., Mahony, M., Michaud, E., Murphy, C., Noone, S. J., Venema, V. K. C., Thorne, T. G., & Thorne, P. (2022) · Climate of the past · doi:10.5194/cp-18-793-2022 · Cited by 2
Self-citationAnálisis de eventos extremos de precipitación en la provincia de Alicante (1981–2020)
Almodóvar, E. S. (2022) · Boletín de la Asociación de Geógrafos Españoles · doi:10.21138/bage.3325 · Cited by 2
Domingo‐Marimon, C. (2016) · LA Referencia (Red Federada de Repositorios Institucionales de Publicaciones Científicas) · Cited by 3
Malderen, R. V., Pottiaux, E., Kłos, A., Bock, O., Bogusz, J., Chimani, B., Eliaš, M., Gruszczynska, M., Guijarro, J. A., Kazancı, S. Z., et al. (2017) · Arcimis (State Meteorological Agency) · Cited by 2
Self-citationWoldesenbet, T. A. (2017) · Qucosa (Saxon State and University Library Dresden) · Cited by 3
Zamantakonè Ki, G., Bawindsom Kébré, M., Somda, W., Gandema, S., & Dabilgou, F. (2026) · Environmental Research Communications · doi:10.1088/2515-7620/ae68f0 · Cited by 1
McGregor, G. (2024) · Biometeorology · doi:10.1007/978-3-031-69906-1_3 · Cited by 1
Homogenization of Daily Rainfall, Minimum and Maximum Temperature in the Philippines
Bangquiao, N., & Basconcillo, J. Q. (2025) · SOLA · doi:10.2151/sola.2025-027 · Cited by 1
Shenkut, A., Alemayehu, G., Tesfaye, K., Getnet, M., Alemayehu, Y., & Mamo, G. (2025) · Advances in Meteorology · doi:10.1155/adme/2330257 · Cited by 1
Raharjo, T. H., Oktarina, N., & Permana, D. F. (2026) · Asian Journal of Interdisciplinary Research · doi:10.54392/ajir26216 · Cited by 1
Erenso, K. T., Mohammed, A. K., & Lohani, T. K. (2026) · Environmental Challenges · doi:10.1016/j.envc.2026.101649 · Cited by 1
WORKFLOW FOR THE HOMOGENISATION OF CLIMATE DATA USING GEOSTATISTICAL SIMULATION
Caineta, J. (2011) · International Multidisciplinary Scientific GeoConference SGEM ... · doi:10.5593/sgem2015/b21/s8.118 · Cited by 1
18. Weather Observation Network and Climate Change Monitoring in Catalonia, Spain
Prohom, M., & Cepero, O. P. (2016) · doi:10.1515/9783110480795-019 · Cited by 1
Orlić, M., Leder, T. D., Vujnović, V., Herak, D., Denić‐Jukić, V., Horvath, K., Grbec, B., Paklar, G. B., & Herak, M. (2015) · Geofizika · doi:10.15233/gfz.2015.32.7 · Cited by 1
El clima de los Pirineos : base de datos y primeros resultados
Prats, J. M. C., Serrano, R., Saz, M. Á., Tejedor, E., Prohom, M., Cunillera, J., Subeyroux, J. M., Deaux, N., & Esteban, P. (2014) · Arcimis (State Meteorological Agency) · Cited by 1
Self-citationSpring and autumn frosts in the Pannonian Basin in Serbia
Milićević, S. M., & Radovanovic, M. M. (2018) · Geografie · doi:10.37040/geografie2018123010021 · Cited by 1
Discussion on “A combined estimate of global temperature”
Thorne, P. (2022) · Environmetrics · doi:10.1002/env.2722 · Cited by 1
HOMOGENIZATION OF PRECIPITATION TIME SERIES: MAIN MODERN APPROACHES AND SOFTWARE TOOLS
Kyreieva, Z. M., Skrynyk, O., & Palamarchuk, L. (2023) · Метеорологія. Гідрологія. Моніторинг довкілля. · doi:10.15407/meteorology2023.03.014 · Cited by 1
The assessment of the risks of gully erosion activisation in urbanized areas
Осинцева, Н. В., & Квасникова, З. Н. (2015) · Digital library (repository) of Tomsk State University · Cited by 1
Wang, Y. (2018) · UVic’s Research and Learning Repository (University of Victoria) · Cited by 1
A regionális szélklíma tendenciáinak elemzése a globális klímaváltozás függvényében
Németh, C. P. (2016) · Eötvös Loránd Tudományegyetem · doi:10.15476/elte.2015.079 · Cited by 1
Perrimond, B. (2015) · theses.fr (ABES) · doi:10.70675/c7b42d9ezd823z44c7z8b07z08cd3a0585b2
Brandsma, T., Jilderda, R., & Sluijter, R. (2013)
Self-citationHomogeneity analysis of daily time series of ECA&D
Štěpánek, P., Pereira, M., de Freitas, L. G., Zahradníček, P., Caramelo, L., Skalák, P., Nunes, L. C. D. M., Douro, A., Mestre, O., Aguilar, E., et al. (2012)
Self-citationRienzner, M., & Ieva, F. (2016) · Journal of Applied Statistics · doi:10.1080/02664763.2016.1182127
Giaccone, E., Fratianni, S., Mari, S., Antognini, M., Ambrosi, C., & Scapozza, C. (2016) · Institutional Research Information System University of Turin (University of Turin) · doi:10.71910/supsi.8232
Self-citationRibeiro, S., Caineta, J., & Costa, A. C. (2017) · Quantitative geology and geostatistics · doi:10.1007/978-3-319-46819-8_63
Preliminary comparison study of two independent precipitation network in Piedmont
Acquaotta, F., Fratianni, S., & Venema, K. (2014) · Institutional Research Information System University of Turin (University of Turin)
Self-citationClimate impacts on tourism in Spain
Domonkos, P., Farré, F. X. M., & Duro, J. A. (2012) · Arcimis (State Meteorological Agency)
Self-citationEvidências de um tornado em Campinas em junho de 2016: considerações preliminares
Murara, P. G., & Ikefuti, P. V. (2017) · INSTITUTO DE GEOCIÊNCIAS - UNICAMP eBooks · doi:10.20396/sbgfa.v1i2017.2446
Cáceres, J. D. V. (2017) · Portuguese National Funding Agency for Science, Research and Technology (RCAAP Project by FCT)
EVALUATION OF HEAT WAVES OVER THE NORTH WESTERN ITALIAN ALPS
Garzena, D., Fratianni, S., & Acquaotta, F. (2015) · Institutional Research Information System University of Turin (University of Turin)
Self-citationAnálise de homogeneidade de temperatura mínima mensal para o Estado de São Paulo
de Carvalho, J. R. P., Nakai, A. M., Oliveira, A. F., & Assad, E. D. (2016) · infoteca-e (Brazilian Agricultural Research Corporation) · doi:10.13140/rg.2.1.4984.7924
Climatic or non-climatic warming in the spanish mediterranean?
Sala, J. Q., Chiva, E. M., & Vázquez, V. Q. (2017) · LA Referencia (Red Federada de Repositorios Institucionales de Publicaciones Científicas)
A new segmentation method for the homogenisation of GNSS-derived IWV time-seriesPreprint
Quarello, A., Bock, O., & Lebarbier, É. (2020) · arXiv (Cornell University) · doi:10.48550/arxiv.2005.04683
ACMANT: Homogenising temperature series with confidence and accuracy
Domonkos, P. (2012) · Arcimis (State Meteorological Agency)
Self-citationManara, V. (2016) · Atmospheric chemistry and physics · doi:10.5194/acp-2016-206-ac1
Acquaotta, F., Fratianni, S., Zandonadi, L., & Zavattini, J. A. (2014) · Institutional Research Information System University of Turin (University of Turin)
Self-citationBrönnimann, S. (2015) · Advances in global change research · doi:10.1007/978-3-319-19042-6_1
Skoglund, M. (2021) · Climate of the past · doi:10.5194/cp-2021-52-ac2
Micu, D. M., Dumitrescu, A., Cheval, S., & Birsan, M. (2014) · Springer atmospheric sciences · doi:10.1007/978-3-319-02886-6_5
Self-citationPappert, D. (2021) · Climate of the past · doi:10.5194/cp-2021-57-ac2
Brönnimann, S. (2022) · Climate of the past · doi:10.5194/cp-2022-10-ac2
Brönnimann, S. (2022) · Climate of the past · doi:10.5194/cp-2022-10-ac3
Accuracy of homogenization results
Domonkos, P., Tóth, R., & Nyitrai, L. (2023) · Elsevier eBooks · doi:10.1016/b978-0-323-90487-2.00001-3
Self-citationQuarello, A. (2020) · theses.fr (ABES) · doi:10.70675/dc51d901z5009z4796za291z02a698c80bc1 · Cited by 4
BMKG, J. (2018) · Jurnal Meteorologi dan Geofisika · doi:10.31172/jmg.v18i3.554
Sidenko, V., Kravchenko, I., Kyreieva, Z. M., & Pinchuk, D. (2023) · Метеорологія. Гідрологія. Моніторинг довкілля. · doi:10.15407/meteorology2023.03.027
Bongiovanni, G. (2024) · Earth system science data · doi:10.5194/essd-2024-285-ac1
Evaluation of the Stepwise Correction Module Used in the Pairwise Homogenisation Algorithm
Lindau, R. (2025) · International Journal of Climatology · doi:10.1002/joc.8865
Self-citationMarra, F. (2025) · doi:10.5194/egusphere-2024-2882-ac3
Lindau, R. (2025) · International Journal of Climatology · doi:10.1002/joc.8867
Self-citationTrypidaki, E., Pesquer, L., & Domingo‐Marimon, C. (2024) · IEEE International Workshop on Metrology for Agriculture and Forestry (MetroAgriFor) · doi:10.1109/metroagrifor63043.2024.10948835
TÖBBDIMENZIÓS ÉGHAJLATI IDŐSOROK EXTRÉMUMAINAK VIZSGÁLATA
Izsák, B. C. K. (2024) · Eötvös Loránd Tudományegyetem · doi:10.15476/elte.2023.040
CLIMATE CHANGE: TRUTHS AND FALLACIES
Filho, A. B. D. P. (2025) · Editora Científica Digital eBooks · doi:10.37885/250920129
Benova and Cenova Models in the Homogenization of Climatic Time Series
Domonkos, P. (2025) · Climate · doi:10.3390/cli13100199
Self-citationBokros, K., Izsák, B., Lakatos, M., & Pongrácz, R. (2025) · International Journal of Climatology · doi:10.1002/joc.70198
Self-citationLadinig, A., Jurkovic, A., Kaiser, A., Chimani, B., Matulla, C., Koch, E., Diendorfer, G., Kirchengast, G., Kerschner, H., Auer, I., et al. (2014) · Oesterreichisches Musiklexikon online (Institut für kunst- und musikhistorische Forschungen der Österreichischen Akademie der Wissenschaften)
Self-citationMaugeri, M. (2018) · Archivio Istituzionale della Ricerca (Universita Degli Studi Di Milano)
Homogenized and gridded daily surface air pressure data series in Hungary from 1901 to 2023
Szentes, O., Pongrácz, R., & Lakatos, M. (2025) · Időjárás · doi:10.28974/idojaras.2025.3.1
Self-citationCentury-Scale Climate Evolution in Semiarid High Plateaus, Algeria
Rouabhi, A. (2026) · Journal of Applied Meteorology and Climatology · doi:10.1175/jamc-d-25-0181.1 · Cited by 1
Homogenisation and Trend Analysis of Sunshine Duration in Romania for the 1961–2024 Period
LÜFTNER, G. F., Bandoc, G., Elena-Aurelia, T. E. N. E., Goia, I., & Dumitrescu, A. (2026) · International Journal of Climatology · doi:10.1002/joc.70275
Discrepancy in the sign of temperature trends in reanalysis datasets
Salvi, K. A., Raghav, P., Kumar, M., Magliocca, N. R., & Bisht, G. (2026) · Environmental Research Letters · doi:10.1088/1748-9326/ae5726
Hopuare, M. (2014) · theses.fr (ABES) · doi:10.70675/371bfcddz8e44z49a7zb50eza614f0884862 · Cited by 3
Comia, H. R. (2026) · Environmental Research Communications · doi:10.1088/2515-7620/ae603a
Miniandi, N. D., Jamal, M. H., Muhammad, M. K. I., & Shahid, S. (2026) · Physics and Chemistry of the Earth Parts A/B/C · doi:10.1016/j.pce.2026.104476
Saliba, Y., & Bărbulescu, A. (2026) · Water Resources Management · doi:10.1007/s11269-026-04734-9
METODOLOGI PENELITIAN SAINS ATMOSFER: PENDEKATAN OBSERVASIONAL DAN PEMODELAN STATISTIK-NUMERIK
Mulsandi, A. (2026) · Neliti
A Guide to Single Changepoint Tests for the Climate Researcher
Lund, R., & Shi, X. (2026) · Journal of Climate · doi:10.1175/jcli-d-25-0681.1
Long-term spatiotemporal evolution of annual and seasonal aridity across Saudi Arabia
Alnahit, A. O., & Alhathloul, S. H. (2026) · Theoretical and Applied Climatology · doi:10.1007/s00704-026-06449-8
Javanshiri, Z. (2026) · Research Square · doi:10.21203/rs.3.rs-11360813/v1
Guo, C., Liu, Y., Zhang, L., Wang, D., Lin, J., & Li, P. (2026) · Computers and Electronics in Agriculture · doi:10.1016/j.compag.2026.112263
Gourgouletis, N., & Baltas, E. A. (2026) · Geographies · doi:10.3390/geographies6030091
CNR Ozone Sounding Merged ( COSM ) Dataset From Existing Global Archives
Marra, F., Weatherhead, E. C., Tramutola, E., Rosoldi, M., & Madonna, F. (2026) · Geoscience Data Journal · doi:10.1002/gdj3.70094
Tsegaye, B., Kassa, A. K., & Moges, A. (2026) · Advances in Agriculture · doi:10.1155/aia/5146334
Schlegel, J., & Reyna, T. M. (2026) · Heliyon · doi:10.1016/j.heliyon.2026.e45355
Temporal Seam Score for Assessing Continuity at Known Transitions in Time SeriesPreprint
Jin, H. (2026) · arXiv (Cornell University) · doi:10.48550/arxiv.2609.15132
Metadata
- Authors
- Venema, V. K. C., Mestre, O., Aguilar, E., Auer, I., Guijarro, J. A., Domonkos, P., Vertacnik, G., Szentimrey, T., Stepanek, P., Zahradnicek, P., Viarre, J., Müller-Westermeier, G., Lakatos, M., Williams, C. N., Menne, M. J., Lindau, R., Rasol, D., Rustemeier, E., Kolokythas, K., Marinova, T., Andresen, L., Acquaotta, F., Fratianni, S., Cheval, S., Klancar, M., Brunetti, M., Gruber, C., Prohom Duran, M., Likso, T., Esteban, P., & Brandsma, T.
- Affiliations
- University of Bonn (DE)
- École Nationale de la Météorologie (FR)
- Universitat Rovira i Virgili (ES)
- Central Institution for Meteorology and Geodynamics (AT)
- Agencia Estatal de Meteorología (ES)
- Hungarian Meteorological Service (HU)
- National Oceanic and Atmospheric Administration (US)
- Croatian Meteorological and Hydrological Service (HR)
- University of Patras (GR)
- Bulgarian Academy of Sciences (BG)
- Norwegian Meteorological Institute (NO)
- University of Turin (IT)
- National Institute for Research and Development in Environmental Protection (RO)
- Slovenian Environment Agency (SI)
- Institute of Atmospheric Sciences and Climate (IT)
- Universitat de Barcelona (ES)
- Royal Netherlands Meteorological Institute (NL)
- ORCID
- Venue
- Climate of the Past
- Publisher
- Copernicus GmbH
- Published
- 2012-01-10
- Volume
- 8
- Issue
- 1
- Pages
- 89-115
- ISSN
- 1814-9324 (ISSN-L)
- 1814-9332
- OpenAlex
- W2734645652
- Cited by
- 368
- References
- 50
- Citations by year
- 2026: 14 · 2025: 21 · 2024: 19 · 2023: 22 · 2022: 23 · 2021: 23 · 2020: 20 · 2019: 21 · 2018: 28 · 2017: 25 · 2016: 35 · 2015: 32 · 2014: 33 · 2013: 25 · 2012: 25
- FWCI
- 30.58
- Type
- journal article
- Language
- en
- Open access
- gold
- doi.org
- Licence
- Locations
- Climate of the past (publishedVersion, cc-by)
- Institutional Research Information System University of Turin (University of Turin) (submittedVersion, cc-by)
- Institutional Research Information System University of Turin (University of Turin) (submittedVersion, other-oa)
- ASEP (submittedVersion, public-domain)
- DOAJ (DOAJ: Directory of Open Access Journals) (submittedVersion, cc-by-sa)
- Funders
- European Commission
- Deutsche Forschungsgemeinschaft
- Topics
- Physical Sciences › Environmental Science › Global and Planetary Change › Climate variability and models
- Physical Sciences › Earth and Planetary Sciences › Atmospheric Science › Precipitation Measurement and Analysis
- Physical Sciences › Environmental Science › Environmental Engineering › Urban Heat Island Mitigation
- Keywords
- monthly temperature data, linear trend estimation, station network
About these checks
Registry, retraction, Cites and statistics results are computed, not judged, with one exception: a printed reference that no index lists is read once by a model before it counts as a citation error. Claims are extracted by a model and kept only when their quote appears verbatim in the text; each cited source is then checked, with a model’s help, for whether it says what the claim relies on. Those verdicts can be wrong — read the claim’s quote and the cited source before relying on one.
Statistics and arithmetic are recomputed, not judged.
Confidence bands are shown only for fields calibrated on our annotated test set. None is calibrated yet, so no band is shown.
What counts as a claim ›How we measure confidence ›How we check this ›
Are you an author, or do you see a problem with this page? Request a review
Data sources
Bibliographic data: Semantic Scholar, OpenAlex, Crossref.
Contains information from the Semantic Scholar Academic Graph Datasets, made available under the ODC Attribution License (ODC-BY 1.0).
Semantic Scholar’s data is described in: Kinney, R., et al. (2023). The Semantic Scholar Open Data Platform. arXiv:2301.10140.
