

The DOI matches its Crossref record; 36 of the 36 references it cites were found in a registry or an index; none of the 16 sources its claims cite is checked for support yet.
Home advantage in EuroLeague basketball
Open accessAbstract
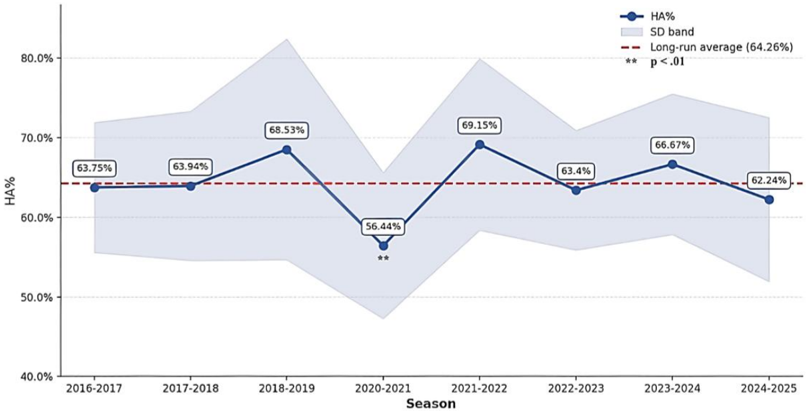
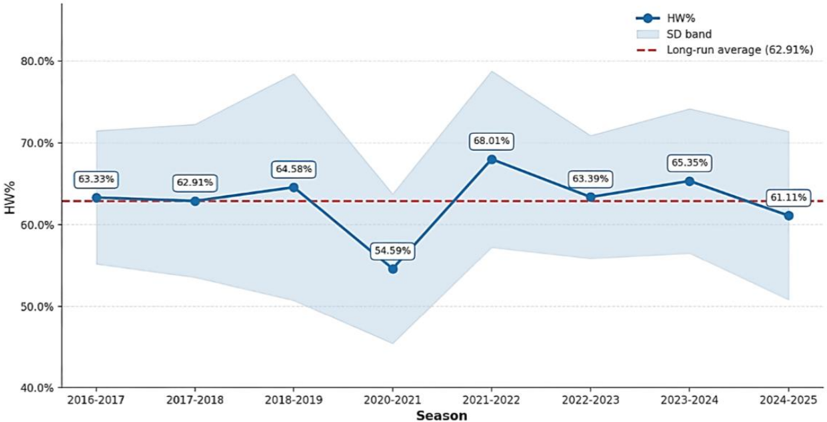
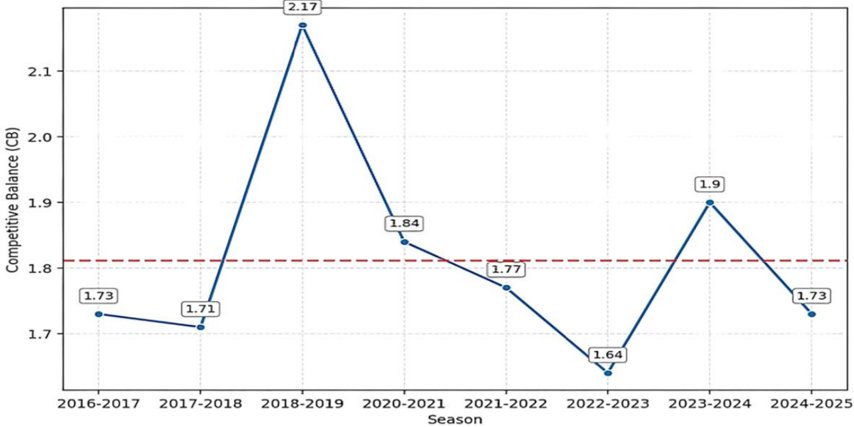
Home advantage (HA) remains a persistent phenomenon in elite basketball. This study quantified HA across eight EuroLeague seasons (2016–2025) and examined how team quality (TQ) and competitive balance (CB) influence it. Data from 2,154 regular-season games were obtained from the official EuroLeague website. HA% and home win percentage (HW%) were calculated, while CB was measured using the Standard Deviation Ratio (SDR). TQ was determined using a Two-Step Cluster Analysis based on win percentage (W%), classifying teams into high, medium, or low-quality groups. One-way ANOVA examined seasonal and TQ variation, while Spearman's correlation and multiple regression assessed relationships among the variables. The results showed that EuroLeague teams won 62.9% of home games on average. HA% peaked in 2021–2022 and dropped in 2020–2021, reflecting the impact of pandemic-related spectator restrictions. CB fluctuated moderately, with a notable imbalance in 2018–2019 (CB = 2.17). Regression results showed that TQ significantly predicted HA% (p < .01), with lower-quality teams exhibiting greater HA% effects (B = 10.06, SE = 2.15), whereas CB was not a significant predictor (p = .088). HA remains a consistent structural phenomenon in EuroLeague basketball, more likely due to psychological and situational factors, resilient to changes in league parity.
Overview
CoChat Summary
TL;DR
This study quantified home advantage (HA) across eight EuroLeague seasons (2016–2025, excluding 2019–2020), analyzing 2,154 regular-season games. It found home teams won 62.9% of games on average, with team quality significantly predicting HA% while competitive balance did not.
Key findings
- Across 2,154 games, there were 1,349 home wins and 805 home losses; average HW% was 62.9%, and long-term HA% was 64.26% ± 9.75.
- HA% varied significantly by season, F(7, 127) = 2.86, p < .001, η² = .136; 2020–2021 had the lowest HA% (56.44%) and HW% (54.59%), while 2021–2022 had the highest HA% (69.15%) and HW% (68.01%). Tukey comparisons showed 2020–2021 HA% was lower than 2018–2019 (mean difference = −12.09, p < .01) and 2021–2022 (mean difference = −12.71, p < .01).
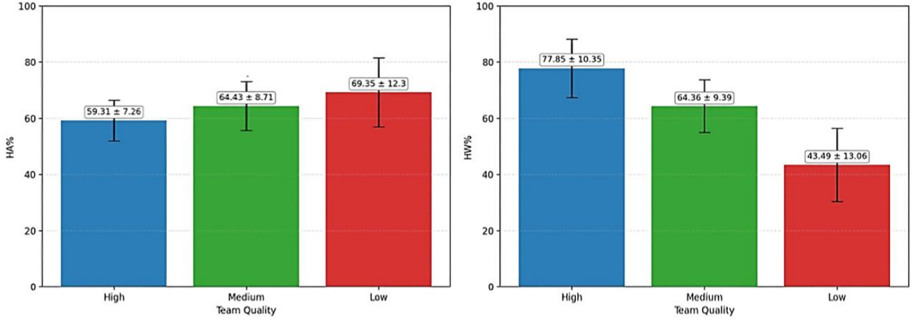
- Team quality significantly predicted HA%: regression F(3, 131) = 9.48, p < .001, R² = .179, AdjR² = .160, RMSE = 9.47. Compared with high-quality teams, medium-quality teams had 5.02% higher HA% (p = .007) and low-quality teams had 10.06% higher HA% (p < .001).
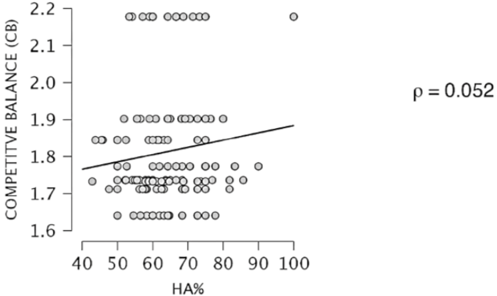
- Competitive balance was not a significant predictor of HA% (B = 8.96, SE = 5.98, p = .088), and the Spearman correlation between HA% and CB was small and non-significant (ρ = 0.052, p = .548). The 2018–2019 season showed notable imbalance (CB = 2.17).
Methods
- Data included all EuroLeague regular-season games from 2016–2017 to 2024–2025, excluding the COVID-19-suspended 2019–2020 season; the final dataset comprised 2,154 games, 28 teams, and 135 aggregated team-season cases from the official EuroLeague website.
- HA% was calculated as (HW/W) × 100; HW% as (HW/HG) × 100; competitive balance (CB) via the Standard Deviation Ratio (SDR = ASD/ISD); and team quality (TQ) via win percentage (W% = [(HW+AW)/G] × 100) plus Two-Step Cluster Analysis, yielding high- (W% = 65.9% ± 6.6%, n = 49), medium- (50.03% ± 4.5%, n = 44), and low-quality groups (31.3% ± 5.2%, n = 42).
- Analyses included Shapiro-Wilk normality tests, one-way ANOVA with Tukey post hoc tests, Spearman rank-order correlation, and multiple linear regression with bootstrapping (5,000 samples), VIF < 2, and JASP software.
Limitations
- The paper states that generalizability is limited by the study’s focus solely on the EuroLeague and by unmeasured factors known to influence HA; it recommends future research across other leagues and geographic contexts and the use of multilevel models including psychological, tactical, and situational factors.
- Evident from the text: the design is observational and archival, so causal claims cannot be established; CB was non-normally distributed (p < .05), although bootstrapping was used to address minor non-normality.
Model-written summary. Check it against the paper before relying on it.
Integrity signals
Registry
Cites
Statistics
Figures
Verification
Claims the paper makes
0 Valid · 0 Not valid · 13 Not checked · 74 Own results and interpretations
A result the paper reports from its own data — it cites no other source for it, so there is none to check. The quote shows it is in the paper.
In the paper
“Most other seasons clustered between approximately 63-67% (Figure 1).”
§ Home advantage in EuroLeague basketball: Quantifying the interactions between team quality, competitive balance, and season dynamics > VOLUME 21 | ISSUE 2 | 2026 | 657 RESULTS
plain- Asserted: passes — The authors put it forward as true.
- Checkable: passes — It can be checked against evidence.
- Load-bearing: unclear — It is unclear whether the paper’s conclusions depend on it.
- Based: passes — The paper gives a reason why it holds.
A result the paper reports from its own data — it cites no other source for it, so there is none to check. The quote shows it is in the paper.
In the paper
“and 2021-2022 (mean difference = -12.71,p < .01).”
§ Home advantage in EuroLeague basketball: Quantifying the interactions between team quality, competitive balance, and season dynamics > VOLUME 21 | ISSUE 2 | 2026 | 657 RESULTS
plain- Asserted: passes — The authors put it forward as true.
- Checkable: passes — It can be checked against evidence.
- Load-bearing: passes — The paper’s conclusions depend on it.
- Based: passes — The paper gives a reason why it holds.
A result the paper reports from its own data — it cites no other source for it, so there is none to check. The quote shows it is in the paper.
In the paper
“At the same time, smaller differences were observed between the high-medium and medium-low quality groups (p < .05).”
§ Home advantage in EuroLeague basketball: Quantifying the interactions between team quality, competitive balance, and season dynamics > VOLUME 21 | ISSUE 2 | 2026 | 657 RESULTS
plain- Asserted: passes — The authors put it forward as true.
- Checkable: passes — It can be checked against evidence.
- Load-bearing: unclear — It is unclear whether the paper’s conclusions depend on it.
- Based: passes — The paper gives a reason why it holds.
A result the paper reports from its own data — it cites no other source for it, so there is none to check. The quote shows it is in the paper.
In the paper
“The one-way ANOVA revealed that differences in HA% were statistically significant, F(2, 132) = 12.56, p < .001,indicating that mean HA% varied across TQs.”
§ Home advantage in EuroLeague basketball: Quantifying the interactions between team quality, competitive balance, and season dynamics > VOLUME 21 | ISSUE 2 | 2026 | 657 RESULTS
hedgedstates an association- Asserted: passes — The authors put it forward as true.
- Checkable: passes — It can be checked against evidence.
- Load-bearing: passes — The paper’s conclusions depend on it.
- Based: passes — The paper gives a reason why it holds.
A result the paper reports from its own data — it cites no other source for it, so there is none to check. The quote shows it is in the paper.
In the paper
“Tukey post hoc comparisons showed that the largest observed, but not significant, difference (p = .40)was between the 2021-2022 and 2020-2021 seasons, with the 2021-2022 season showing a 13.41% higher HW%.”
§ Home advantage in EuroLeague basketball: Quantifying the interactions between team quality, competitive balance, and season dynamics > VOLUME 21 | ISSUE 2 | 2026 | 657 RESULTS
plain- Asserted: passes — The authors put it forward as true.
- Checkable: passes — It can be checked against evidence.
- Load-bearing: unclear — It is unclear whether the paper’s conclusions depend on it.
- Based: passes — The paper gives a reason why it holds.
52 more claims
Create a free account to see all 87 claims and to verify the 7 references still open.
- It may state two separate claims as one. 26
- Probably not a substantial claim. 7
Statistics that don’t add up
Each reported p-value recomputed from its test statistic and degrees of freedom.
Rated minor: it would not touch a result — a value no result rests on, a p-value that stays on the same side of the significance level, or a conflict that is clerical, resolved elsewhere in the paper, or outside its own findings.
In the paper
“F (7, 127) = 2.86, p < .001”
§ Home advantage in EuroLeague basketball: Quantifying the interactions between team quality, competitive balance, and season dynamics > VOLUME 21 | ISSUE 2 | 2026 | 657 RESULTS
Reported p < .001 · recomputed p = .008
Statistics recomputed
Every reported test result, recomputed from its test statistic and degrees of freedom. A result shows as not adding up only once an independent check has confirmed it.
- Doesn’t add upF(7, 127) = 2.86reported p < .001 · recomputed p = .008
“F (7, 127) = 2.86, p < .001”
- ConsistentF(7, 127) = 0.82reported p = .57 · recomputed p = .572
“F (7, 127) = 0.82, p = .57”
- ConsistentF(2, 132) = 12.56reported p < .001 · recomputed p < .001
“F(2, 132) = 12.56, p < .001”
- ConsistentF(2, 132) = 110.06reported p < .001 · recomputed p < .001
“F (2, 132) = 110.06,p < .001”
- ConsistentF(3, 131) = 9.48reported p < .001 · recomputed p < .001
“F (3,131) = 9.48, p < .001”
Self-check
Percentages, sums and reported differences re-computed from the paper’s own numbers.
Each contradiction between two passages listed here was confirmed by an independent check.
Rated minor: it would not touch a result — a value no result rests on, a p-value that stays on the same side of the significance level, or a conflict that is clerical, resolved elsewhere in the paper, or outside its own findings.
In the paper
§ Home advantage in EuroLeague basketball: Quantifying the interactions between team quality, competitive balance, and season dynamics > VOLUME 21 | ISSUE 2 | 2026 | 659
“The only exception was the 2018-2019 season, which dips below the usual range”
§ Home advantage in EuroLeague basketball: Quantifying the interactions between team quality, competitive balance, and season dynamics > CONCLUSION
“| 2018-2019 | 240 | 155 | 85 | 68.53 ± 13.86 | 64.58 ± 19.88 | 2.17 |”
Citations
Cites
Statistical Power Analysis for the Behavioral Sciences
Cohen, J. (2013) · doi:10.4324/9780203771587 · Cited by 25,373
The Home Advantage In Sport Competitions: A Literature Review
Courneya, K. S., & Carron, A. V. (1992) · Journal of Sport and Exercise Psychology · doi:10.1123/jsep.14.1.13 · Cited by 561
Home Advantage in Sport: An Overview of Studies on the Advantage of Playing at Home
Nevill, A. M., & Holder, R. L. (1999) · Sports Medicine · doi:10.2165/00007256-199928040-00001 · Cited by 383
Ethical principles of psychologists and code of conduct
American Psychological Association (2002) · American Psychologist · doi:10.1037//0003-066x.57.12.1060 · Cited by 304
The Home Field Advantage in Athletics: A Meta‐Analysis
Jamieson, J. P. (2010) · Journal of Applied Social Psychology · doi:10.1111/j.1559-1816.2010.00641.x · Cited by 207
Comparison of home advantage in men's and women's football leagues in Europe
Pollard, R., & Gómez, M. (2012) · European Journal of Sport Science · doi:10.1080/17461391.2011.651490 · Cited by 140
Comparison of the Home Advantage in Nine Different Professional Team Sports in Spain
Gómez, M., Pollard, R., & Pascual, L. C. (2011) · Perceptual and Motor Skills · doi:10.2466/05.pms.113.4.150-156 · Cited by 110
Global differences in home advantage by country, sport and sex
Pollard, R., Prieto, J., & Gómez, M.-Á. (2017) · International Journal of Performance Analysis in Sport · doi:10.1080/24748668.2017.1372164 · Cited by 69
The “Home Advantage” in Athletic Competitions
Allen, M. S., & Jones, M. V. (2014) · Current Directions in Psychological Science · doi:10.1177/0963721413513267 · Cited by 63
McHill, A. W., & Chinoy, E. D. (2020) · Scientific Reports · doi:10.1038/s41598-020-78901-2 · Cited by 52
Research works printed but not linked: 9
- Durmuş, T., & Gülü, M. (2022). Comparison of the home-court performances of successful and unsuccessful teams at Euroleague before and after Covıd-19 pandemic. P.A.S.E., 1(1), 31-40.
- Field, A. (2018). Discovering statistics using IBM SPSS Statistics (5th ed.). Sage.
- Foteinakis, P. F., & Pavlidou, S. P. (2024). Evolution of three-point field goals shooting trends in EuroLeague basketball. Trends in Sport Sciences, 31(4). https://doi.org/10.23829/TSS.2024.31.4-2 · DOI
- Kulenović, T., & Demšar, J. (2024). A quantitative analysis of home advantage in top football and basketball leagues. Electrotechnical Review/Elektrotehniski Vestnik, 91(4), 157-183. Retrieved from [Accessed 2026, 06 March]: http://www.dlib.si
- Pojskić, H., Šeparović, V., & Užičanin, E. (2011). Modelling home advantage in basketball at different levels of competition. Acta Kinesiol., 5(1), 25-30.
- Pollard, R., & Gómez Ruano, M. Á. (2013). Variations in home advantage in the national basketball leagues of Europe. Rev. Psicol. Deporte, 22(1), 263-266.
- Pollard, R., & Gómez, M. Á. (2015a). Comparison of home advantage in college and professional team sports in the United States. Coll. Antropol., 39(3), 583-589.
- Pollard, R., & Gómez, M. A. (2007). Home advantage analysis in different basketball leagues according to team ability. In: Iberian congress on basketball research, 4(1), 61-64.
- Pollard, R., & Pollard, G. (2005). Home advantage in soccer: A review of its existence and causes. Int. J. Soccer Sci., 3(1), 28-38.
Cited by
STUPARIU, M. I., FEFLEA, I., & GHERDAN, J.-M. (2026) · Geosport for Society · doi:10.30892/gss.2506-156
Metadata
- Authors
- Foteinakis, P. F., Pavlidou, S., Karamousalidis, G., Zaras, N., Stampoulis, T., Kokkotis, C., Avloniti, A., & Chatzinikolaou, A.
- Affiliations
- Democritus University of Thrace (GR)
- Aristotle University of Thessaloniki (GR)
- ORCID
- Venue
- Journal of Human Sport and Exercise
- Published
- 2026-03-18
- Volume
- 21
- Issue
- 2
- Pages
- 653
- ISSN
- 1988-5202 (ISSN-L)
- OpenAlex
- W7138962875
- Cited by
- 1
- References
- 36
- Citations by year
- 2026: 1
- FWCI
- 4.26
- Type
- journal article
- Language
- en
- Open access
- gold
- doi.org
- Licence
- Locations
- Journal of Human Sport and Exercise (publishedVersion, cc-by-nc-sa)
- Topics
- Social Sciences › Economics, Econometrics and Finance › Economics and Econometrics › Sports Analytics and Performance
- Health Sciences › Medicine › Orthopedics and Sports Medicine › Sports Performance and Training
- Social Sciences › Psychology › Developmental and Educational Psychology › Sport Psychology and Performance
- Keywords
- home advantage, Euroleague, basketball, team quality, competitive balance, standard deviation ratio, COVID-19 pandemic impact, elite sport
About these checks
Registry, retraction, Cites and statistics results are computed, not judged, with one exception: a printed reference that no index lists is read once by a model before it counts as a citation error. Claims are extracted by a model and kept only when their quote appears verbatim in the text; each cited source is then checked, with a model’s help, for whether it says what the claim relies on. Those verdicts can be wrong — read the claim’s quote and the cited source before relying on one.
A language model drew the claims from the paper on 2026-11-14, under version 3 of the claim definition (model deepseek-v4.1-flash, prompt extract-v3).
A second model labelled each claim on 2026-11-14 (model jev-1.13-20260917, definition revision gold-guideline-v0.2).
Statistics and arithmetic are recomputed, not judged.
Confidence bands are shown only for fields calibrated on our annotated test set. None is calibrated yet, so no band is shown.
What counts as a claim ›How we measure confidence ›How we check this ›
Are you an author, or do you see a problem with this page? Request a review
How to cite
Cite CoChat for the checks on this page, and the paper for its own findings.
- This page
- CoChat. (2026). Citation check: Home advantage in EuroLeague basketball. https://app.cochat.ai/papers/10.55860/hmh4yd04
- The paper
- Foteinakis, P. F., Pavlidou, S., Karamousalidis, G., Zaras, N., Stampoulis, T., Kokkotis, C., Avloniti, A., & Chatzinikolaou, A. (2026). Home advantage in EuroLeague basketball. Journal of Human Sport and Exercise. https://doi.org/10.55860/hmh4yd04
Data sources
Bibliographic data: Semantic Scholar, OpenAlex, Crossref.
Contains information from the Semantic Scholar Academic Graph Datasets, made available under the ODC Attribution License (ODC-BY 1.0).
Semantic Scholar’s data is described in: Kinney, R., et al. (2023). The Semantic Scholar Open Data Platform. arXiv:2301.10140.
